
|
市場調査レポート
商品コード
1851562
再生可能エネルギー:市場シェア分析、産業動向、統計、成長予測(2025年~2030年)Renewable Energy - Market Share Analysis, Industry Trends & Statistics, Growth Forecasts (2025 - 2030) |
||||||
カスタマイズ可能
適宜更新あり
|
|||||||
| 再生可能エネルギー:市場シェア分析、産業動向、統計、成長予測(2025年~2030年) |
|
出版日: 2025年07月05日
発行: Mordor Intelligence
ページ情報: 英文 125 Pages
納期: 2~3営業日
|

概要
再生可能エネルギー市場規模は、2025年の5,080ギガワットから2030年には7,040ギガワットに拡大し、予測期間(2025-2030年)のCAGRは8.94%になると予想されます。
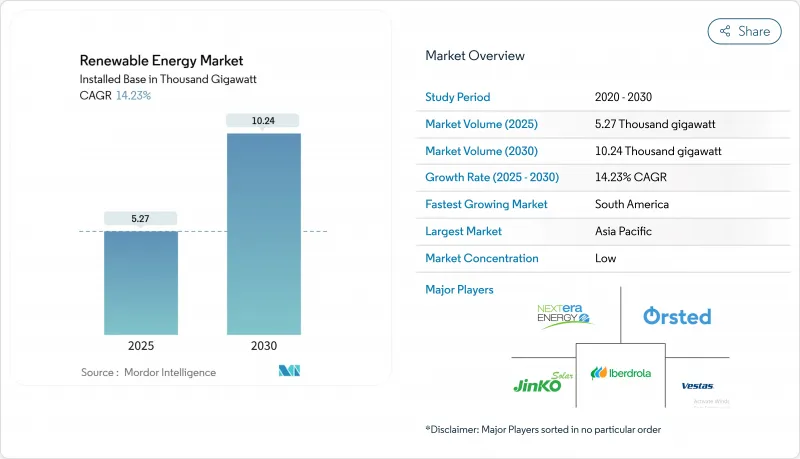
技術コストの急落、政府の支援政策、企業需要の高まりがこの拡大を支えています。2024年の再生可能エネルギー市場は、太陽光発電が容量の42%を占めてリードしており、2030年までのCAGRは13%と予測されます。公益事業規模のプロジェクトが成長の基幹であることに変わりはないが、企業が不安定な化石燃料価格をヘッジし、持続可能性目標を強化するにつれて、商業・産業用(C&I)の設置が勢いを増しています。アジア太平洋地域が最大のシェアを占めているが、南米は投資促進改革と豊富な風力・太陽光資源を背景に、最も急速に成長しています。
世界の再生可能エネルギー市場の動向と洞察
北米と欧州で電力購入契約による大規模発電所の建設が加速
企業向け電力購入契約(CPPA)は、ハイテク企業や製造業がAI、クラウド、重工業業務のためにクリーンな電力を確保するため、今や再生可能エネルギー調達の中心となっています。例えば、ENGIEが2024年に締結した4.3GWをカバーする85件のCPPAは、136TWhの供給に相当します。企業の自主的なオフテイク契約は、すでに米国の新規電力事業規模の約半分を支えており、開発者に銀行収入を提供し、資本コストを引き下げています。柔軟性の高い「バーチャル」PPAは、買い手が物理的な引き渡しを受けることなく価格リスクをヘッジすることを可能にするが、グリッド料金の上昇や複雑な契約は依然として中小企業の足かせとなっています。
ハイパースケールのデータセンター需要が北欧とアイルランドの太陽光・風力調達を後押し
データセンターの電力需要は、2024年の415TWhから2030年には945TWhに達すると予測されています。事業者は冷涼な気候と豊富な自然エネルギーを求めて北欧とアイルランドを選ぶ。マイクロソフトは2024年5月、アイルランドのレナレア風力発電所から30メガワットの風力発電を追加する長期CPPAに調印しました。ワークロードシフトにより、データセンターは余剰風力を吸収する柔軟な負荷として機能し、抑制を減らし、再生可能エネルギー市場の統合能力を高めることができます。
ERCOT(米国)と内モンゴル(中国)における送電網の混雑と抑制リスク
ERCOTにおける太陽光と風力の抑制は2024年に29%増加し340万MWhとなります。テキサス州西部の資源とまばらな送電がボトルネックとなっており、同様の制約が再生可能エネルギー市場を停滞させている中国の内モンゴルを反映しています。蓄電池と系統増強装置は実行可能な解決策だが、導入が容量追加に遅れるため、開発業者の収益が悪化し、将来のプロジェクトが抑止されています。
セグメント分析
2024年の発電容量は太陽光発電が42%を占め、2030年までのCAGRは13%です。実用規模の太陽光発電は、現在多くの国で最も安価な新規発電の選択肢となっています。ペロブスカイト・シリコン・タンデムセルが31.6%の実験室効率を達成したこともあり、再生可能エネルギー市場規模は2030年までに80%拡大すると予測されます。しかし、モジュールの供給過剰は生産者の利幅を圧迫しており、中国からの輸入品への依存度を下げるために米国や欧州での国内生産への多角化を促しています。
中国の砂漠地帯の太陽光発電基地やインドのウルトラメガ・パークなどの大規模設備は、従来型電力とのコスト・パリティを推進する規模の経済を示しています。住宅用屋根への導入も、第三者所有や仮想ネットメータリングによって改善され、家庭の初期費用を軽減しています。こうした動向は、再生可能エネルギー市場容量における太陽光発電の主要な貢献者としての役割を確固たるものにしています。
陸上風力と洋上風力は、再生可能エネルギー市場に多様性をもたらし、年率約8%で成長しています。洋上風力発電のタービンの定格出力は18MWを超え、基礎あたりのエネルギー獲得量が増加しています。しかし、インフレとサプライチェーンのストレスにより、コストは入札水準を上回り、電力購入契約の再交渉、場合によっては解約を余儀なくされています。洋上風力発電の再生可能エネルギー市場規模は、2025年までに倍増すると予測されているが、事業者は資本配分のリスクを軽減するため、より予測しやすい政策を求めています。
欧州における使用済みブレードのリサイクル義務や、インドにおけるローカルコンテンツ規制は、サプライチェーンが遅れれば政策がいかにコストを膨張させるかを示しています。低コストのアジア製タービンとの競合により、欧米のメーカーは市場での存在感を維持するため、サービス契約、デジタル最適化、モジュール設計に力を入れるようになっています。
再生可能エネルギー市場レポートは、技術別(太陽エネルギー、風力エネルギー、水力発電、バイオエネルギー、地熱、海洋エネルギー)、エンドユーザー別(公益事業、商業・産業、住宅)、地域別(北米、アジア太平洋、欧州、南米、中東・アフリカ)に分類されています。市場規模および予測は、設置容量(GW)で提供されます。
地域別分析
アジア太平洋は再生可能エネルギー市場容量の55%を占め、2024年の世界新規追加容量の64%を中国が占める。インドの再生可能エネルギー市場規模は、インセンティブ制度により2030年までに4倍の62GWに拡大し、東南アジア諸国は蓄電と送電網の制約に取り組みます。海外からの直接投資は2024年に580億米ドルを超え、政策のばらつきにもかかわらず投資家の信頼を裏付けています。
南米はCAGR 16%と最も速い成長を遂げます。ブラジルは2024年に太陽光発電と風力発電の増設を記録したが、送電料金の上昇と許認可の遅れが投資家の意欲を削いでいます。チリとコロンビアも、スポット市場の流動性の高まりに助けられ、商用の太陽光発電プロジェクトを拡大しています。
北米は、インフレ削減法における米国の税額控除の恩恵を受けています。太陽光発電容量は2025年までに35%増加するが、送電網の混雑がプロジェクトの稼働を遅らせています。テキサス州や中西部では、データセンターのニーズと豊富な風力・太陽光資源を合致させるため、企業向けPPAが調達の主流となっています。
欧州では、REPowerEUを通して、2030年までに1200万kWの自然エネルギーを目標としています。スペインは送電網のボトルネックにもかかわらず再生可能エネルギー容量を倍増させ、イタリアは柔軟性に報いる容量市場改革を試験的に実施しています。欧州の風力発電部門では、低コストの中国メーカーとのサプライチェーン競合が課題となっているが、許認可ルールの改正によりリードタイムは短縮されています。
中東・北アフリカでは、安価な太陽熱を利用したグリーン水素の開発が進んでいます。サウジアラビアは2024年の入札で、200万kWのアル・サダウィ・プロジェクトを含む370万kWの太陽光発電を候補に挙げました。エジプトのBenban複合施設とUAEのAl Dhafraプラントは、国内送電網と将来の水素輸出ハブに供給する大規模な建設を示しています。
その他の特典:
- エクセル形式の市場予測(ME)シート
- 3ヶ月間のアナリスト・サポート
よくあるご質問
目次
第1章 イントロダクション
- 調査の前提条件と市場の定義
- 調査範囲
第2章 調査手法
第3章 エグゼクティブサマリー
第4章 市場情勢
- 市場概要
- 再生可能エネルギーミックス、2024年
- 市場促進要因
- 企業の電力購入契約により北米と欧州で電力規模の拡大が加速
- ハイパースケールのデータセンター需要が北欧とアイルランドの太陽風力調達を後押し
- グリーン水素のギガワットパイプラインが中東・北アフリカとオーストラリアの容量増加を牽引
- EUの「REPowerEU」、南欧の陸上風力発電のリードタイムを短縮(12ヵ月未満)する高速許可制度
- 市場抑制要因
- ERCOT(米国)と内モンゴル自治区(中国)における送電網の混雑と停止リスク
- ドイツとフランスでコストが上昇する使用済み風力タービンブレード廃棄物規制
- 長期貯蔵の不足が東南アジアのVRE普及を遅らせる
- インドとブラジルの洋上風力発電設備投資を押し上げる現地調達義務
- サプライチェーン分析
- 規制の見通し
- テクノロジーの展望
- 最近の動向
- ポーターのファイブフォース
- 供給企業の交渉力
- 消費者の交渉力
- 新規参入業者の脅威
- 代替品の脅威
- 競争企業間の敵対関係
第5章 市場規模と成長予測
- 技術別
- 太陽エネルギー(PVおよびCSP)
- 風力エネルギー(陸上および海上)
- 水力発電(小型、大型、PSH)
- バイオエネルギー
- 地熱
- 海洋エネルギー(潮汐と波)
- エンドユーザー別
- ユーティリティ
- 商業・産業
- 住宅
- 地域別
- 北米
- 米国
- カナダ
- メキシコ
- 欧州
- 英国
- ドイツ
- フランス
- スペイン
- 北欧諸国
- ロシア
- その他欧州地域
- アジア太平洋地域
- 中国
- インド
- 日本
- 韓国
- マレーシア
- タイ
- インドネシア
- ベトナム
- オーストラリア
- その他アジア太平洋地域
- 南米
- ブラジル
- アルゼンチン
- コロンビア
- その他南米
- 中東・アフリカ
- アラブ首長国連邦
- サウジアラビア
- 南アフリカ
- エジプト
- その他中東・アフリカ地域
- 北米
第6章 競合情勢
- 市場集中度
- 戦略的な動き(M&A、JV、資金調達、PPA)
- 市場シェア分析(主要企業の市場ランク/シェア)
- 企業プロファイル
- EPCディベロッパー/オペレーター/所有者
- NextEra Energy, Inc.
- Orsted A/S
- Iberdrola, S.A.
- EDF Renewables(EDF S.A.)
- Duke Energy Corporation
- Berkshire Hathaway Energy
- Acciona Energia S.A.
- Engie S.A.
- China Three Gorges Corporation
- Enel Green Power S.p.A.
- Statkraft A.S.
- Pattern Energy Group
- Invenergy LLC
- RWE Renewables GmbH
- ACWA Power
- EDP Renovaveis S.A.
- Brookfield Renewable Partners L.P.
- ReNew Energy Global PLC
- Scatec ASA
- 機器サプライヤー
- First Solar, Inc.
- Vestas Wind Systems A/S
- Siemens Gamesa Renewable Energy S.A.
- GE Vernova(General Electric)
- JinkoSolar Holding Co. Ltd.
- Canadian Solar Inc.
- Longi Green Energy Technology Co., Ltd.
- Goldwind Science & Technology Co., Ltd.
- Trina Solar Co., Ltd.
- Enphase Energy, Inc.
- Sungrow Power Supply Co., Ltd.
- Mitsubishi Power, Ltd.
- Nordex SE
- MHI Vestas Offshore Wind A/S
- Shanghai Electric Group Co., Ltd.
- Hitachi Energy Ltd.
- ABB Ltd.
- Climeon AB
- Pelamis Wave Power Ltd.(in Administration)
- Ocean Power Technologies, Inc.
- EPCディベロッパー/オペレーター/所有者
