
|
市場調査レポート
商品コード
1684103
インドネシアの肥料:市場シェア分析、産業動向・統計、成長予測(2025年~2030年)Indonesia Fertilizer - Market Share Analysis, Industry Trends & Statistics, Growth Forecasts (2025 - 2030) |
||||||
カスタマイズ可能
適宜更新あり
|
|||||||

| インドネシアの肥料:市場シェア分析、産業動向・統計、成長予測(2025年~2030年) |
|
出版日: 2025年03月18日
発行: Mordor Intelligence
ページ情報: 英文 271 Pages
納期: 2~3営業日
|

- 全表示
- 概要
- 目次
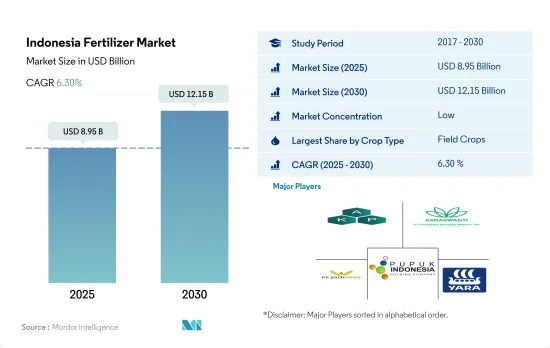
インドネシアの肥料市場規模は2025年に89億5,000万米ドルと予測され、2030年には121億5,000万米ドルに達し、予測期間(2025-2030年)のCAGRは6.30%で成長すると予測されています。
国内では畑作物が肥料消費の大半を占める
- 2022年には、畑作物がインドネシアの肥料市場の92.3%を占め、39億3,000万米ドルに達しました。特に、稲は同国の主要な畑作作物であり、インドネシアは中国とインドに次ぐ世界第3位の米生産国です。インドネシアにおける稲作の主要地域は、南スマトラ、西ジャワ、中部ジャワ、東ジャワ、南スラウェシです。
- 畑作分野では慣行肥料が最も高いシェアを占め、2022年には76.0%を占め、残りの24.0%は特殊肥料です。特殊肥料の中では、慣行肥料分野が2023年から2030年にかけてCAGR 6.1%を記録すると予測されています。
- 園芸作物は2022年にインドネシアの肥料市場の9.3%を占めました。バランスの取れた食生活における果物と野菜の重要性を考えると、2016年にインドネシア人が推奨摂取量の43%しか消費していなかったことは注目に値します。さらに、過去5年間で、この消費量は減少し、推奨レベルの半分を下回っています。インドネシア人の1日当たり平均果物・野菜消費量は173グラムで、推奨摂取量の400グラムを大幅に下回っており、この分野の成長の可能性を示しています。
- 2022年には、芝生と観賞用作物はインドネシアの肥料市場の1.0%未満を占めたが、これは栽培面積が限られていることが主な理由であり、同国の作物総面積のわずか0.03%にすぎないです。
- インドネシアの芝・観賞用肥料市場は、特にサッカー場のようなスポーツ競技場からの需要増に牽引され、上昇基調にあります。この分野は、2023年から2030年にかけてCAGR 6.2%を記録すると予測されています。
インドネシアの肥料市場動向
インドネシアは自給自足を目指し、耕作面積を拡大中
- インドネシアでは、2022年の耕作面積の89.9%を畑作物が占めています。コメ、トウモロコシ、キャッサバ、大豆、ピーナッツがインドネシアで栽培されている主要な畑作物です。2022年には、コメが畑作物栽培総面積の56.7%を占める。稲はインドネシア全土の低地と高地の両方で栽培されており、高地での栽培は一般的に天水栽培で、施肥量は低レベルです。稲作はジャワ島に集中しているが、スマトラ島とスラウェシ島でも盛んです。これら3島を合わせると、全国のコメ生産量の約89%を占めています。インドネシアでは通常、稲の生育期間は3期あり、雨期作物が1期、乾期作物が2期です。全生産量の約45%は、10月から12月に栽培され、3月から4月に収穫される雨期作物によるものです。
- トウモロコシはインドネシアで水稲に次いで多く栽培されている作物で、農地の約10.8%を占めています。トウモロコシはインドネシアの1,800万人以上の主食であり、1,000万以上の農家で栽培されています。とうもろこしの生産は、2022年にはジャワ・テンガ(とうもろこし総生産量の16%)、ランプン(とうもろこし総生産量の9%)、スラウェシ・スラタン(とうもろこし総生産量の8%)、スマテラ・ウタラ(とうもろこし総生産量の7%)など、さまざまな地域に集中しています。
- インドネシアは世界最大のコメ生産国であるにもかかわらず、2022年にはタイ、ベトナム、インド、パキスタンなどから約50万トンのコメを輸入します。自給率の向上と輸入の抑制を目指し、インドネシアは生産性の向上に注力しており、肥料市場はその推進力となっています。
一次栄養素の中でも、畑作では窒素の施用量が多い
- 窒素、リン、カリウムは植物の成長に欠かせない主要栄養素です。窒素(N)とリン(P)は、植物組織に不可欠なタンパク質と核酸の主要成分です。一方、カリウム(K)は、収穫された植物製品の品質を高める上で極めて重要な役割を果たしています。インドネシアでは、稲、小麦、大豆、トウモロコシが主要な畑作作物です。これらの作物への平均施肥量は、窒素が223.8kg/ha、リンが57.3kg/ha、カリウムが88.0kg/haです。
- 主要養分のうち、窒素の施用量が最も多く、畑作物では平均223.8kg/haです。窒素肥料を適切に使用すると、穀物の品質が向上し、新梢の成長が促進され、丈夫な花芽がつくられます。また、初期の窒素施肥は耕起を促進し、作物の収量を増加させる。リンは、2022年の施用量が57.3kg/haで、主要栄養素の中で第2位です。リンは穀物の開発に重要な役割を果たし、早期の根の生長、蘖(ひこばえ)の形成、粒の充満を助ける。
- 2022年、インドネシアの畑作物へのカリウム施用量は平均88.0kg/haでした。カリウム欠乏症状は、まず下葉に現れます。カリウムは植物体内で古い葉から若い葉に移行しやすいからです。この症状は黄変として現れ、先端から基部に向かって、外葉の縁に沿ってネクローシス(組織死)へと進行します。一次栄養素の欠乏は、植物の健康、成長、収穫量に大きな影響を与えます。主要な食用作物の収穫面積が拡大していることから、畑作物における一次栄養素の需要は増加の一途をたどっています。
インドネシア肥料産業の概要
インドネシアの肥料市場は細分化されており、上位5社で39.73%を占めています。この市場の主要企業は以下の通りです。Asia Kimindo Prima, PT Saraswanti Anugerah Makmur Tbk(SAMF), PT. JADI MAS, Pupuk Indonesia(Persero)and Yara International ASA(sorted alphabetically).
その他の特典
- エクセル形式の市場予測(ME)シート
- 3ヶ月のアナリストサポート
目次
第1章 エグゼクティブサマリーと主な調査結果
第2章 レポートのオファー
第3章 イントロダクション
- 調査の前提条件と市場定義
- 調査範囲
- 調査手法
第4章 主要産業動向
- 主要作物の作付面積
- 畑作物
- 園芸作物
- 平均養分施用率
- 微量栄養素
- 畑作物
- 園芸作物
- 一次栄養素
- 畑作物
- 園芸作物
- 二次多量栄養素
- 畑作物
- 園芸作物
- 微量栄養素
- 灌漑農地
- 規制の枠組み
- バリューチェーンと流通チャネル分析
第5章 市場セグメンテーション
- タイプ
- 複合型
- ストレート
- 微量栄養素
- ホウ素
- 銅
- 鉄
- マンガン
- モリブデン
- 亜鉛
- その他
- 窒素
- 尿素
- その他
- リン酸
- DAP
- MAP
- TSP
- その他
- ポタシック
- MoP
- SoP
- その他
- 二次栄養素
- カルシウム
- マグネシウム
- 硫黄
- 形態
- 従来型
- 特殊
- CRF
- 液体肥料
- SRF
- 水溶性
- 施肥モード
- 施肥
- 葉面散布
- 土壌
- 作物タイプ
- 畑作物
- 園芸作物
- 芝・観賞用
第6章 競合情勢
- 主要な戦略動向
- 市場シェア分析
- 企業情勢
- 企業プロファイル
- Asia Kimindo Prima
- Grupa Azoty S.A.(Compo Expert)
- Haifa Group
- PT Saraswanti Anugerah Makmur Tbk(SAMF)
- PT. JADI MAS
- Pupuk Indonesia(Persero)
- Yara International ASA
第7章 CEOへの主な戦略的質問
第8章 付録
- 世界概要
- 概要
- ファイブフォース分析フレームワーク
- 世界のバリューチェーン分析
- 市場力学(DROs)
- 情報源と参考文献
- 図表一覧
- 主要洞察
- データパック
- 用語集
The Indonesia Fertilizer Market size is estimated at 8.95 billion USD in 2025, and is expected to reach 12.15 billion USD by 2030, growing at a CAGR of 6.30% during the forecast period (2025-2030).
Field crops dominate the consumption of fertilizers in the country
- In 2022, field crops dominated the fertilizer market in Indonesia, representing 92.3% of the market's value, which amounted to USD 3.93 billion. Notably, rice is the primary field crop in the country, with Indonesia ranking as the world's third-largest rice producer, trailing only China and India. Key regions for rice cultivation in Indonesia include South Sumatra, West Java, Central Java, East Java, and South Sulawesi.
- Conventional fertilizers held the highest share in the field crop segment, accounting for 76.0% in 2022, while specialty fertilizers made up the remaining 24.0%. Within the specialty fertilizers category, the conventional segment is projected to record a CAGR of 6.1% between 2023 and 2030.
- Horticultural crops constituted 9.3% of Indonesia's fertilizer market in 2022. Given the importance of fruits and vegetables in a balanced diet, it is worth noting that in 2016, Indonesians consumed only 43% of the recommended intake. Furthermore, over the past five years, this consumption has declined, falling below half of the recommended levels. On average, Indonesians consumed 173 grams of fruits and vegetables per day, significantly lower than the recommended 400 grams, indicating potential for growth in this segment.
- In 2022, turf and ornamental crops made up less than 1.0% of Indonesia's fertilizer market, primarily due to their limited cultivation area, accounting for a mere 0.03% of the country's total crop area.
- The turf and ornamental fertilizer market in Indonesia is witnessing an upward trajectory, driven by rising demand, particularly from sports stadiums like football fields. This segment is projected to witness a CAGR of 6.2% between 2023 and 2030.
Indonesia Fertilizer Market Trends
Indonesia is aiming for the self-sufficiency driving the area under cultivation
- In Indonesia, field crops accounted for 89.9% of the total cultivated area in 2022. Rice, corn, cassava, soybeans, and peanuts are major field crops grown in Indonesia. In 2022, rice accounted for 56.7% of the total area under field crops. Rice is cultivated in both lowland and upland elevations throughout Indonesia, with the upland crop typically being rainfed and receiving only low levels of fertilizer applications. Rice cultivation is heavily concentrated in Java but is also prevalent in Sumatra and Sulawesi. These three islands together contribute about 89% of total national rice production. There are typically three rice growing periods or seasons in Indonesia, a single wet-season crop followed by two dry-season crops. Approximately 45% of total production is usually from the wet season crop, cultivated from October to December and harvested from March through April.
- Corn is the second largely cultivated crop in Indonesia after paddy, occupying about 10.8% of agricultural land. Corn is the staple foodstuff in Indonesia for more than 18 million people and is grown by more than 10 million farm households. Corn production was concentrated in various regions, including Jawa Tengah (16% of total corn production), Lampung (9% of total corn production), Sulawesi Selatan (8% of total corn production), and Sumatera Utara (7% of total corn production) in 2022.
- Despite being the world's largest rice producer, Indonesia imported approximately 500,000 tons of rice in 2022 from countries like Thailand, Vietnam, India, and Pakistan. In a bid to bolster self-sufficiency and curb imports, Indonesia's focus on enhancing productivity is set to propel its fertilizers market.
Among all the primary nutrients, nitrogen is applied in a higher quantity in field crops
- Nitrogen, phosphorus, and potassium are the primary nutrients crucial for plant growth. Nitrogen (N) and phosphorus (P) are key components of proteins and nucleic acids, integral to plant tissues. Meanwhile, potassium (K) plays a pivotal role in enhancing the quality of harvested plant products. In Indonesia, the prominent field crops are rice, wheat, soybean, and corn. On average, these crops receive nutrient application rates of 223.8 kg/ha for nitrogen, 57.3 kg/ha for phosphorus, and 88.0 kg/ha for potassium.
- Out of the primary nutrients, nitrogen sees the highest application rate, averaging 223.8 kg/ha for field crops. Nitrogenous fertilizers, when appropriately used, contribute to improved grain quality, accelerated shoot growth, and the production of robust flower buds. Early-stage nitrogen fertilization also stimulates tillering and boosts crop yields. Phosphorus, with an application rate of 57.3 kg/ha in 2022, ranks second among the primary nutrients. It plays a vital role in the development of cereal crops, aiding in early root growth, tiller formation, and grain filling.
- In 2022, field crops in Indonesia received an average potassium application rate of 88.0 kg/ha. Potassium deficiency symptoms are first visible on the lower leaves, as potassium is easily translocated from older to younger leaves within the plant. These symptoms manifest as yellowing, progressing to necrosis (tissue death) along the outer leaf margins, starting from the tip and moving toward the base. The absence of primary nutrients can significantly impact plant health, growth, and crop yield. Given the expanding harvested area for major food crops, the demand for primary nutrients in field crops is poised to rise.
Indonesia Fertilizer Industry Overview
The Indonesia Fertilizer Market is fragmented, with the top five companies occupying 39.73%. The major players in this market are Asia Kimindo Prima, PT Saraswanti Anugerah Makmur Tbk (SAMF), PT. JADI MAS, Pupuk Indonesia (Persero) and Yara International ASA (sorted alphabetically).
Additional Benefits:
- The market estimate (ME) sheet in Excel format
- 3 months of analyst support
TABLE OF CONTENTS
1 EXECUTIVE SUMMARY & KEY FINDINGS
2 REPORT OFFERS
3 INTRODUCTION
- 3.1 Study Assumptions & Market Definition
- 3.2 Scope of the Study
- 3.3 Research Methodology
4 KEY INDUSTRY TRENDS
- 4.1 Acreage Of Major Crop Types
- 4.1.1 Field Crops
- 4.1.2 Horticultural Crops
- 4.2 Average Nutrient Application Rates
- 4.2.1 Micronutrients
- 4.2.1.1 Field Crops
- 4.2.1.2 Horticultural Crops
- 4.2.2 Primary Nutrients
- 4.2.2.1 Field Crops
- 4.2.2.2 Horticultural Crops
- 4.2.3 Secondary Macronutrients
- 4.2.3.1 Field Crops
- 4.2.3.2 Horticultural Crops
- 4.2.1 Micronutrients
- 4.3 Agricultural Land Equipped For Irrigation
- 4.4 Regulatory Framework
- 4.5 Value Chain & Distribution Channel Analysis
5 MARKET SEGMENTATION (includes market size in Value in USD and Volume, Forecasts up to 2030 and analysis of growth prospects)
- 5.1 Type
- 5.1.1 Complex
- 5.1.2 Straight
- 5.1.2.1 Micronutrients
- 5.1.2.1.1 Boron
- 5.1.2.1.2 Copper
- 5.1.2.1.3 Iron
- 5.1.2.1.4 Manganese
- 5.1.2.1.5 Molybdenum
- 5.1.2.1.6 Zinc
- 5.1.2.1.7 Others
- 5.1.2.2 Nitrogenous
- 5.1.2.2.1 Urea
- 5.1.2.2.2 Others
- 5.1.2.3 Phosphatic
- 5.1.2.3.1 DAP
- 5.1.2.3.2 MAP
- 5.1.2.3.3 TSP
- 5.1.2.3.4 Others
- 5.1.2.4 Potassic
- 5.1.2.4.1 MoP
- 5.1.2.4.2 SoP
- 5.1.2.4.3 Others
- 5.1.2.5 Secondary Macronutrients
- 5.1.2.5.1 Calcium
- 5.1.2.5.2 Magnesium
- 5.1.2.5.3 Sulfur
- 5.2 Form
- 5.2.1 Conventional
- 5.2.2 Speciality
- 5.2.2.1 CRF
- 5.2.2.2 Liquid Fertilizer
- 5.2.2.3 SRF
- 5.2.2.4 Water Soluble
- 5.3 Application Mode
- 5.3.1 Fertigation
- 5.3.2 Foliar
- 5.3.3 Soil
- 5.4 Crop Type
- 5.4.1 Field Crops
- 5.4.2 Horticultural Crops
- 5.4.3 Turf & Ornamental
6 COMPETITIVE LANDSCAPE
- 6.1 Key Strategic Moves
- 6.2 Market Share Analysis
- 6.3 Company Landscape
- 6.4 Company Profiles
- 6.4.1 Asia Kimindo Prima
- 6.4.2 Grupa Azoty S.A. (Compo Expert)
- 6.4.3 Haifa Group
- 6.4.4 PT Saraswanti Anugerah Makmur Tbk (SAMF)
- 6.4.5 PT. JADI MAS
- 6.4.6 Pupuk Indonesia (Persero)
- 6.4.7 Yara International ASA
7 KEY STRATEGIC QUESTIONS FOR FERTILIZER CEOS
8 APPENDIX
- 8.1 Global Overview
- 8.1.1 Overview
- 8.1.2 Porter's Five Forces Framework
- 8.1.3 Global Value Chain Analysis
- 8.1.4 Market Dynamics (DROs)
- 8.2 Sources & References
- 8.3 List of Tables & Figures
- 8.4 Primary Insights
- 8.5 Data Pack
- 8.6 Glossary of Terms
