
|
市場調査レポート
商品コード
1644271
地中ユーティリティマッピング:市場シェア分析、産業動向・統計、成長予測(2025~2030年)Underground Utility Mapping - Market Share Analysis, Industry Trends & Statistics, Growth Forecasts (2025 - 2030) |
||||||
カスタマイズ可能
適宜更新あり
|
|||||||
| 地中ユーティリティマッピング:市場シェア分析、産業動向・統計、成長予測(2025~2030年) |
|
出版日: 2025年01月05日
発行: Mordor Intelligence
ページ情報: 英文 100 Pages
納期: 2~3営業日
|

全表示
- 概要
- 目次
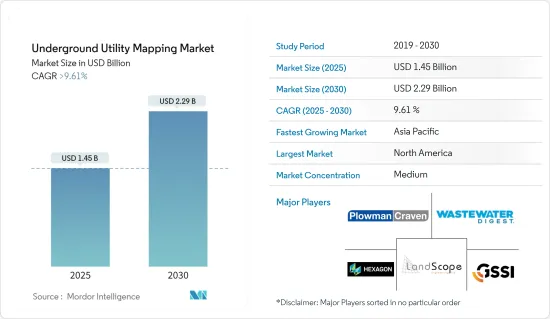
地中ユーティリティマッピング市場規模は2025年に14億5,000万米ドルと推定・予測され、予測期間中(2025-2030年)のCAGRは9.61%を超え、2030年には22億9,000万米ドルに達すると予測されます。
地中ユーティリティマッピング市場を推進している主な要因は、特に新興国市場における経済活動の活発化と、地下埋設物の維持を目的とした政府の取り組みの増加の2つです。
主なハイライト
- 近年、地中ユーティリティエンジニアリング(SUE)業界は最前線に立ち、地中ユーティリティインフラのマッピングという課題に対する革新的なソリューションを生み出しています。電磁ロケーターや地中レーダーなどの物理学的技術と、過去の記録のような非技術的手法を融合させることで、この業界は地下インフラの包括的なデータセットを蓄積することができます。
- さらに、世界経済フォーラム(WEF)は、2030年までに都市の灰色インフラへの世界の投資額が10兆5,480億米ドルに急増すると予測しています。このような途方もない都市開拓投資は、地中ユーティリティマッピング市場に大きな成長機会をもたらします。
- 都市化が加速する中、スマートシティの世界的動向も活発化しています。国連は、2050年までに都市人口がインドで4億400万人、中国で2億9,200万人、ナイジェリアで2億1,200万人増加すると予測しています。
- 一方、新興大陸であるラテンアメリカは、最も急速に都市化が進んでいます。数多くの世界のスマートシティ・プロジェクトが動き出し、国際的な投資が殺到しています。経済協力開発機構(OECD)の試算によると、2010年から2030年にかけて、スマートシティ構想への世界の投資は、大都市インフラ・プロジェクト全体を含めて1兆8,000億米ドル近くに達します。このようなスマートシティ開発の急増は、地中ユーティリティマッピング市場の需要を増幅させる。
- 都市開発ではしばしば見落とされがちなインフラ計画は、複雑な施設のシームレスな運用に不可欠です。この取り組みにおいて極めて重要なツールが3Dユーティリティマッピングであり、地域とそのユーティリティの3次元的な視点を提供します。この方法では、構造図や電気配線とともに、上下水道やガス管などの地下データを取得します。詳細な3Dユーティリティマップとコンセプト・サイト・モデル(CSM)を武器に、プランナーは課題を迅速に特定し、効果的な解決策を考案することができます。
- 新技術とユーティリティマップを融合させることで、地中ユーティリティマッピング市場は変革を遂げつつあります。これらの進歩は、探査活動の正確性、効率性、安全性を強化します。その結果、探査チームは地下インフラに関連する課題を巧みにナビゲートし、ルートを合理化し、リスクを軽減することができるようになり、市場の成長を促進し、イノベーションを促進しています。
- 地中レーダー(GPR)はターゲットの水平位置をピンポイントで特定するのに優れているが、様々な要因が深度測定の速度と精度を左右します。土壌の種類と含水率は極めて重要です。例えば、砂や粘土のような課題土壌では、レーダー信号は遅くなります。水分の多い材料はさらに信号速度に影響します。このように、さまざまな材料におけるGPR信号の正確な速度を特定することは課題であるが、一般的に推定精度は90%前後です。
地中ユーティリティマッピング市場動向
地中レーダーが最大のコンポーネント型ソリューションになる見込み
- 地中レーダー(GPR)は、ユーティリティマッピングのための最良の選択肢として際立っており、MHzとGHzの範囲の指向性電磁波を放射します。これらの信号のリターンを分析することにより、GPRは地下のユーティリティインフラの位置を正確に突き止めます。
- GPR技術は、金属と非金属の両方のユーティリティを識別することに長けています。ユーティリティマッピング調査において、迅速なデータ取得、費用対効果、高解像度の画像は、ユーティリティサーベイヤーに好まれています。
- ユーティリティマッピング以外にも、GPRはコンクリート構造物を評価するための非破壊的なツールとして機能し、鉄筋の配置、スラブの厚さ、空洞や導管の存在に関する洞察を明らかにします。この非侵襲的なアプローチは、正確な結果を保証するだけでなく、進行中の建設プロジェクトの中断を最小限に抑えます。
- 将来を見据えた動きとして、ドローンメーカーはGPR対応のドローンを製造しており、地下の公共施設を検出する態勢が整うことで、急成長する市場機会を示唆しています。
- 天然ガスパイプラインの拡大に伴い、精密なマッピングとモニタリングの需要が高まっています。地中貫通技術は、周辺環境を保護しながら、パイプラインの状態を特定、識別、評価する上で極めて重要な役割を果たします。2024年2月現在、GGONのデータは、世界のガスパイプラインにおける中国の優位性を強調しています。442のパイプラインが稼働中であり、さらに302のパイプラインが計画中または建設中であることから、中国のパイプライン・ネットワークは、1,500を超える稼働中のガス・パイプラインという世界の数字に大きく貢献しています。
北米が最大の市場シェアを占める
- 北米では、急速な都市化と人口増加が既存のインフラ・システムに負担をかけており、地中ユーティリティマッピング・サービスの需要が高まっています。都市部は複雑で密度が高いため、工事中の地下埋設物への損傷を防ぐため、正確なマッピングが必要となります。
- National Underground Asset Registry Advisory Groupの報告によると、地下埋設物の位置特定という課題は、米国経済に年間約500億米ドルの損失をもたらしています。この問題はまた、過去20年間に1,500人以上の負傷者と400人近くの死者を出しています。さらに、地中ユーティリティマッピングの不正確さは、高速道路建設の遅れに大きく寄与しています。このような不確実性が、同地域における先進技術ベースのソリューションの採用を後押ししています。
- 北米の数多くの都市や自治体が、スマートシティ構想への投資を進めています。これらの取り組みは、より良いインフラ管理、公共サービスの強化、資源配分の最適化のために技術を活用することを目的としています。その中で、地中ユーティリティマッピングは、インフラ資産管理と計画立案に不可欠なデータを提供し、極めて重要な役割を果たしています。
- この地域では、地下埋設物に関するデータ、特に建設中に把握されたデータを共有する方法を開発する取り組みが進められています。特筆すべき例は、シカゴ市のパイロット・プログラムで、データ収集と地下鉄の3Dマップ共有のためのプラットフォームの導入を目的としています。
- 地域のプレーヤーは、より大きな市場シェアを獲得するために無機的な成長戦略を採用するようになっており、このセグメントの成長をさらに促進しています。さらに、この地域の多くの公共事業部門は、地下埋設物の位置を特定するためにGIS技術を活用しています。
地中ユーティリティマッピング産業の概要
地中ユーティリティマッピング市場は、世界の大手企業と多数の中小企業が共存していることを特徴とし、半固体的な様相を呈しています。市場を形成している主なプレーヤーは、Hexagon AB、GSSI Geophysical Survey Systems Inc.、LandScope Engineering Ltd.、Plowman Craven Limited、Geospatial Corporationなどです。これらのプレーヤーは、戦略的にパートナーシップや買収を活用し、製品提供を強化し、競争力を確保しています。
例えば、2024年4月、地下埋設物被害防止で著名なUSIC, LLC(以下「USIC」)は、米国陸軍のPartnership for Your Success(PaYS)プログラムと公式提携を結びました。このイニシアチブは、米軍兵士に国に貢献する機会を提供すると同時に、兵役後のキャリアに備えるものです。パートナーシップの調印式はUSIC本社で行われ、イベントはインディアナ陸軍州兵新兵維持大隊が主催しました。PaYSパートナーに認定されたUSICは、兵士が陸軍での任期を終えた後、面接と就職の機会を提供することを約束します。この戦略的提携は、兵士の民間生活へのスムーズな移行を促進するだけでなく、米国陸軍が企業部門との強い関係を育むことに尽力していることを強調するものでもあります。
その他の特典:
- エクセル形式の市場予測(ME)シート
- 3ヶ月間のアナリスト・サポート
目次
第1章 イントロダクション
- 調査の前提条件と市場定義
- 調査範囲
第2章 調査手法
第3章 エグゼクティブサマリー
第4章 市場洞察
- 市場概要
- 業界の魅力度-ポーターのファイブフォース分析
- 新規参入業者の脅威
- 買い手/消費者の交渉力
- 供給企業の交渉力
- 代替品の脅威
- 競争企業間の敵対関係
第5章 市場力学
- 市場促進要因
- 探査活動を向上させるユーティリティマップと組み合わせた新技術
- 検出アプリケーションの利用可能性の増加とマーケティング支出に対するリターンの増加
- 市場の課題
- マッピングツールのメンテナンスコストの高さ
第6章 地中ユーティリティマッピング市場へのCOVID-19の影響
第7章 市場セグメンテーション
- コンポーネントタイプ別
- ソリューション
- 地中レーダー
- 電磁ロケーター
- その他のソリューション
- サービス
- ソリューション
- エンドユーザー産業別
- 公共安全
- 石油・ガス
- 建築・建設
- 通信業界
- 電気
- その他のエンドユーザー産業
- 地域別
- 北米
- 欧州
- アジア
- オーストラリア・ニュージーランド
- ラテンアメリカ
- 中東・アフリカ
第8章 競合情勢
- 企業プロファイル
- Hexagon AB
- GSSI Geophysical Survey Systems Inc.
- Landscope Engineering Ltd
- Plowman Craven Limited
- Geospatial Corporation
- Vivax-Metrotech Corp.
- Maverick Inspection Ltd
- Red Laser Scanning
- Technics Group
- multiVIEW Locates Inc.
第9章 投資分析
第10章 市場の将来
The Underground Utility Mapping Market size is estimated at USD 1.45 billion in 2025, and is expected to reach USD 2.29 billion by 2030, at a CAGR of greater than 9.61% during the forecast period (2025-2030).
Two primary factors are propelling the underground utility mapping market: heightened economic activities, especially in developing nations, and increasing government initiatives aimed at maintaining these underground utilities.
Key Highlights
- In recent years, the subsurface utility engineering (SUE) industry has been at the forefront, crafting innovative solutions to the challenges of mapping underground utility infrastructures. By melding geophysical technologies, such as electromagnetic locators and ground-penetrating radars, with non-technical methods like historical records, the industry is able to amass a comprehensive dataset of subsurface infrastructures.
- Moreover, the World Economic Forum anticipates that global investments in urban grey infrastructure will skyrocket to USD 10,548 billion by 2030. Such monumental urban development investments herald a significant growth opportunity for the underground utility mapping market.
- As urbanization accelerates, the global trend of smart cities is gaining traction. The United Nations projects that by 2050, urban populations will swell by 404 million in India, 292 million in China, and 212 million in Nigeria.
- Meanwhile, Latin America, an emerging continent, is experiencing the swiftest urbanization. With numerous global smart city projects in motion, international investments are pouring in. The Organization for Economic Cooperation and Development (OECD) estimates that from 2010 to 2030, global investments in smart city initiatives will near USD 1.8 trillion, encompassing all metropolitan infrastructure projects. This surge in smart city developments is set to amplify demand in the underground utility mapping market.
- Infrastructure planning, often sidelined in urban development, is vital for the seamless operation of complex facilities. A pivotal tool in this endeavor is 3D utility mapping, which provides a three-dimensional perspective of an area and its utilities. This method captures subsurface data, encompassing water, sewer, and gas lines, alongside structural maps and electrical wiring. Armed with a detailed 3D utility map and a Conceptual Site Model (CSM), planners can swiftly pinpoint challenges and devise effective solutions.
- By merging emerging technologies with utility maps, the underground utility mapping market is undergoing a transformation. These advancements bolster the accuracy, efficiency, and safety of exploration activities. Consequently, exploration teams can adeptly navigate challenges tied to underground infrastructure, streamline their routes, and mitigate risks, driving the market's growth and fostering innovation.
- While Ground Penetrating Radar (GPR) excels at pinpointing the horizontal locations of targets, various factors can sway the speed and precision of depth measurements. Soil type and moisture content are pivotal. For instance, radar signals slow down in challenging soils like sand and clay. Moisture-rich materials further influence signal speed. Thus, while pinpointing the exact speed of GPR signals across different materials poses challenges, estimates generally hover around 90% accuracy.
Underground Utility Mapping Market Trends
Ground Penetrating Radar is Expected to be the Largest Component Type Solution
- Ground-penetrating radar (GPR) stands out as the premier choice for utility mapping, emitting directional electromagnetic waves in the MHz and GHz range. By analyzing the return of these signals, GPR accurately pinpoints the location of underground utility infrastructure.
- GPR technology is notably adept at identifying both metallic and nonmetallic utilities. Utility surveyors favor GPR for its swift data acquisition, cost-effectiveness, and high-resolution imagery in utility mapping surveys.
- Beyond utility mapping, GPR serves as a non-destructive tool for evaluating concrete structures, revealing insights on rebar placements, slab thickness, and the presence of voids or conduits. This non-invasive approach not only ensures precise results but also minimizes disruptions to ongoing construction projects.
- In a forward-looking move, drone manufacturers are crafting GPR-enabled drones, hinting at a burgeoning market opportunity as they become poised to detect underground utilities.
- With the expansion of natural gas pipelines, the demand for precise mapping and monitoring intensifies. Ground penetration techniques play a pivotal role in locating, identifying, and evaluating pipeline conditions, all while safeguarding the surrounding environment. As of February 2024, data from GGON highlights China's dominance in the global gas pipeline landscape. Boasting 442 operational pipelines and an additional 302 either proposed or under construction, China's network is a significant contributor to the global tally of over 1,500 operational gas pipelines.
North America Holds Largest Market Share
- In North America, rapid urbanization and population growth are straining existing infrastructure systems, leading to a heightened demand for underground utility mapping services. The complexity and density of urban areas necessitate precise mapping to prevent damage to underground utilities during construction.
- The National Underground Asset Registry Advisory Group reports that the challenge of locating underground utilities costs the U.S. economy approximately USD 50 billion annually. This issue has also led to over 1,500 injuries and nearly 400 fatalities in the past two decades. Furthermore, inaccuracies in underground utility mapping contribute significantly to delays in highway construction. Such uncertainties are driving the adoption of advanced technology-based solutions in the region.
- Numerous cities and municipalities across North America are channeling investments into smart city initiatives. These efforts aim to harness technology for better infrastructure management, enhanced public services, and optimized resource allocation. Within this context, underground utility mapping plays a pivotal role, offering vital data for infrastructural asset management and planning.
- Efforts are underway in the region to develop methods for sharing data on underground utilities, especially those captured during construction. A notable example is the City of Chicago's pilot program, which aims to deploy a platform for data collection and sharing a 3D map of the subway.
- Regional players are increasingly adopting inorganic growth strategies to capture larger market shares, further propelling the segment's growth. Additionally, many public works departments in the region are utilizing GIS technology to pinpoint the locations of underground utilities.
Underground Utility Mapping Industry Overview
The underground utility mapping market features a semi-consolidated landscape, characterized by the coexistence of global giants and a multitude of small to medium-sized enterprises. Key players shaping the market include Hexagon AB, GSSI Geophysical Survey Systems Inc., LandScope Engineering Ltd, Plowman Craven Limited, and Geospatial Corporation. These players are strategically leveraging partnerships and acquisitions to bolster their product offerings and secure a competitive edge.
For example, in April 2024, USIC, LLC ("USIC"), a prominent player in underground utility damage prevention, forged an official partnership with the U.S. Army's Partnership for Your Success (PaYS) Program. This initiative provides American soldiers with opportunities to serve their country while simultaneously preparing for their post-service careers. The partnership was ceremoniously signed at USIC's corporate headquarters, with the event being hosted by the Indiana Army National Guard Recruiting and Retention Battalion. As a recognized PaYS Partner, USIC pledges to offer soldiers an interview and a shot at employment once they conclude their Army tenure. This strategic alliance not only facilitates a smoother transition for soldiers into civilian life but also underscores the US Army's dedication to nurturing strong relationships with the corporate sector.
Additional Benefits:
- The market estimate (ME) sheet in Excel format
- 3 months of analyst support
TABLE OF CONTENTS
1 INTRODUCTION
- 1.1 Study Assumptions and Market Definition
- 1.2 Scope of the Study
2 RESEARCH METHODOLOGY
3 EXECUTIVE SUMMARY
4 MARKET INSIGHTS
- 4.1 Market Overview
- 4.2 Industry Attractiveness - Porter's Five Forces Analysis
- 4.2.1 Threat of New Entrants
- 4.2.2 Bargaining Power of Buyers/Consumers
- 4.2.3 Bargaining Power of Suppliers
- 4.2.4 Threat of Substitute Products
- 4.2.5 Intensity of Competitive Rivalry
5 MARKET DYNAMICS
- 5.1 Market Drivers
- 5.1.1 Emerging Technologies Combined With Utility Maps to Improve the Exploration Activities
- 5.1.2 Increasing Availability of Detecting Applications and Increased Return on Marketing Spending
- 5.2 Market Challenges
- 5.2.1 Significantly High Maintenance Costs of Mapping Tools
6 IMPACT OF COVID-19 ON THE UNDERGROUND UTILITY MAPPING MARKET
7 MARKET SEGMENTATION
- 7.1 By Component Type
- 7.1.1 Solutions
- 7.1.1.1 Ground Penetrating Radar
- 7.1.1.2 Electromagnetic Locators
- 7.1.1.3 Other Solutions
- 7.1.2 Services
- 7.1.1 Solutions
- 7.2 By End-user Industry
- 7.2.1 Public Safety
- 7.2.2 Oil and Gas
- 7.2.3 Building and Construction
- 7.2.4 Telecommunication
- 7.2.5 Electricity
- 7.2.6 Other End-user Industries
- 7.3 By Geography
- 7.3.1 North America
- 7.3.2 Europe
- 7.3.3 Asia
- 7.3.4 Australia and New Zealand
- 7.3.5 Latin America
- 7.3.6 Middle East and Africa
8 COMPETITIVE LANDSCAPE
- 8.1 Company Profiles
- 8.1.1 Hexagon AB
- 8.1.2 GSSI Geophysical Survey Systems Inc.
- 8.1.3 Landscope Engineering Ltd
- 8.1.4 Plowman Craven Limited
- 8.1.5 Geospatial Corporation
- 8.1.6 Vivax-Metrotech Corp.
- 8.1.7 Maverick Inspection Ltd
- 8.1.8 Red Laser Scanning
- 8.1.9 Technics Group
- 8.1.10 multiVIEW Locates Inc.
