
|
市場調査レポート
商品コード
1851391
米国のソーラーエネルギー:市場シェア分析、産業動向、統計、成長予測(2025年~2030年)United States Solar Energy - Market Share Analysis, Industry Trends & Statistics, Growth Forecasts (2025 - 2030) |
||||||
カスタマイズ可能
適宜更新あり
|
|||||||
| 米国のソーラーエネルギー:市場シェア分析、産業動向、統計、成長予測(2025年~2030年) |
|
出版日: 2025年07月05日
発行: Mordor Intelligence
ページ情報: 英文 150 Pages
納期: 2~3営業日
|

概要
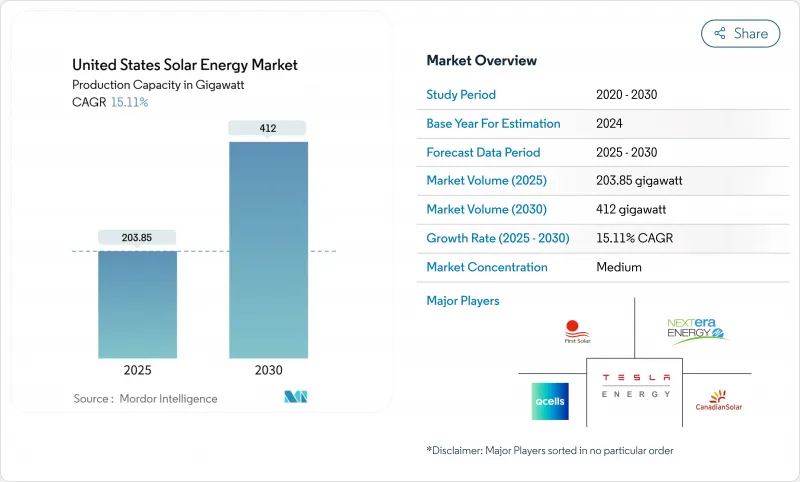
米国のソーラーエネルギーの設置ベース市場規模は、2025年の203.85ギガワットから2030年には412ギガワットまで、予測期間(2025-2030年)のCAGRは15.11%で成長すると予測されます。
この規模では、2025年の米国のソーラーエネルギー市場規模は、太陽光発電が2024年に記録された全発電量増加の53%を占め、新規電力容量の供給源として国内で最も急成長していると位置づけられます。成長には、インフレ抑制法(IRA)に基づく10年間の安定した税制優遇措置、モジュール需要の70%を供給できるようになった国内製造基盤の拡大、低炭素電力購入契約を求める企業需要の3つの柱があります。高照度地域では平準化コストが40米ドル/MWhを下回ったため、開発業者は引き続き電力会社規模のプロジェクトを選好しているが、多くの州で投資回収期間を7年未満に短縮するゼロダウンファイナンスを金融機関が展開したため、分散型発電が加速しています。相互接続の待ち行列と送電の混雑が依然として大きな障害となっているが、計画的な送電網投資と太陽光+蓄電のハイブリッド発電所の採用により、2026年以降、抑制圧力が緩和されると予想されます。
米国のソーラーエネルギー市場動向と洞察
インフレ抑制法の優遇税制が電力会社規模のPPAを加速
IRAは30%の投資税額控除を10年間延長し、開発者に第2の収益化ルートを提供する生産税額控除を導入しました。国内コンテンツやエネルギー・コミュニティに対するボーナス控除と組み合わせることで、太陽光が豊富な地域のプロジェクトは50米ドル/MWh以下の長期PPAを締結することができ、マイクロソフトのブルックフィールドとの10.5GW契約(企業によるクリーン電力契約としてはこれまでで最大)のような取引が促進されます。2025年に開始される徒弟制度の規定も、熟練労働者のパイプラインを構築し、数ギガワットのパイプラインのリスク軽減に役立っています。
プロジェクトのバンカビリティを高めるグリッド・エッジ・ストレージのペア
太陽光発電と蓄電池のハイブリッド発電所は、2024年末までに49GWの太陽光発電と360万kWの蓄電池の稼働に達します。蓄電池は、日中の余剰出力を夕方のピークにシフトさせることにより、有効容量係数を40%以上まで引き上げるが、これはCAISOとERCOT市場における重要な利点です。相互接続待ち行列には、すでに599GWのハイブリッド容量案がリストアップされているが、これは、混雑したノードでは単体の太陽光発電は商業的に最適ではないとする金融機関の見方が強まっていることを示しています。
相互接続待ち行列のボトルネックがリードタイムを長くする
2024年の全国的な接続待ち行列は2.6TWに膨れ上がり、平均調査期間は36ヶ月を超えました。CAISOはアップグレード待ちの太陽光発電を200GW以上リストアップしており、ERCOTも同様の渋滞に見舞われています。DOEのi2X改革はクラスター研究を合理化するだろうが、ほとんどの地域送電機関はその実施に少なくとも2年を必要としています。
セグメント分析
2024年の米国のソーラーエネルギー市場では、モジュール価格の安さとサプライチェーンの成熟により太陽光発電が92%のシェアを占め、圧倒的な強さを見せた。このポジションにより、同セグメントはTOPConやヘテロ接合設計に基づく新しい国内セルラインを拡大する明確な道筋を得た。しかし、集光型太陽熱発電(CSP)にはPVにはない蓄熱やプロセス熱の特性があり、熱源を脱炭素化する産業ユーザーの増加に伴い、CSPの2030年までのCAGR予測は17%となっています。ネバダ州のCrescent Dunes revivalと、5セント/kWhを目標とするGen3 CSPプロトタイプは、直達日射量が7kWh/m2/日を超える場所でもニッチな導入が可能であることを示しています。
7GWを超えるTOPConとHJTの容量拡張計画により、国内モジュール効率は2024年平均の21%から世界のフロンティアである25%へと上昇するはずです。それでも、生産者が立ち上げリスクを管理するため、短期的にはPERCに優位性があります。CSPはおそらく南西部に集中すると思われるが、500℃の蒸気を必要とする製油所やセメント工場に足がかりができるかもしれないです。両技術が成長するにつれて、CSPに割り当てられる米国のソーラーエネルギー市場規模は、2030年までに総発電容量の約5%に達する可能性があり、発電プロファイルの多様化を通じて系統回復力を向上させる。コスト・パリティの目標は、IRAの継続的な支援と高温溶融塩タワーの合理化された許認可に依存しています。
本市場セグメンテーションでは、太陽光発電の種類(太陽光発電、集光型太陽光発電)、架台の種類(地上設置型、屋上設置型、浮体設置型)、最終用途(ユーティリティスケール、商業用・産業用、住宅用)別に市場規模および予測を掲載しています。市場規模および予測は、設置容量(GW)で提供されます。
その他の特典:
- エクセル形式の市場予測(ME)シート
- 3ヶ月間のアナリストサポート
よくあるご質問
目次
第1章 イントロダクション
- 調査の前提条件と市場の定義
- 調査範囲
第2章 調査手法
第3章 エグゼクティブサマリー
第4章 市場情勢
- 市場概要
- 市場促進要因
- インフレ削減法(IRA)税制優遇措置が事業規模PPAを加速する
- プロジェクトのバンカビリティを高めるグリッド-エッジストレージのペアリング
- 企業のネット・ゼロ義務化がC&Iの電力購入契約に拍車をかける
- 人口の多い州でのアクセスを拡大するコミュニティ・ソーラー・プログラム
- 国内製造クレジットモジュール輸入リスクの削減
- 中西部の土地利用経済を改善するアグリボルタイクス
- 市場抑制要因
- 相互接続待ち行列のボトルネックでリードタイムが36ヵ月を超える
- モジュール価格変動を引き起こす201/301条貿易措置
- 南西部のユーティリティ・プロジェクトを抑制する送電渋滞の増加
- 熟練労働者不足でEPCコストが前年比18%以上上昇
- サプライチェーン分析
- 規制・政策の見通し(連邦+州)
- 技術的展望(TOPCon、HJT、ペロブスカイト、バイフェイシャル)
- ポーターのファイブフォース
- 新規参入業者の脅威
- サプライヤーの交渉力
- 買い手の交渉力
- 代替品の脅威(代替品の脅威(風力、RNG、長期貯蔵))
- 競争企業間の敵対関係
- PESTEL分析
第5章 市場規模と成長予測
- タイプ別
- 太陽光発電(PV)
- 集光型ソーラー発電(CSP)
- 架台タイプ別
- 地上設置型
- 屋上
- 浮体式ソーラー
- 最終用途別
- ユーティリティスケール
- 商業・産業
- 住宅
第6章 競合情勢
- 市場集中度
- 戦略的な動き(M&A、パートナーシップ、PPA)
- 市場シェア分析(主要企業の市場ランク/シェア)
- 企業プロファイル
- First Solar Inc.
- NextEra Energy Inc.
- SunPower Corporation
- Hanwha Q CELLS USA Corp.
- Canadian Solar Inc.
- JinkoSolar Holding Co. Ltd.
- Tesla Energy
- Sunrun Inc.
- 8minute Solar Energy
- SOLV Energy LLC
- Mortenson Construction
- Rosendin Electric Inc.
- Renewable Energy Systems Americas
- Brookfield Renewable US
- EDF Renewables North America
- Enphase Energy Inc.
- Trina Solar Ltd.
- LONGi Solar
- REC Group(REC Solar Norway AS)
- Array Technologies Inc.
- Nextracker Inc.
