
|
市場調査レポート
商品コード
1939028
タンタル:市場シェア分析、業界動向と統計、成長予測(2026年~2031年)Tantalum - Market Share Analysis, Industry Trends & Statistics, Growth Forecasts (2026 - 2031) |
||||||
カスタマイズ可能
適宜更新あり
|
|||||||
| タンタル:市場シェア分析、業界動向と統計、成長予測(2026年~2031年) |
|
出版日: 2026年02月09日
発行: Mordor Intelligence
ページ情報: 英文 120 Pages
納期: 2~3営業日
|

概要
タンタル市場は、2025年の3キロトンから2026年には3.15キロトンへ成長し、2026年から2031年にかけてCAGR4.99%で推移し、2031年までに4.02キロトンに達すると予測されております。
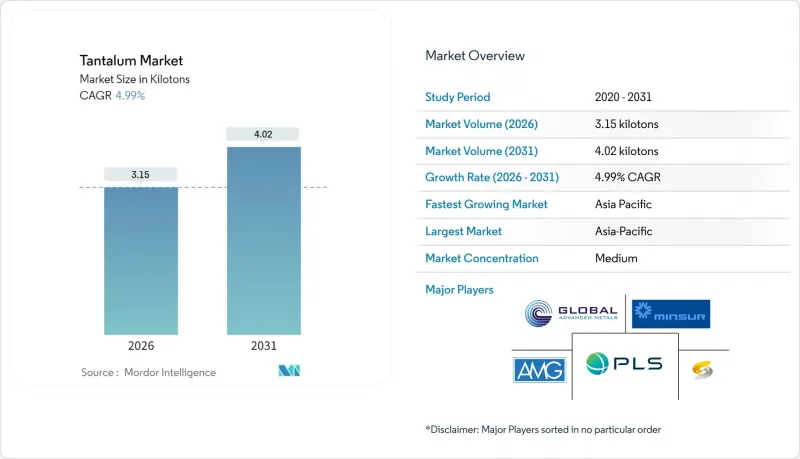
この成長軌道は、腐食抵抗性、生体適合性、高い絶縁耐性という比類のない特性の組み合わせを反映しており、コンデンサ、スパッタリングターゲット、超合金、埋め込み型医療機器などにおける需要の堅調さを支えています。堅調な電子機器の小型化、加速する5G展開、安定した航空宇宙エンジンの生産ペースが、主要な需要の触媒として引き続き作用しています。一方、オーストラリアおよびジンバブエのリチウムペグマタイト鉱山からの共同生産により、紛争鉱物コンプライアンスやスポット価格の変動性に関する懸念が依然として存在する中でも、構造的な供給リスクは緩和されつつあります。航空宇宙および医療技術分野のOEMメーカーは、価格よりも供給の安定性を優先し続けており、市場の不透明な取引環境にもかかわらず、調達を安定させる長期契約を支えています。
世界のタンタル市場動向と洞察
5G対応デバイスにおける小型タンタルコンデンサの需要急増
5Gインフラの高度化と携帯電話のアップグレードにより、高周波スイッチング下でも静電容量安定性を維持できる固体タンタルチップコンデンサの調達が加速しています。部品メーカーによれば、タンタルコンデンサは積層セラミックタイプに比べ優れた体積効率と低い等価直列抵抗(ESR)を提供し、フラッグシップスマートフォンやスモールセル基地局のスペース制約のある電源管理回路において重要な特性となっています。-55℃から+175℃の温度変動範囲における信頼性により、通信機器メーカーは現場での故障回避を重視し、タンタルデバイスを優先的に選択しています。パッケージングのロードマップでは現在、0201サイズという最小ケースサイズを目標としており、このサイズでは粉末加工された陽極が機械的強度を損なうことなく高い容量電圧比(CV)を実現します。デバイス小型化により単位グラム当たりの使用量が増加する一方で、材料軽量化の動向が広まる中、タンタル市場は直接的な恩恵を受けております。
先進半導体ノードにおけるタンタルスパッタリングターゲットの需要
7nm以下の論理回路およびDRAM製造フローシートでは、銅の拡散を防止しつつ低ライン抵抗を維持するタンタルおよび窒化タンタル拡散バリア層が指定されています。極端紫外線リソグラフィーでは純度基準が99.999%以上に引き上げられ、超高度真空冶金技術を有する精製業者にサプライヤー基盤が限定されています。2025年にアジアの主要ファウンドリが締結した長期供給契約は、この前駆体がウェーハ歩留まり維持においていかに戦略的になったかを示しています。したがって、韓国、台湾、中国本土における設備更新は、高純度粉末メーカーにとって安定した需要量につながっています。中央アフリカからの濃縮物供給が地政学的混乱の影響を受けるたびに供給逼迫の可能性が残っており、タンタル市場が価格安定性をプレミアムで評価する傾向を強めています。
紛争鉱物コンプライアンスコストと供給混乱
米国およびEU規制に基づく厳格なデューデリジェンス義務により、下流メーカーはコンセンレートを紛争フリー製錬所まで遡及追跡する必要があり、監査・認証費用が追加されることで完成部品コストが最大4分の1上昇します。中央アフリカからの小規模生産は依然として世界供給の相当な割合を占めており、定期的な国境閉鎖や治安事件により、ほとんど予告なく流通が中断される可能性があります。その結果、コンデンサや超合金の供給業者はより大きな安全在庫を保持し、スポット価格が下落した場合でも数量を確保できる複数年のテイク・オア・ペイ契約を好みます。
セグメント分析
2025年、タンタル市場シェアの36.10%を粉末が占めました。これはコンデンサ用陽極材およびスパッタリングターゲットの消費急増に牽引されたものです。このサブセグメントは、微細化が進むことでより厳密な粒子径分布と高い比容量への需要が高まることから、2031年までCAGR5.43%で推移すると予測されています。金属ビレット、線材、シートは粉末に次ぐ規模ながら、化学処理装置や航空宇宙用高温部部品など、鍛造形状が必須の分野で依然として不可欠です。超硬合金グレードは2,000HVを超える硬度を重視する切削工具・耐摩耗鋼板メーカーに、合金添加品はジェットエンジン用超合金を支えています。
積層造形技術への移行は新たな成長経路を開拓しています。レーザー粉末床溶融法向けに最適化された球状粉末は、医療用インプラントにおける複雑な格子構造の実現を可能にします。主要粉末サプライヤーは、骨格固定用ケージや頭蓋顔面メッシュの最適仕様である酸素含有量200ppm以下、D50値3µm前後の粉末を供給するため、噴霧ラインを拡張しています。形状精度管理の厳格化により、予測期間中も粉末はタンタル市場の中心的な存在であり続けるでしょう。
タンタル市場レポートは、製品別(金属、炭化物、粉末、合金、その他形態)、純度別(純度99.95%未満および99.95%以上)、用途(コンデンサ、半導体、エンジンタービンブレード、化学処理装置など)、地域(アジア太平洋、北米、欧州、南米、中東・アフリカ)別に分析しております。市場予測は数量(トン)単位で提示されます。
地域別分析
2025年時点でアジア太平洋地域は世界消費量の46.50%を占め、同地域は2031年までCAGR5.93%で推移すると予測されています。中国、日本、韓国にはコンデンサ組立ライン、メモリチップ工場、ディスプレイパネル工場が集中しており、これらが粉末およびスパッタリングターゲットを吸収しています。台湾におけるロジックファウンドリの拡大は超高純度需要を増加させており、一方、韓国のメモリメーカーは国内研究プログラムを活用し、DDR6モジュール向けタンタル系MIM(金属ー絶縁体ー金属)コンデンサの試験導入を進めています。オーストラリアが製品別供給源として台頭したことで、地域的な供給安全保障が強化され、アフリカ産濃縮鉱石への過度な依存が軽減されるとともに、バリューチェーンの回復力が向上しています。
北米は航空宇宙、防衛、医療機器分野を中核とする戦略的最終消費地域であり続けております。一次鉱山生産はカナダのタンコ鉱山に限定されておりますが、堅調な二次回収ネットワークが超合金スクラップや電子廃棄物を処理し、粉末及び合金回路へ供給しております。米国における紛争鉱物フリー調達を優先する政策は価格プレミアムを維持しつつ、ジェットエンジンOEMメーカーや心臓リズム管理機器メーカーへの供給量を確保しております。
欧州では、高い技術基準と厳格な環境規制を特徴とする、成熟しつつも安定した需要曲線が見られます。ドイツの一次自動車部品サプライヤーは先進運転支援モジュール向けコンデンサの需要を牽引し、フランスの原子力機器メーカーは放射性廃棄物システム向けにタンタルライニングを指定しています。欧州連合の紛争鉱物指令によりコンプライアンス予算は厳格化されましたが、循環型経済枠組みに組み込まれたリサイクル義務が、新規原料需要を徐々に相殺しています。東欧のコンデンサ工場はコスト競争力のある組立を提供しつつ、地域全体のトレーサビリティ要件を遵守しています。
その他の特典:
- エクセル形式の市場予測(ME)シート
- アナリストによる3ヶ月間のサポート
よくあるご質問
目次
第1章 イントロダクション
- 調査の前提条件と市場の定義
- 調査範囲
第2章 調査手法
第3章 エグゼクティブサマリー
第4章 市場情勢
- 市場概要
- 市場促進要因
- 5G対応デバイスにおける小型化タンタルコンデンサの需要急増
- 先進半導体ノードにおけるタンタルスパッタリングターゲットの需要
- 超合金ジェットエンジン部品の生産増加
- リチウム硬岩鉱山との共同生産による供給安定性の強化
- 医療用タンタルコーティング(神経インプラント向け)
- 市場抑制要因
- 紛争鉱物コンプライアンスコストと供給混乱
- 不透明な取引市場における高騰するスポット価格の変動性
- ADASシステムにおけるタンタルコンデンサのニオブコンデンサへの置換
- バリューチェーン分析
- 規制政策分析
- 技術動向
- ポーターのファイブフォース
- 供給企業の交渉力
- 買い手の交渉力
- 新規参入業者の脅威
- 代替品の脅威
- 競争企業間の敵対関係
- 価格指数
- 輸出入動向
第5章 市場規模と成長予測
- 製品別
- 金属
- カーバイド
- 粉末
- 合金
- その他の形態
- 純度別
- 純度99.95%未満
- 純度99.95%以上
- 用途別
- コンデンサ
- 半導体
- エンジンタービンブレード
- 化学処理装置
- 医療機器
- その他の用途
- 地域別
- 生産分析
- 米国
- オーストラリア
- ブラジル
- 中国
- コンゴ
- エチオピア
- ナイジェリア
- ルワンダ
- その他の国々
- 消費分析
- アジア太平洋地域
- 中国
- インド
- 日本
- 韓国
- その他アジア太平洋地域
- 北米
- 米国
- カナダ
- メキシコ
- 欧州
- ドイツ
- 英国
- イタリア
- フランス
- その他欧州地域
- 南米
- ブラジル
- アルゼンチン
- その他南米
- 中東・アフリカ
- サウジアラビア
- 南アフリカ
- その他の中東・アフリカ
- アジア太平洋地域
- 生産分析
第6章 競合情勢
- 市場集中度
- 戦略的動向
- 市場シェア(%)/順位分析
- 企業プロファイル
- AMG
- Advanced MaterialsTM, LLC
- CNMC Ningxia Orient Group Co., Ltd
- Energy Transition Minerals Ltd
- F&X Electro-Materials Limited
- Global Advanced Metals Pty Ltd
- Inframat
- Jiujiang Nonferrous Metals Smelting Co., Ltd
- JX Advanced Metals Corporation
- Lorad Chemical Corporation
- Materion Corporation
- Minsur
- Mitsui Mining & Smelting Co., Ltd.
- MPIL
- Pilbara Minerals Limited
- SAJAN OVERSEAS
- Star Earth Minerals Pvt Ltd.
- Taki Chemical Co., Ltd
- Tantalex Lithium Resources
- Ulba Metallurgical Plant
- Ximei Resources Holding Limited
