
ラテンアメリカの内陸水路輸送:市場シェア分析、産業動向と統計、成長予測(2025年~2030年)
Latin America Inland Waterway Transport - Market Share Analysis, Industry Trends & Statistics, Growth Forecasts (2025 - 2030)- 発行日
- ページ情報
- 英文 190 Pages
- 納期
- 2~3営業日
- 商品コード
- 1636260
- カスタマイズ可能 お客様のご希望に応じて、既存データの加工や未掲載情報(例:国別セグメント)の追加などの対応が可能です。詳細はお問い合わせください。
- 適宜更新あり 本レポートは最新情報反映のため適宜更新し、内容構成変更を行う場合があります。ご検討の際はお問い合わせください。
- 翻訳ツール提供対象 PDF対応AI翻訳ツールの無料貸し出しサービスのご利用が可能です
概要
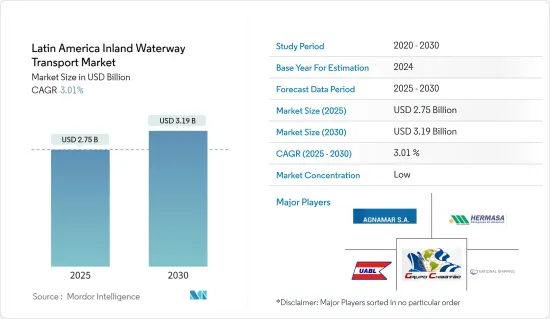
ラテンアメリカの内陸水路輸送市場規模は2025年に27億5,000万米ドルと推定され、予測期間(2025~2030年)のCAGRは3.01%で、2030年には31億9,000万米ドルに達すると予測されます。
主要ハイライト
- ラテンアメリカの内陸水運市場は多様性に富み、国ごとに独自の特徴と課題があります。費用対効果や経済的優位性といった要因が市場の成長を後押ししています。
- ラテンアメリカ河川網は広大で、世界最大級の河川流域で構成されています。しかし、このような自然的特徴にもかかわらず、内陸航路は十分に活用されておらず、この地域の商業物資輸送ではわずかな役割しか果たしていないです。
- ラテンアメリカは、航行可能な水路の広範なシステムをまだ十分に活用していないです。増え続ける貨物・旅客輸送需要に対応するため、内陸航路をこの地域の輸送網にもっと統合する機会は多いです。内陸水路を利用した貨物の国際輸送は過去10年間で増加しているが、この輸送手段が国際輸送に寄与しているのは、総貨物額と総貨物量の1%以下です。
- ラテンアメリカ諸国は、国内輸送と国際貿易の重要なリンクとして内陸水路を活用しています。例えば、パラグアイ・パラナ、アマゾナス、プラタ、オリノコ、マグダレナなどの河川流域で生産される大豆製品、アルミニウム、石油などの商品は、河川流域の港から直接出航する船を通じて、欧州、米国、アジアの世界市場へと運ばれます。
- 2023年7月から9月にかけて、ブラジルの内陸水路は歴史的な節目を迎え、水上貨物輸送量は3,379万トンに達しました。この数字は、ブラジル水運庁(ANTAQ)の水運統計から引用されたもので、ブラジルにとって重要な成果を強調するものです。
- 2023年第3四半期、内陸水路の処理量は、2022年に記録した前回と比較して6.1%増加しました。さらに、内陸貨物の動きの基準年である2019年と比較すると、数値は7.6%増加しました。
- この記録的な四半期を支えた主要要因は、大豆、コンテナ、鉄鉱石の輸送でした。特に、農産物だけで410万トンを占め、前年比79.3%増という驚異的な伸びを示しました。
- ブラジルでは、内水面航路のコンテナ輸送が急増し、260万トンを記録し、前年同期比13.23%増となりました。特に、鉄鉱石の出荷量は170万トンで、前年同期比45.4%の大幅増となりました。
ラテンアメリカの内陸水運市場の動向
コンテナ処理量の増加が市場を牽引
2023年、ラテンアメリカ港湾はその処理量において様々な実績を記録しました。このような変化は、主に港湾それぞれの国の経済・貿易活動に関連しています。しかし、運営上の特殊性、サプライチェーン管理、輸送会社の戦略、投資も、これらの結果を形成する上で極めて重要な役割を果たしました。2023年に傑出した実績を残したのは、9.8%増のペルーのカヤオ、7.9%増のブラジルのパラナグア、6.1%増のパナマのバルボア、コロンビアのカルタヘナです。
カラオのスループットは2023年に9.8%急増し、270万TEUを突破しました。特筆すべきは、南港と北港をそれぞれ管理するDPワールドとAPMターミナルが、設備とターミナルシステムに大規模な投資を行ったことです。これらの投資は、港湾の取扱能力を向上させただけでなく、運営効率も大幅に改善しました。
カラオ港の積み替え事業は2023年に好調な伸びを見せ、同港の箱物輸送量全体の25~30%を占めると推定されます。パラナグア・コンテナ・ターミナル(PCT)は、125万TEU以上を処理し、新記録を樹立しました。同ターミナルでは、生鮮品、特に冷凍チキンの輸出が顕著に急増し、この動向は今後も続くと予想されます。
China Merchants Port Holdings Companyが所有するTCPは、2023年に3億7,000万BRL(7,205万米ドル)を投資して、11台のRTGと10台のターミナル・トラクターを含む新しい設備を導入し、施設を強化しました。同港は、2024年に少なくともあと7台のターミナル・トラクターを導入する予定です。
太平洋岸では、パナマのバルボア港が、リストアップされた3港の中で唯一2023年にトラフィックが増加しました。これは、パナマで進行中の干ばつ危機とパナマ運河庁による喫水制限に迅速に対応したことが主要原因です。
バルボアは、特に2023年の最後の5ヶ月間、パナマ運河の制限の影響をほとんど受けずに、処理量が大幅に増加しました。アジア/米国東海岸航路の船舶からのコンテナは、大西洋側で受け取るために、パナマ運河鉄道やトラックに迅速に荷揚げされました。
ブラジル、世界貿易需要に対応するため港湾インフラを強化
ブラジルは8,500キロの海岸線を誇り、面積では世界第5位の国です。特筆すべきは、エクアドルとチリを除くすべての南米諸国と国境を接していることです。このユニークな地域性が、貿易量の90%以上を扱うブラジルの港湾の重要な役割を際立たせています。
ブラジルの港は、47の公営港と129の私営港を擁し、小規模な港やターミナルも多数あります。その筆頭がサンパウロにあるサントス港で、ブラジル最大の港として君臨し、ラテンアメリカ活気ある港湾シーンにおける重要な役割を担っています。
パラナグア港、リオデジャネイロ港、イタジャイ港は、ブラジルでサントス港に匹敵する重要な港湾です。これらの港湾は、連邦政府、州政府、市町村当局が関与する統治構造のもとで運営されており、連邦政府が率先して港湾運営を監督し、調和を図っています。
ブラジルは、急増する国際貿易需要に対応するため、港湾インフラへの投資を強化しています。その代表的な例がサントス港拡大プロジェクトで、これは港の収容能力を高め、施設を近代化し、より大型の船舶に対応できるようにするための戦略的な動きです。この拡大工事は、サントス港の国際競合を高める上で極めて重要なステップであり、処理能力の向上が期待されています。
もうひとつの重要な試みは、伊太祈曽港開発プログラムです。これは、オペレーションを合理化し、より大型の船舶のニーズに対応するためのインフラ整備に重点を置いています。バースを深くし、アクセスチャネルを強化することで、このプロジェクトは港の効率を高め、より多くの船舶輸送を呼び込み、ブラジルの重要な海事ハブとしての地位を確固たるものにしようとしています。
リオデジャネイロ港近代化計画やスアペ港複合施設拡大のような重要なイニシアチブは、港湾インフラを強化し、国際貿易のダイナミックな需要に対応させるというブラジルの献身を強調するものです。
ラテンアメリカの内陸水路輸送産業概要
ラテンアメリカの内陸水運市場は競争が激しいです。同市場の有力企業には、Agnamar SA、Hermasa Navegacao Da Amazonia Ltda、National Shipping SA、Chibatao Navega Cao E Comercio Ltda、UABL Paraguay SAなどがあります。
市場の大手企業は、広範なネットワーク、確立された顧客関係、効率的なオペレーションなど、強力な競争優位性を有しています。
その他の特典
- エクセル形式の市場予測(ME)シート
- 3ヶ月間のアナリストサポート
目次
第1章 イントロダクション
- 調査の前提条件
- 調査範囲
第2章 調査手法
- 分析方法
- 調査フェーズ
第3章 エグゼクティブサマリー
第4章 市場力学
- 現在の市場シナリオ
- 市場力学
- 促進要因
- 接続性と複合一貫輸送の強化
- 経済成長と貿易が市場を牽引
- 抑制要因
- 市場に影響を与える規制遵守
- 非効率な通関手続き
- 機会
- 市場を牽引する技術の進歩
- 市場を牽引する環境の持続可能性
- 促進要因
- バリューチェーン/サプライチェーン分析
- 産業の魅力-ポーターのファイブフォース分析
- 新規参入業者の脅威
- 買い手/消費者の交渉力
- 供給企業の交渉力
- 代替品の脅威
- 競争企業間の敵対関係の強さ
- 市場における技術の進歩
- 地政学とパンデミックが市場に与える影響
第5章 市場セグメンテーション
- 貨物タイプ別
- バルク
- 液体バルク輸送
- ドライバルク輸送
- コンテナ
- バルク
- 地域別
- メキシコ
- ブラジル
- チリ
- コロンビア
- その他のラテンアメリカ
第6章 競合情勢
- 企業プロファイル
- Agnamar SA
- Hermasa Navegacao Da Amazonia Ltda
- National Shipping SA
- Chibatao Navega Cao E Comercio Ltda
- UABL Paraguay SA
- Hamburg Sud
- CMA CGM
- Maersk Line
- MSC Mediterranean Shipping Company
- Grimaldi Group*
- その他の企業
第7章 市場の将来
第8章 付録
- GDP分布(活動別、地域別)
- 資本移動に関する洞察
- eコマースと越境eコマースに関する主要データ
- 製品カテゴリー別eコマース売上高
- 対外貿易統計輸出と輸入(製品別)
目次
The Latin America Inland Waterway Transport Market size is estimated at USD 2.75 billion in 2025, and is expected to reach USD 3.19 billion by 2030, at a CAGR of 3.01% during the forecast period (2025-2030).
Key Highlights
- Latin America's inland waterway transport market is diverse, with each country having its unique characteristics and challenges. Factors such as cost-effectiveness and economic advantage are bolstering market growth.
- The river network in Latin America is extensive and consists of some of the largest river basins in the world. However, despite these natural features, inland navigation is underutilized and plays a marginal role in the transport of commercial goods in the region.
- Latin America has not yet taken full advantage of its extensive system of navigable waterways. There are many opportunities to integrate inland navigation better into the region's transport network to cater to the ever-increasing demand for cargo and passenger transport. Although the international shipments of cargo utilizing inland waterways have increased over the previous decade, this transportation mode contributes to less than 1% of the total value and volume of goods that are shipped internationally.
- Latin American countries utilize their inland waterways for domestic transport and as a crucial link in international trade. For instance, commodities like soybean products, aluminum, and petroleum, sourced from river basins such as Paraguay-Parana, Amazonas, Plata, Orinoco, and Magdalena, find their way to global markets in Europe, the United States, and Asia through ships that set sail directly from ports situated along the river systems.
- Between July and September 2023, Brazil's inland waterways witnessed a historic milestone, with waterborne cargo transportation hitting 33.79 million tonnes. These figures, sourced from the Waterborne Statistics of Brazil's National Agency for Waterway Transportation (ANTAQ), underscored a significant achievement for the nation.
- In the third quarter of 2023, inland waterway throughput saw a notable 6.1% increase compared to the previous record set in 2022. Additionally, compared to 2019, a benchmark year for its inland cargo movements, the figures were 7.6% higher.
- Key drivers behind this record-breaking quarter were the transportation of soybeans, containers, and iron ore. Notably, agricultural commodities alone accounted for 4.1 million tonnes, marking a staggering 79.3% increase from the previous year.
- In Brazil, Inland waterways saw a surge in container transportation, hitting 2.6 million tonnes, marking a 13.23% rise from the previous year's third quarter. Notably, iron ore shipments alone totaled 1.7 million tonnes, showcasing a substantial 45.4% uptick from the same period in 2022.
Latin America Inland Waterway Transport Market Trends
Rise in container throughput driving the market
In 2023, Latin American ports recorded varied performance in their throughputs. These shifts were primarily tied to the economic and trade activities of the ports' respective countries. However, operational specifics, supply chain management, carrier strategies, and investments also played pivotal roles in shaping these outcomes. Standout performers in 2023 included Callao in Peru, with a 9.8% growth, Paranagua in Brazil, with a 7.9% increase, Balboa in Panama, with a 6.1% increase, and Cartagena in Colombia.
Callao's throughput surged by 9.8% in 2023, surpassing 2.7 million TEUs. Notably, both DP World and APM Terminal, managing South and North Ports, respectively, made significant investments in equipment and terminal systems. These investments not only boosted the port's handling capacity but also significantly improved its operational efficiency.
The transshipment business at Callao saw a robust uptick in 2023, accounting for an estimated 25-30% of the port's total box traffic. Paranagua Container Terminal (PCT) set a new record, processing over 1.25 million TEUs. The terminal witnessed a notable surge in the export of perishable goods, especially frozen chicken; this trend is expected to continue.
TCP, owned by China Merchants Port Holdings Company, invested BRL 370 million (USD 72.05 million) in 2023 in acquiring new equipment, including 11 RTGs and 10 terminal tractors, and enhancing its facility. The port is expected to introduce at least seven more terminal tractors in 2024.
On the Pacific coast, Balboa in Panama was the sole port among the three listed to witness a traffic increase in 2023. This was largely attributed to its swift adaptation to the country's ongoing drought crisis and the draught restrictions imposed by the Panama Canal Authority.
Balboa saw a significant rise in its throughput, especially in the last five months of 2023, largely unaffected by the Panama Canal restrictions. Containers from vessels on Asia/US East Coast routes were swiftly unloaded onto the Panama Canal Railway and trucks for pickup on the Atlantic side.
Brazil Bolstered Port Infrastructure to Meet Global Trade Demand
Brazil boasts an 8,500-kilometer coastline, making it the world's fifth-largest country by area. Notably, it shares borders with all South American nations except Ecuador and Chile. This unique geography underscores the pivotal role of Brazilian ports, which handle over 90% of the nation's trade volume.
Brazil boasts 47 public ports and 129 private ports, alongside a multitude of smaller ports and terminals. Leading the pack is the Port of Santos, situated in Sao Paulo, reigning as Brazil's largest and a key player in Latin America's bustling port scene.
The Port of Paranagua, the Port of Rio de Janeiro, and the Port of Itajai stand as significant counterparts to Santos in Brazil. These ports operate under a governance structure that involves federal, state, and municipal authorities, with the federal government taking the lead in overseeing and harmonizing their operations.
Brazil is ramping up its investments in port infrastructure to keep pace with the surging demands of international trade. A prime example is the Port of Santos Expansion Project, a strategic move to boost the port's capacity and modernize its facilities, making it capable of handling larger vessels. This expansion is a pivotal step in elevating the port's global competitiveness, and it is expected to increase the throughput.
Another significant endeavor is the Itajai Port Development Program, which focuses on revamping infrastructure to streamline operations and cater to the needs of larger vessels. By deepening berths and enhancing access channels, the project is set to boost the port's efficiency and draw in more shipping traffic, cementing its status as a vital maritime hub in Brazil.
Key initiatives like the Rio de Janeiro Port Modernization Program and the Suape Port Complex Expansion underscore Brazil's dedication to enhancing its port infrastructure, aligning it with the dynamic demands of international trade.
Latin America Inland Waterway Transport Industry Overview
Latin America's inland waterway transport market is highly competitive. Some of the prominent players in the market include Agnamar SA, Hermasa Navegacao Da Amazonia Ltda, National Shipping SA, Chibatao Navega Cao E Comercio Ltda, and UABL Paraguay SA.
The major players in the market have strong competitive advantages, such as extensive networks, established customer relationships, and efficient operations.
Additional Benefits:
- The market estimate (ME) sheet in Excel format
- 3 months of analyst support
TABLE OF CONTENTS
1 INTRODUCTION
- 1.1 Study Assumptions
- 1.2 Scope of the Study
2 RESEARCH METHODOLOGY
- 2.1 Analysis Method
- 2.2 Research Phases
3 EXECUTIVE SUMMARY
4 MARKET INSIGHTS DYNAMICS
- 4.1 Current Market Scenario
- 4.2 Market Dynamics
- 4.2.1 Drivers
- 4.2.1.1 Enhanced connectivity and intermodal integration
- 4.2.1.2 Economic growth and trade driving the market
- 4.2.2 Restraints
- 4.2.2.1 Regulatory compliances affecting the market
- 4.2.2.2 Inefficient custom procedures
- 4.2.3 Opportunities
- 4.2.3.1 Technological advancements driving the market
- 4.2.3.2 Environmental sustainability driving the market
- 4.2.1 Drivers
- 4.3 Value Chain/Supply Chain Analysis
- 4.4 Industry Attractiveness - Porters Five Forces Analysis
- 4.4.1 Threat of New Entrants
- 4.4.2 Bargaining Power of Buyers/Consumers
- 4.4.3 Bargaining Power of Suppliers
- 4.4.4 Threat of Substitute Products
- 4.4.5 Intensity of Competitive Rivalry
- 4.5 Technological Advancements in the Market
- 4.6 Impact of Geopolitics and Pandemics on the Market
5 MARKET SEGMENTATION
- 5.1 By Type of Carrgo
- 5.1.1 Bulk
- 5.1.1.1 Liquid Bulk Transportation
- 5.1.1.2 Dry Bulk Transportation
- 5.1.2 Container
- 5.1.1 Bulk
- 5.2 By Geography
- 5.2.1 Mexico
- 5.2.2 Brazil
- 5.2.3 Chile
- 5.2.4 Colombia
- 5.2.5 Rest of Latin America
6 COMPETITIVE LANDSCAPE
- 6.1 Overview
- 6.2 Company Profiles
- 6.2.1 Agnamar SA
- 6.2.2 Hermasa Navegacao Da Amazonia Ltda
- 6.2.3 National Shipping SA
- 6.2.4 Chibatao Navega Cao E Comercio Ltda
- 6.2.5 UABL Paraguay SA
- 6.2.6 Hamburg Sud
- 6.2.7 CMA CGM
- 6.2.8 Maersk Line
- 6.2.9 MSC Mediterranean Shipping Company
- 6.2.10 Grimaldi Group*
- 6.3 Other Companies
7 FUTURE OF THE MARKET
8 APPENDIX
- 8.1 GDP Distribution, by Activity and Region
- 8.2 Insights on Capital Flows
- 8.3 Key Data related to E-Commerce and Cross-Border E-Commerce
- 8.4 E-Commerce Sales by Product category
- 8.5 External Trade Statistics Export and Import, by Product
- 発行日
- 発行
- Mordor Intelligence
- ページ情報
- 英文 190 Pages
- 納期
- 2~3営業日


