
|
市場調査レポート
商品コード
1635379
世界の圧力リリーフバルブの市場シェア分析、産業動向と統計、成長予測(2025年~2030年)Global Pressure Relief Valves - Market Share Analysis, Industry Trends & Statistics, Growth Forecasts (2025 - 2030) |
||||||
カスタマイズ可能
適宜更新あり
|
|||||||
| 世界の圧力リリーフバルブの市場シェア分析、産業動向と統計、成長予測(2025年~2030年) |
|
出版日: 2025年01月05日
発行: Mordor Intelligence
ページ情報: 英文 120 Pages
納期: 2~3営業日
|

全表示
- 概要
- 目次
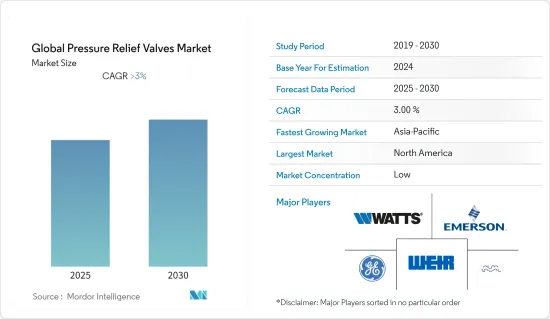
圧力リリーフバルブの世界市場は予測期間中に3%を超えるCAGRで推移すると予測されています。
COVID-19パンデミックは、圧力リリーフバルブ産業の様々な製品の生産を停止し、これは世界のロックダウンに起因しています。これは圧力リリーフバルブ市場の成長を妨げました。COVID-19は2021年第1四半期の圧力リリーフバルブの販売に影響を与え、2022年を通して市場の成長に打撃を与えると予測されています。パンデミックの初期段階では圧力リリーフバルブの売上が急落したもの、世界の製造部門の操業が基準値まで回復していることから、その後の数年間で市場は急回復すると予想されます。
しかし、石油・ガス産業は2021年を通じて力強く回復し、石油価格は過去6年間で最高水準に達しました。化石燃料によるエネルギーへの現在の依存度は、再生可能エネルギーへの自然な移行に対応するには重すぎるため、石油・ガス産業の将来は明るく、大きな利益をもたらします。発電世界中の電力網は、カーボンフリー発電を目標としています。石炭はガスに取って代わられつつあり、空気圧システムでガスの流れを調整するバルブが必要とされています。これらの産業の成長は圧力リリーフバルブ市場の成長を促進します。
米国は化学製品の生産で世界をリードする国であり、ドイツ、ロシア、中国がこれに続きます。米国はまた、石油化学製品の最大の生産国であり消費国でもあり、2021年の石油総生産量に占める割合は20%で、サウジアラビア(11%)、ロシア(11%)、カナダ(6%)がこれに続きます。中国は主要な電力生産国で、米国、インド、ロシアがこれに続きます。中国は2020年に7779.1テラワット時の電力を生産します。これらは圧力リリーフバルブのエンドユーザーである石油・ガス、電力、石油化学を生産する上位国であるため、バルブの主要市場であり、予測期間中に圧力リリーフバルブ市場は大きく成長するとみられます。
圧力リリーフバルブ市場の動向
石油・ガス需要の増加が市場成長を牽引
2021年の世界の原油生産量は1日当たり9,557万バレル、2022年には9,989万バレルに達すると推定されています。2020年、世界の原油需要は日量9,100万バレルに達しました。これは2012年以降で最低の需要量であったが、2021~2022年にかけてCOVID-19パンデミックによる封鎖が解除され始めたため、急速に増加しました。2021年、世界は原油・天然ガスで47億バレル相当の石油を発見しました。米国は1日当たり1,717万8,000バレルの石油を消費しています。このため、石油消費量に関しては米国がトップであり、次いで中国が1日あたり1,422万5,000バレル、インドが1日あたり466万9,000バレルを消費しています。
2021年、世界の石油消費量は1日9,739万バレルです。2022年、世界の消費量は日量9,961万バレル、2023年には日量1億155万バレルに達すると推定されています。製油所への原油、製油所から市場へのガソリン、灯油、ジェット燃料、暖房油などの精製製品は、石油パイプラインを通じて運ばれます。過度に高い圧力レベルは、パイプラインの破裂を引き起こしたり、最も弾力性のあるバルブでさえ誤作動を引き起こす可能性があります。このため、石油パイプラインには圧力リリーフバルブが設置されています。世界中で石油・ガスが増加していることから、圧力リリーフバルブ市場は確実に成長すると考えられます。
原子力発電へのニーズの高まりが市場成長の原動力となる見込み
World Nuclear Associationによると、世界の電力の約10%は約440基の原子炉で発電されています。さらに約55基の原子炉が建設中で、これは既存の発電能力の約15%に相当します。2020年の原子力発電所の電力供給量は2,553TWhで、2019年の2,657TWhから減少しました。2020年以前は、原子力による発電量は7年連続で増加していました。2020年には、13カ国が電力の4分の1以上を原子力発電で賄っていました。フランスは約4分の3を原子力発電でまかない、スロバキアとウクライナは半分以上を原子力発電でまかない、ハンガリー、ベルギー、スロベニア、ブルガリア、フィンランド、チェコは3分の1以上を原子力発電でまかなっています。韓国は通常、電力の30%以上を原子力発電から得ており、アメリカ、英国、スペイン、ルーマニア、ロシアは電力の約5分の1を原子力発電から得ています。
古い化石燃料発電設備、特に二酸化炭素を大量に排出する石炭火力発電設備を置き換えるため、また多くの国々で増加する電力需要を満たすために、世界中で新しい発電設備が必要とされています。世界原子力協会は、ハーモニー・プログラムと呼ばれる野心的なシナリオを提唱しており、2050年までに1,000GWeの新規原子力発電容量を追加し、1,250GWeの発電容量(退役を考慮した後)から当時の電力の25%(約1万TWh)を供給することを提案しています。
原子力発電のニーズの急増は、圧力リリーフバルブ産業参加者に新たなビジネス機会をもたらすと予想されます。圧力リリーフバルブはタービン、スーパーヒーター、ボイラーを保護し、発電所が所定の圧力で運転できるようにするために重要であるためです。
圧力リリーフバルブ産業概要
圧力リリーフバルブ市場はかなり細分化されています。市場の主要企業には、GE、Emerson Electric Co.、Watts、The Weir Group PLC、Alfa Lavalなどがあります。市場参入企業は市場シェアを獲得するために競争を行っています。主要企業は、プロセスのパフォーマンスと信頼性を向上させるためのバルブの幅広いポートフォリオを顧客に提供するために、合併や買収、技術革新のような多くの戦略を適用します。
その他の特典
- エクセル形式の市場予測(ME)シート
- 3ヶ月間のアナリストサポート
目次
第1章 イントロダクション
- 調査の成果
- 調査の前提
- 調査範囲
第2章 調査手法
- 分析手法
- 調査フェーズ
第3章 エグゼクティブサマリー
第4章 市場力学
- 市場概要
- 市場力学
- 促進要因
- 抑制要因
- バリューチェーン/サプライチェーン分析
- 産業の規制と施策
- このセグメントにおける技術開発
- 産業の魅力-ポーターのファイブフォース分析
- COVID-19の市場への影響
第5章 市場セグメンテーション
- 製品タイプ別
- パイロット式
- スプリング式
- 自重式
- その他
- 設定圧力別
- 高圧
- 中圧
- 低圧
- エンドユーザー別
- 石油・ガス
- 化学処理
- 発電
- 製紙・パルプ
- 飲食品
- 製薬
- その他
- 地域別
- 北米
- 米国
- カナダ
- メキシコ
- 欧州
- ドイツ
- 英国
- イタリア
- フランス
- その他の欧州
- アジア太平洋
- 中国
- インド
- 日本
- 韓国
- その他のアジア太平洋
- 中東・アフリカ
- アラブ首長国連邦
- サウジアラビア
- イラン
- その他の中東・アフリカ
- その他
- 北米
第6章 競合情勢
- 市場集中度概要
- 企業プロファイル
- General Electric
- Emerson Electric Co.
- Watts Water Technologies, Inc
- Weir Group Plc.
- Alfa Laval Corporate AB
- Curtis-Wright Corp
- AGF Manufacturing, Inc.
- Mercury Manufacturing Company
- IMI Plc
- Goetze KG Armaturen*
第7章 市場機会と今後の動向
第8章 免責事項
The Global Pressure Relief Valves Market is expected to register a CAGR of greater than 3% during the forecast period.
The COVID-19 pandemic halted the production of various products in the pressure relief valves industry, which is attributed to the global lockdown. This hampered the growth of the pressure relief valve market. COVID-19 affected the sales of pressure relief valves in the first quarter of 2021 and is anticipated to hurt the market growth throughout 2022. Though sales of pressure relief valves plummeted during the initial stages of the pandemic, with global manufacturing sector operations reviving toward threshold rates, the market is expected to recover sharply over subsequent years.
However, the oil and gas industry has rebounded strongly throughout 2021, with oil prices reaching their highest levels in six years. The future is bright and hugely profitable for the oil and gas industry because the current dependence on energy from fossil fuels is too heavy to accommodate the spontaneous migration to renewable energy. The Power Generation Electric grids worldwide have a goal of carbon-free power generation. Coal is being replaced by gas which requires valves to regulate the flow of gas in a pneumatic system. The growth in these industries will drive the growth of the pressure relief valves market.
The United States of America is the world's leading country in the production of chemical products followed by Germany, Russia, and China. The United States is also the largest producer and consumer of petrochemicals with a 20% share of total oil production in 2021, followed by Saudi Arabia (11%), Russia (11%), and Canada (6%). China is the leading power-producing country followed by the United States, India, and Russia. China produced 7779.1 terawatt hours of electricity in 2020. As these are the top countries producing oil & gas, power, and petrochemicals - the end-users for pressure relief valves - they are the major markets for the valves and will see significant growth in the pressure relief valves market during the forecast period.
Pressure Relief Valves Market Trends
Increasing Oil & Gas Demand Driving the Growth of the Market
Each day, the world produced 95.57 million barrels of oil in 2021, and in 2022, it's estimated that this will reach 99.89 million barrels per day. In 2020, the world's crude oil demand reached 91 million barrels per day. This was the lowest amount of demand since 2012, but it quickly increased as COVID-19 pandemic lockdowns began to lift during 2021 and into 2022. In 2021, the world discovered the equivalent of 4.7 billion barrels of oil in crude oil and natural gas. The U.S. consumes 17.178 million barrels of oil per day. This makes the U.S. the leading country as far as oil consumption goes, followed by China, which consumes 14.225 million barrels per day, and India, which consumes 4.669 million barrels per day.
In 2021, the world consumed 97.39 million barrels of oil a day. In 2022, it's estimated that the world will consume 99.61 million barrels per day, and by 2023, it's estimated that consumption will reach 101.55 million barrels per day. The crude oil to the refineries and refined products such as gasoline, kerosene, jet fuel, and heating oil from refineries to the market are carried through oil pipelines. Overly high-pressure levels could result in pipeline bursts or cause even the most resilient valves to malfunction. Due to this, pressure relief valves are installed in an oil pipeline. The growing oil & gas across the world will surely drive the pressure relief valves market.
Increasing Need for Nuclear Power Expected to Drive the Growth of the Market
According to World Nuclear Association, around 10% of the world's electricity is generated by about 440 nuclear power reactors. About 55 more reactors are under construction, equivalent to approximately 15% of the existing capacity. In 2020 nuclear plants supplied 2553 TWh of electricity, down from 2657 TWh in 2019. Prior to 2020, electricity generation from nuclear energy had increased for seven consecutive years. Thirteen countries in 2020 produced at least one-quarter of their electricity from nuclear. France gets around three-quarters of its electricity from nuclear energy, Slovakia and Ukraine get more than half from nuclear, whilst Hungary, Belgium, Slovenia, Bulgaria, Finland, and the Czech Republic get one-third or more. South Korea normally gets more than 30% of its electricity from nuclear, while in the USA, UK, Spain, Romania, and Russia about one-fifth of electricity is from nuclear.
There is a need for new generating capacity around the world, both to replace old fossil fuel units, especially coal-fired ones, which emit a lot of carbon dioxide, and to meet the increased demand for electricity in many countries. The World Nuclear Association has put forward an ambitious scenario called the Harmony programme which proposes the addition of 1000 GWe of new nuclear capacity by 2050, to provide 25% of electricity then (about 10,000 TWh) from 1250 GWe of capacity (after allowing for retirements).
Surge in need for nuclear power generation is expected to open up new opportunities for pressure relief valves industry participants. As pressure relief valves are critical for safeguarding turbines, super heaters, and boilers and allowing station to operate at a predetermined pressure.
Pressure Relief Valves Industry Overview
The pressure relief valve market is fairly fragmented. Some of the key players in the market are General Electric, Emerson Electric Co., Watts, The Weir Group PLC, and Alfa Laval. The market players undergo competition to capture the market share. Major companies apply many strategies like mergers and acquisitions, and technological innovations to provide their customers with the broadest portfolio of valves to improve process performance and reliability.
Additional Benefits:
- The market estimate (ME) sheet in Excel format
- 3 months of analyst support
TABLE OF CONTENTS
1 INTRODUCTION
- 1.1 Study Deliverables
- 1.2 Study Assumptions
- 1.3 Scope of the Study
2 RESEARCH METHODOLOGY
- 2.1 Analysis Methodology
- 2.2 Research Phases
3 EXECUTIVE SUMMARY
4 MARKET DYNAMICS
- 4.1 Market Overview
- 4.2 Market Dynamics
- 4.2.1 Drivers
- 4.2.2 Restraints
- 4.3 Value Chain / Supply Chain Analysis
- 4.4 Industry Policies and Regulations
- 4.5 Technological Developments in the Sector
- 4.6 Industry Attractiveness - Porter's Five Forces Analysis
- 4.7 Impact of COVID-19 on the Market
5 MARKET SEGMENTATION
- 5.1 By Product Type
- 5.1.1 Pilot Operated
- 5.1.2 Spring Loaded
- 5.1.3 Dead Weight
- 5.1.4 Others
- 5.2 By Set Pressure
- 5.2.1 High Pressure
- 5.2.2 Medium Pressure
- 5.2.3 Low Pressure
- 5.3 By End User
- 5.3.1 Oil & Gas
- 5.3.2 Chemical Processing
- 5.3.3 Power Generation
- 5.3.4 Paper & Pulp
- 5.3.5 Food & Beverages
- 5.3.6 Pharmaceuticals
- 5.3.7 Others
- 5.4 By Geography
- 5.4.1 North America
- 5.4.1.1 United States
- 5.4.1.2 Canada
- 5.4.1.3 Mexico
- 5.4.2 Europe
- 5.4.2.1 Germany
- 5.4.2.2 United Kingdom
- 5.4.2.3 Italy
- 5.4.2.4 France
- 5.4.2.5 Rest of Europe
- 5.4.3 Asia-Pacific
- 5.4.3.1 China
- 5.4.3.2 India
- 5.4.3.3 Japan
- 5.4.3.4 South-Korea
- 5.4.3.5 Rest of Asia-Pacific
- 5.4.4 Middle East and Africa
- 5.4.4.1 UAE
- 5.4.4.2 Saudi Arabia
- 5.4.4.3 Iran
- 5.4.4.4 Rest of the Middle East and Africa
- 5.4.5 Rest of the World
- 5.4.1 North America
6 COMPETITIVE LANDSCAPE
- 6.1 Market Concentration Overview
- 6.2 Company Profiles
- 6.2.1 General Electric
- 6.2.2 Emerson Electric Co.
- 6.2.3 Watts Water Technologies, Inc
- 6.2.4 Weir Group Plc.
- 6.2.5 Alfa Laval Corporate AB
- 6.2.6 Curtis-Wright Corp
- 6.2.7 AGF Manufacturing, Inc.
- 6.2.8 Mercury Manufacturing Company
- 6.2.9 IMI Plc
- 6.2.10 Goetze KG Armaturen*
