
陸上石油・ガスパイプライン:市場シェア分析、産業動向、成長予測(2024年~2029年)
Onshore Oil And Gas Pipeline - Market Share Analysis, Industry Trends & Statistics, Growth Forecasts (2024 - 2029)- 発行日
- ページ情報
- 英文 125 Pages
- 納期
- 2~3営業日
- 商品コード
- 1536906
- カスタマイズ可能 お客様のご希望に応じて、既存データの加工や未掲載情報(例:国別セグメント)の追加などの対応が可能です。詳細はお問い合わせください。
- 適宜更新あり 本レポートは最新情報反映のため適宜更新し、内容構成変更を行う場合があります。ご検討の際はお問い合わせください。
- 翻訳ツール提供対象 PDF対応AI翻訳ツールの無料貸し出しサービスのご利用が可能です
概要
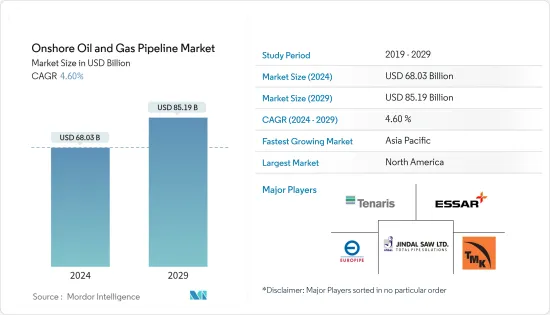
陸上石油・ガスパイプライン市場規模は2024年に680億3,000万米ドルと推定され、2029年には851億9,000万米ドルに達し、予測期間中(2024-2029年)にCAGR 4.60%で成長すると予測されます。
主なハイライト
- 豊富な天然ガス埋蔵量や、他の化石燃料に比べて安価であることなどが、発電を含む複数のエンドユーザーからの天然ガス需要を補うと予想されます。このことは、予測期間中にガスパイプライン分野を押し上げると予想されます。
- しかし、発電のための再生可能エネルギー源への世界のシフトは、石油・ガス需要に大きな脅威を与えており、これは予測期間中の陸上石油・ガスパイプライン設備の成長にとって大きな課題となりそうです。
- とはいえ、陸上探査・生産プロジェクトの増加は、パイプライン産業がより成長するための道を開いているため、今後数年間は市場関係者に絶好の機会をもたらすと予想されます。
- 予測期間中、アジア太平洋は大きな成長を遂げることが予想され、需要の大部分は中国、インドなどの国々からもたらされます。
陸上石油・ガスパイプライン市場動向
市場を独占する天然ガスパイプラインタイプ
*陸上パイプラインは、国の内陸部や地域に敷設されます。陸上パイプラインには、本管、横断管、フィーダー管、送電管、支線、地上管、地下管など、さまざまなタイプがあります。
*既存の陸上パイプライン・プロジェクトの拡張は、需要の増加に対応するために各国で行われています。米国エネルギー情報局(EIA)によると、米国では2023年に約52億立方フィート/日(Bcf/d)の天然ガス州内パイプライン容量が追加されました。このパイプライン増設のほとんどは、米国メキシコ湾岸市場の天然ガス需要を満たすためにテキサス州とルイジアナ州で行われました。
*さらに、ガス配給システムの主な走行距離は近年伸びています。米国運輸省によると、2023年の配給幹線走行距離は1,367,244マイルで、前年比1%増となっています。最終消費者のガス利用が増加していることを考慮すると、ガス配給システムの主走行距離の漸進的な成長はすぐに続くと思われます。
*同様に、2030年までに、中東・アフリカ、アジア太平洋などの地域における環境上の利点やエネルギー安全保障の追求などの要因のために、天然ガスの需要は、すべての燃料タイプの中で大きな成長で成長すると予想されています。
*イランは2024年7月、ブシェール、ファールス、ヤズド、イスファハンといった州の天然ガス需要を満たすため、全長1200kmのパイプライン「イラン・ガス・トランクライン-IGAT XI」の開発を開始しました。イラン国営ガス公社が所有するこのプロジェクトは、2027年までに完成する見込みです。このような発展は、石油・ガスパイプライン市場の予測期間中の成長を後押しすると思われます。
*シェールガス鉱床のような新たな天然ガス源の開発とそれに伴う価格圧力は、天然ガスの国際取引を増加させています。したがって、これらの開発により、予測期間中にパイプライン・ネットワークの拡張需要が増加すると予想されます。
アジア太平洋地域が大きな需要になる見込み
*アジア太平洋地域のエネルギー消費量は、2050年までに最大48%増加すると予想されています。国際エネルギー機関(IEA)によると、中国は2025年まで世界のエネルギー増加の30%に寄与すると予想されています。原油・天然ガスの消費量は、主にインドや中国などの新興経済国の需要増加により、近年この地域で著しい伸びを示しています。
*2024年1月現在、オーストラリアの石油・ガスメジャーであるサントスは、バロッサ・ガス田とオーストラリア北部の都市ダーウィンの処理工場を結ぶ、約43億米ドルのガス・パイプライン・プロジェクトの建設を開始することを決定しています。このプロジェクトにより、オーストラリアにおける天然ガスの利用可能性は将来的に高まると思われます。
*インドもまた、需要の増加に対応するため、ガスパイプラインのインフラ整備を進めています。同国は、エネルギーバスケットに占める天然ガスの割合を15%まで高めることを目指しています。2030年までに、陸上ガスパイプライン、CGD、LNG再ガス化ターミナルを含むガスインフラの建設に660億米ドルの投資を見込んでいます。さらに、インド政府は2020年12月、主に陸上でのガス・パイプライン・インフラ構築のために600億米ドルを投資すると発表しました。これは、2024年までに全国232の地域で圧縮天然ガス・パイプライン・ネットワーク(CGD)を拡大することを対象としています。
*アジア太平洋における石油消費量は、近年増加傾向にあります。世界エネルギー統計によると、2022年の石油消費量は16億1,500万トンで、前年から0.5%増加しました。予測期間中、石油消費量はさらに増加すると思われます。
*したがって、アジア太平洋における原油・天然ガス需要の増加や新しいパイプライン・インフラなどの重要な要因が、世界の陸上石油・ガスパイプライン市場の成長を促進すると予想されます。
陸上石油・ガスパイプライン産業の概要
陸上石油・ガスパイプライン市場は断片化されています。この市場の主要企業には、Tenaris SA、Essar Group、Jindal SAW Ltd、Europipe GmbH、TMK Groupなどがある(順不同)。
その他の特典:
- エクセル形式の市場予測(ME)シート
- 3ヶ月間のアナリスト・サポート
目次
第1章 イントロダクション
- 調査範囲
- 市場の定義
- 調査の前提
第2章 調査手法
第3章 エグゼクティブサマリー
第4章 市場概要
- イントロダクション
- 2029年までの市場規模および需要予測
- 2029年までのパイプラインの歴史的設置容量と予測(キロメートル単位)
- 2029年までの地域間パイプライン輸入容量(BSCM)
- 地域間パイプラインの輸出容量(BSCM):2029年まで
- 2029年までのブレント原油とヘンリーハブ・スポット価格の見通し
- 2029年までの陸上CAPEX予測
- 最近の動向と展開
- 政府の規制と政策
- 市場力学
- 促進要因
- 豊富な天然ガス埋蔵量と、他の化石燃料に比べて低いコスト
- 世界の需要を満たすための増産投資の増加
- 抑制要因
- 世界の再生可能エネルギーへのシフト
- 促進要因
- サプライチェーン分析
- ポーターのファイブフォース分析
- 供給企業の交渉力
- 消費者の交渉力
- 新規参入業者の脅威
- 代替品の脅威
- 競争企業間の敵対関係
第5章 市場セグメンテーション
- タイプ
- 石油パイプライン
- ガスパイプライン
- 地域
- 北米
- 米国
- カナダ
- その他北米
- 欧州
- ノルウェー
- 英国
- フランス
- スペイン
- ノルディック
- ロシア
- その他欧州
- アジア太平洋
- 中国
- インド
- インドネシア
- マレーシア
- ベトナム
- タイ
- その他アジア太平洋
- 南米
- ブラジル
- アルゼンチン
- コロンビア
- その他の南アフリカ
- 中東・アフリカ
- アラブ首長国連邦
- サウジアラビア
- 南アフリカ
- エジプト
- ナイジェリア
- カタール
- その他中東・アフリカ
- 北米
第6章 競合情勢
- M&A、合弁事業、提携、協定
- 主要企業の戦略
- 企業プロファイル
- Essar Group
- Jindal SAW Ltd
- Tenaris SA
- Europipe GmbH
- CPW America Co.
- TMK Group
- Baoshan Iron & Steel Co. Ltd
- TC Energy Corporation
- WorleyParsons Limited
- Mastec Inc.
- 市場ランキング分析
第7章 市場機会と今後の動向
目次
The Onshore Oil And Gas Pipeline Market size is estimated at USD 68.03 billion in 2024, and is expected to reach USD 85.19 billion by 2029, growing at a CAGR of 4.60% during the forecast period (2024-2029).
Key Highlights
- Factors such as the availability of abundant natural gas reserves and the lower cost compared to other fossil fuel types are expected to supplement the demand for natural gas from multiple end-users, including power generation. This, in turn, is expected to boost the gas pipeline segment during the forecast period.
- However, the global shift toward renewable sources for electricity generation poses a huge threat to the oil and gas demand, which is likely to be a major challenge for the growth of onshore oil and gas pipeline installations during the forecast period.
- Nevertheless, the rise in onshore exploration and production projects is expected to create excellent opportunities for the market players in the years to come, as these projects are paving the way for the pipeline industry to grow more.
- Asia-Pacific is expected to witness significant growth during the forecast period, with the majority of the demand coming from countries like China, India, etc.
Onshore Oil & Gas Pipeline Market Trends
Natural Gas Pipeline Type to Dominate the Market
* Onshore pipelines are laid in the country's inland areas or a region. Onshore pipelines are of different types: mains, crossings, feeder lines, transmissions, spur lines, and above-ground and underground pipelines.
* The expansion of existing onshore pipeline projects is being done in countries to cater to growing demand. As per the US Energy Information Administration (EIA), about 5.2 billion cubic feet per day (Bcf/d) of natural gas intrastate pipeline capacity was added in the United States of America in 2023. Most of the intrastate pipeline additions were made in Texas and Louisiana to fulfill natural gas demand in the United States Gulf Coast Markets.
* Moreover, the main mileage of gas distribution systems has grown in recent years. As per the United States of Transportation, in 2023, the distribution main mileage stood at 1,367,244 miles, an increase of 1% from the previous year. Considering the increase in the utilization of gas from end-consumers, the gradual growth of main mileage for gas distribution systems is likely to persist soon.
* Likewise, By 2030, owing to factors such as environmental benefits and the quest for energy security in regions such as the Middle East, Africa, and Asia-Pacific, the demand for natural gas is expected to witness significant growth among all fuel types.
* In July 2024, Iran commenced the development of the Iranian Gas Trunk Line-IGAT XI pipeline of 1200 kilometers to fulfill the natural gas demand of its provinces, such as Bushehr, Fars, Yazd, and Isfahan. The project owned by National Iranian Gas Co. is likely to be completed by 2027. Such developments are likely to help the oil and gas pipeline market grow in the forecast period.
* The development of new natural gas sources, such as shale gas deposits, and the resulting price pressure are increasing the international trade of natural gas. Hence, these developments are expected to increase the demand for pipeline network expansion during the forecast period.
Asia-Pacific Expected to Witness Significant Demand
* The energy consumption in Asia-Pacific is expected to increase by up to 48% by 2050. According to the International Energy Agency (IEA), China is expected to contribute 30% of the world's energy increase until 2025. Crude oil and natural gas consumption has witnessed significant growth in the region in recent years, mainly due to increasing demand from emerging economies like India and China.
* As of January 2024, Santos - Australia's oil & gas major, decided to commence the construction of a gas pipeline project worth about USD 4.3 billion that would connect the Barossa gas field to a processing plant in the northern Australian city of Darwin. The project will likely increase natural gas availability in Australia in the future.
* India is also modifying its gas pipeline infrastructure to meet the growing demand. The nation aims to increase the natural gas share to 15% in the energy basket. It expects USD 66 billion investment in building the gas infrastructure, including onshore gas pipeline, CGD, and LNG regasification terminals by 2030. Moreover, in December 2020, the Indian government announced a USD 60 billion investment for creating gas pipeline infrastructure, primarily onshore, which covers expanding Compressed Natural Gas pipeline networks (CGD) in 232 geographical areas across the country by 2024.
* Oil consumption in the Asia-Pacific has witnessed an increasing trend in recent years. As per the Statistical Review of World Energy, oil consumption stood at 1615 million tonnes in 2022, an increase of 0.5 % from the previous year. It is likely to grow more in the forecast period.
* Therefore, significant factors like the increasing demand for crude oil and natural gas and new pipeline infrastructure in the Asia-Pacific are expected to drive growth in the global onshore oil and gas pipeline market.
Onshore Oil And Gas Pipeline Industry Overview
The onshore oil and gas pipeline market is fragmented. Some of the key players in this market include (in no particular order) Tenaris SA, Essar Group, Jindal SAW Ltd, Europipe GmbH, and TMK Group.
Additional Benefits:
- The market estimate (ME) sheet in Excel format
- 3 months of analyst support
TABLE OF CONTENTS
1 INTRODUCTION
- 1.1 Scope of the Study
- 1.2 Market Definition
- 1.3 Study Assumptions
2 RESEARCH METHODOLOGY
3 EXECUTIVE SUMMARY
4 MARKET OVERVIEW
- 4.1 Introduction
- 4.2 Market Size and Demand Forecast in USD billion, till 2029
- 4.3 Installed Pipeline Historic Capacity and Forecast in Kilometers, till 2029
- 4.4 Inter-Regional Pipeline Import Capacity in BSCM, till 2029
- 4.5 Inter-Regional Pipeline Export Capacity in BSCM, till 2029
- 4.6 Brent Crude Oil and Henry Hub Spot Prices Forecast, till 2029
- 4.7 Onshore CAPEX Forecast in USD billion, till 2029
- 4.8 Recent Trends and Developments
- 4.9 Government Policies and Regulations
- 4.10 Market Dynamics
- 4.10.1 Drivers
- 4.10.1.1 Availability of abundant natural gas reserves and the lower cost compared to other fossil fuel types
- 4.10.1.2 Growing investments to increase production to fulfill global demand
- 4.10.2 Restraints
- 4.10.2.1 The global shift toward renewable sources for electricity generation
- 4.10.1 Drivers
- 4.11 Supply Chain Analysis
- 4.12 Porter's Five Forces Analysis
- 4.12.1 Bargaining Power of Suppliers
- 4.12.2 Bargaining Power of Consumers
- 4.12.3 Threat of New Entrants
- 4.12.4 Threat of Substitutes Products and Services
- 4.12.5 Intensity of Competitive Rivalry
5 MARKET SEGMENTATION
- 5.1 Type
- 5.1.1 Oil Pipeline
- 5.1.2 Gas Pipeline
- 5.2 Geography
- 5.2.1 North America
- 5.2.1.1 United States
- 5.2.1.2 Canada
- 5.2.1.3 Rest of North America
- 5.2.2 Europe
- 5.2.2.1 Norway
- 5.2.2.2 United Kingdom
- 5.2.2.3 France
- 5.2.2.4 Spain
- 5.2.2.5 NORDIC
- 5.2.2.6 Russia
- 5.2.2.7 Rest of Europe
- 5.2.3 Asia Pacific
- 5.2.3.1 China
- 5.2.3.2 India
- 5.2.3.3 Indonesia
- 5.2.3.4 Malaysia
- 5.2.3.5 Vietnam
- 5.2.3.6 Thailand
- 5.2.3.7 Rest of Asia Pacific
- 5.2.4 South America
- 5.2.4.1 Brazil
- 5.2.4.2 Argentina
- 5.2.4.3 Colombia
- 5.2.4.4 Rest of South Africa
- 5.2.5 Middle East and Africa
- 5.2.5.1 United Arab Emirates
- 5.2.5.2 Saudi Arabia
- 5.2.5.3 South Africa
- 5.2.5.4 Egypt
- 5.2.5.5 Nigeria
- 5.2.5.6 Qatar
- 5.2.5.7 Rest of Middle East and Africa
- 5.2.1 North America
6 COMPETITIVE LANDSCAPE
- 6.1 Mergers and Acquisitions, Joint Ventures, Collaborations, and Agreements
- 6.2 Strategies Adopted by Leading Players
- 6.3 Company Profiles
- 6.3.1 Essar Group
- 6.3.2 Jindal SAW Ltd
- 6.3.3 Tenaris SA
- 6.3.4 Europipe GmbH
- 6.3.5 CPW America Co.
- 6.3.6 TMK Group
- 6.3.7 Baoshan Iron & Steel Co. Ltd
- 6.3.8 TC Energy Corporation
- 6.3.9 WorleyParsons Limited
- 6.3.10 Mastec Inc.
- 6.4 Market Ranking Analysis
7 MARKET OPPORTUNITIES AND FUTURE TRENDS
- 発行日
- 発行
- Mordor Intelligence
- ページ情報
- 英文 125 Pages
- 納期
- 2~3営業日