
|
市場調査レポート
商品コード
1445947
キャベツおよびその他のアブラナ: 市場シェア分析、業界動向と統計、成長予測(2024:2029)Cabbages and Other Brassicas - Market Share Analysis, Industry Trends & Statistics, Growth Forecasts (2024 - 2029) |
||||||
カスタマイズ可能
適宜更新あり
|
|||||||
| キャベツおよびその他のアブラナ: 市場シェア分析、業界動向と統計、成長予測(2024:2029) |
|
出版日: 2024年02月15日
発行: Mordor Intelligence
ページ情報: 英文 98 Pages
納期: 2~3営業日
|

全表示
- 概要
- 目次
概要
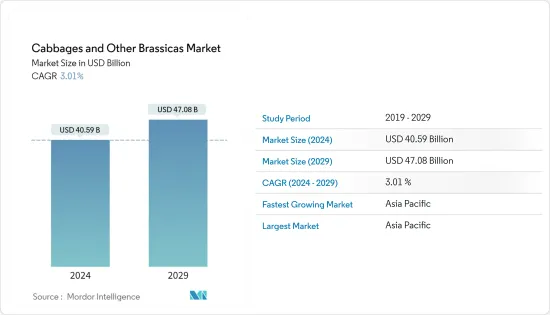
キャベツおよびその他のアブラナ科の市場規模は、2024年に405億9,000万米ドルと推定され、2029年までに470億8,000万米ドルに達すると予測されており、予測期間(2024年から2029年)中に3.01%のCAGRで成長します。
主なハイライト
- キャベツには、Brassica oleracea、緑、赤、サボイの3つの主要な種類があります。白菜やブロッコリーなど、他の多くの野菜と同じ植物科に属します。 2021年の生のキャベツの一人当たり年間消費量は、米国の一人当たり平均5.9ポンドでした。ブロッコリー、芽キャベツ、キャベツ、カリフラワーなどのコール作物は、気象条件がそれらの生育に適しているため、サウスカロライナ州で広く栽培されています。
- 現在、キャベツは、主にその繊維含有量、ミネラル(Ca、P、K)、ビタミン(C、K、A、葉酸)により、多くの国の文化において重要な位置を占めています。通常、生のままサラダにしたり、茹でたり、炒めたり、発酵させたりして消費されます。手頃な価格で地元の市場で入手できるため、人間の食生活に欠かせないものとなっています。キャベツや他のアブラナ科植物には、血糖値を調節し、人々の健康を改善する機能的な潜在力があります。
- 加工産業におけるキャベツやその他のアブラナ科の需要が増加しているため、市場は予測期間中に増加すると予想されます(白菜は通常の緑のキャベツよりもはるかに糸が通っているため、キムチや食品の製造における乳酸発酵プロセスにより適しています)加工産業のキャベツはピクルスの製造に使用され、それにより世界中で栽培面積が増加しています。たとえば、アブラナ属の面積は2018年の370万ヘクタールから2021年には380万ヘクタールに増加しました。
キャベツおよびその他のアブラナ科の市場動向
新しい灌漑技術の導入による生産性の向上
- キャベツは広く栽培されている野菜ですが、生産を成功させるには効率的な水管理が必要です。収穫前の最後の3~4週間に重要な灌漑期間があるため、キャベツはすぐに水分ストレスを受けやすいと分類されています。
- キャベツの生長には、結球の成長と成熟期には75~80%、さらには90%の最適な土壌水分と、85~90%の相対湿度が不可欠です。キャベツに必要な水分量は、気候や生育期の長さに応じて380 mmから500 mmまで変化します。世界中でキャベツ生産に最も広く採用されている灌漑技術には、溝灌漑、スプリンクラー灌漑、およびトリクル灌漑が含まれます。
- これらの灌漑技術の効率的な使用により、キャベツやその他のアブラナ科市場全体が推進されます。技術の進歩により、世界中でキャベツの生産量が増加し、2019年の7,060万トンから2021年には7,170万トンに増加しました。この増加は、精密な灌漑技術の向上と、植物の遺伝学と作物管理手法の改善によるものと考えられます。世界人口の増加に伴い、キャベツなどの健康的で栄養価の高い食品の需要が高まることが予想され、キャベツ産業への生産と投資の増加につながります。
- キャベツの生産を成功させるには効率的な水管理が不可欠であり、精密な灌漑技術の採用により世界中でキャベツの生産量が増加しています。健康的で栄養価の高い食品への需要が高まるにつれ、キャベツ市場は成長すると予想され、業界に投資とイノベーションの機会をもたらします。
アジア太平洋地域が世界のキャベツとその他のアブラナ科の生産をリード
- アジア太平洋ではキャベツやその他のアブラナ科植物の生産量が最も多く、中国が生産と輸出の主要国となっています。中国はキャベツおよびその他のアブラナ属の世界最大の輸出国であり、2021年には世界輸出の34%を占めています。輸出されるキャベツ総量のうち97%は欧州連合諸国、特にザワークラウト(発酵キャベツ)で有名なドイツ向けです。キャベツの取引が徐々に増加しており、キャベツ生産州すべてでキャベツ市場が拡大すると予想されています。
- 中国では、広東省と長江デルタ地帯がキャベツの主要生産地です。 2021年の中国からの「キャベツ、カリフラワー、コールラビ、ケール、および類似の食用アブラナ科植物、生鮮または冷蔵」の輸出先トップ5は、香港、ベトナム、マレーシア、タイ、ロシアであり、そのシェアは合計で35%(2億7,600万米ドル)、26%(2億800万米ドル)、20%(6,700万米ドル)、8.51%(2,300万米ドル)でした。
その他の特典
- エクセル形式の市場予測(ME)シート
- 3か月のアナリストサポート
目次
第1章 イントロダクション
- 調査の前提条件と市場の定義
- 調査範囲
第2章 調査手法
第3章 エグゼクティブサマリー
第4章 市場力学
- 市場概要
- 市場促進要因
- 市場抑制要因
- バリューチェーン/サプライチェーン分析
第5章 市場セグメンテーション
- 地域
- 北米
- 米国
- 生産分析
- 消費分析
- 輸入市場分析
- 輸出市場分析
- 価格動向分析
- カナダ
- 生産分析
- 消費分析
- 輸入市場分析
- 輸出市場分析
- 価格動向分析
- 欧州
- ウクライナ
- 生産分析
- 消費分析
- 輸入市場分析
- 輸出市場分析
- 価格動向分析
- ポーランド
- 生産分析
- 消費分析
- 輸入市場分析
- 輸出市場分析
- 価格動向分析
- ドイツ
- 生産分析
- 消費分析
- 輸入市場分析
- 輸出市場分析
- 価格動向分析
- 英国
- 生産分析
- 消費分析
- 輸入市場分析
- 輸出市場分析
- 価格動向分析
- フランス
- 生産分析
- 消費分析
- 輸入市場分析
- 輸出市場分析
- 価格動向分析
- アジア太平洋
- 中国
- 生産分析
- 消費分析
- 輸入市場分析
- 輸出市場分析
- 価格動向分析
- インド
- 生産分析
- 消費分析
- 輸入市場分析
- 輸出市場分析
- 価格動向分析
- 韓国
- 生産分析
- 消費分析
- 輸入市場分析
- 輸出市場分析
- 価格動向分析
- 日本
- 生産分析
- 消費分析
- 輸入市場分析
- 輸出市場分析
- 価格動向分析
- ウズベキスタン
- 生産分析
- 消費分析
- 輸入市場分析
- 輸出市場分析
- 価格動向分析
- インドネシア
- 生産分析
- 消費分析
- 輸入市場分析
- 輸出市場分析
- 価格動向分析
- 南米
- チリ
- 生産分析
- 消費分析
- 輸入市場分析
- 輸出市場分析
- 価格動向分析
- ペルー
- 生産分析
- 消費分析
- 輸入市場分析
- 輸出市場分析
- 価格動向分析
- アフリカ
- 南アフリカ
- 生産分析
- 消費分析
- 輸入市場分析
- 輸出市場分析
- 価格動向分析
- エジプト
- 生産分析
- 消費分析
- 輸入市場分析
- 輸出市場分析
- 価格動向分析
- 北米
第6章 市場機会と将来の動向
目次
Product Code: 61396
The Cabbages and Other Brassicas Market size is estimated at USD 40.59 billion in 2024, and is expected to reach USD 47.08 billion by 2029, growing at a CAGR of 3.01% during the forecast period (2024-2029).
Key Highlights
- There are three major types of cabbage, Brassica oleracea, green, red, and savoy. It belongs to the same plant family as many other vegetables, including Chinese cabbage and broccoli. The annual per capita consumption of fresh cabbage in 2021 averaged 5.9 pounds per person in the United States. Cole crops, such as broccoli, brussels sprouts, cabbage, and cauliflower, are extensively grown in South Carolina because weather conditions suit their growth.
- Currently, cabbage has a relevant position in the culture of many countries mainly due to its fiber content, minerals (Ca, P, and K), and vitamins (C, K, A, and folate). It is usually consumed fresh in salads, boiled, stir-fried, or fermented. It forms an essential part of the human diet because of its affordability and availability in local markets. Cabbage and other brassicas have the functional potential to regulate glucose levels and improve health in people.
- The market is expected to increase during the forecast period as the demand for cabbage and other brassica is increasing in the processing industry (Napa cabbage is much stringier than regular green cabbage and therefore is more suited to the lactic acid fermentation process in making kimchi and in the processing industries cabbages are used for making pickles) thereby increasing the cultivation area across the world. For instance, the area under brassicas increased from 3.7 million hectares in 2018 to 3.8 million hectares in 2021.
Cabbages & Other Brassicas Market Trends
Increasing Productivity Due to Adoption of New Irrigation Technologies
- Cabbage is a widely cultivated vegetable, but it requires efficient water management to ensure successful production. With a critical irrigation period during the last 3 to 4 weeks before harvest, cabbage has been classified as immediately susceptible to water stress.
- Optimum soil moisture of 75-80% and even 90% during the growth and maturation of the heads, as well as a relative air humidity of 85-90%, are crucial for the cabbage to thrive. Water requirements for cabbage vary from 380 mm to 500 mm depending on the climate and length of the growing season. The most widely adopted irrigation techniques for cabbage production worldwide include furrow, sprinkler, and trickle irrigation.
- The efficient use of these irrigation techniques drives the overall cabbages and other brassicas market. Technological advancements have led to the increased worldwide production of cabbages across the globe, which increased from 70.6 million metric tons in 2019 to 71.7 million metric tons in 2021. This growth is attributed to increased precision irrigation techniques and improved plant genetics and crop management practices. As the world population grows, the demand for healthy and nutritious food products such as cabbage is expected to rise, leading to increased production and investment in the cabbage industry.
- Efficient water management is crucial for successful cabbage production, and the adoption of precision irrigation techniques has led to increased cabbage production worldwide. As the demand for healthy and nutritious food products rises, the cabbage market is expected to grow, providing opportunities for investment and innovation in the industry.
Asia Pacific Leads the Global Cabbages and Other Brassicas Production
- Asia-Pacific has witnessed the highest production of cabbages and other brassicas, with China being the leading country in production and export. China is the largest exporter of cabbages and other brassicas globally, accounting for 34% of global exports in 2021. Of the total cabbage being exported, 97% is directed to the European Union countries, especially Germany, famous for Sauerkraut (fermented cabbage). With the gradual increase in the cabbage trade, the cabbage market is anticipated to increase in all the cabbage-producing provinces.
- In China, the state of Guangdong and the Yangtze River delta region are the key cabbage producers. The top five export destinations for "cabbages, cauliflowers, kohlrabi, kale, and similar edible brassicas, fresh or chilled" from China in 2021 are Hong Kong, Vietnam, Malaysia, Thailand, and Russia, with a combined share of 35% (USD 276 million), 26% (USD 208 million), and 20% (USD 67 million), and 8.51% (USD 23 million). In 2021, other brassicas production was dominated by Asia pacific region with 20.6 million metric tons, North America with 1.0 million metric tons, and Africa with 0.4 million metric tons.
Additional Benefits:
- The market estimate (ME) sheet in Excel format
- 3 months of analyst support
TABLE OF CONTENTS
1 INTRODUCTION
- 1.1 Study Assumptions and Market Definition
- 1.2 Scope of the Study
2 RESEARCH METHODOLOGY
3 EXECUTIVE SUMMARY
4 MARKET DYNAMICS
- 4.1 Market Overview
- 4.2 Market Drivers
- 4.3 Market Restraints
- 4.4 Value Chain/Supply Chain Analysis
5 MARKET SEGMENTATION
- 5.1 Geography
- 5.1.1 North America
- 5.1.1.1 United States
- 5.1.1.1.1 Production Analysis
- 5.1.1.1.2 Consumption Analysis
- 5.1.1.1.3 Import Market Analysis
- 5.1.1.1.4 Export Market Analysis
- 5.1.1.1.5 Price Trend Analysis
- 5.1.1.2 Canada
- 5.1.1.2.1 Production Analysis
- 5.1.1.2.2 Consumption Analysis
- 5.1.1.2.3 Import Market Analysis
- 5.1.1.2.4 Export Market Analysis
- 5.1.1.2.5 Price Trend Analysis
- 5.1.2 Europe
- 5.1.2.1 Ukraine
- 5.1.2.1.1 Production Analysis
- 5.1.2.1.2 Consumption Analysis
- 5.1.2.1.3 Import Market Analysis
- 5.1.2.1.4 Export Market Analysis
- 5.1.2.1.5 Price Trend Analysis
- 5.1.2.2 Poland
- 5.1.2.2.1 Production Analysis
- 5.1.2.2.2 Consumption Analysis
- 5.1.2.2.3 Import Market Analysis
- 5.1.2.2.4 Export Market Analysis
- 5.1.2.2.5 Price Trend Analysis
- 5.1.2.3 Germany
- 5.1.2.3.1 Production Analysis
- 5.1.2.3.2 Consumption Analysis
- 5.1.2.3.3 Import Market Analysis
- 5.1.2.3.4 Export Market Analysis
- 5.1.2.3.5 Price Trend Analysis
- 5.1.2.4 United Kingdom
- 5.1.2.4.1 Production Analysis
- 5.1.2.4.2 Consumption Analysis
- 5.1.2.4.3 Import Market Analysis
- 5.1.2.4.4 Export Market Analysis
- 5.1.2.4.5 Price Trend Analysis
- 5.1.2.5 France
- 5.1.2.5.1 Production Analysis
- 5.1.2.5.2 Consumption Analysis
- 5.1.2.5.3 Import Market Analysis
- 5.1.2.5.4 Export Market Analysis
- 5.1.2.5.5 Price Trend Analysis
- 5.1.3 Asia-Pacific
- 5.1.3.1 China
- 5.1.3.1.1 Production Analysis
- 5.1.3.1.2 Consumption Analysis
- 5.1.3.1.3 Import Market Analysis
- 5.1.3.1.4 Export Market Analysis
- 5.1.3.1.5 Price Trend Analysis
- 5.1.3.2 India
- 5.1.3.2.1 Production Analysis
- 5.1.3.2.2 Consumption Analysis
- 5.1.3.2.3 Import Market Analysis
- 5.1.3.2.4 Export Market Analysis
- 5.1.3.2.5 Price Trend Analysis
- 5.1.3.3 South Korea
- 5.1.3.3.1 Production Analysis
- 5.1.3.3.2 Consumption Analysis
- 5.1.3.3.3 Import Market Analysis
- 5.1.3.3.4 Export Market Analysis
- 5.1.3.3.5 Price Trend Analysis
- 5.1.3.4 Japan
- 5.1.3.4.1 Production Analysis
- 5.1.3.4.2 Consumption Analysis
- 5.1.3.4.3 Import Market Analysis
- 5.1.3.4.4 Export Market Analysis
- 5.1.3.4.5 Price Trend Analysis
- 5.1.3.5 Uzbekistan
- 5.1.3.5.1 Production Analysis
- 5.1.3.5.2 Consumption Analysis
- 5.1.3.5.3 Import Market Analysis
- 5.1.3.5.4 Export Market Analysis
- 5.1.3.5.5 Price Trend Analysis
- 5.1.3.6 Indonesia
- 5.1.3.6.1 Production Analysis
- 5.1.3.6.2 Consumption Analysis
- 5.1.3.6.3 Import Market Analysis
- 5.1.3.6.4 Export Market Analysis
- 5.1.3.6.5 Price Trend Analysis
- 5.1.4 South America
- 5.1.4.1 Chile
- 5.1.4.1.1 Production Analysis
- 5.1.4.1.2 Consumption Analysis
- 5.1.4.1.3 Import Market Analysis
- 5.1.4.1.4 Export Market Analysis
- 5.1.4.1.5 Price Trend Analysis
- 5.1.4.2 Peru
- 5.1.4.2.1 Production Analysis
- 5.1.4.2.2 Consumption Analysis
- 5.1.4.2.3 Import Market Analysis
- 5.1.4.2.4 Export Market Analysis
- 5.1.4.2.5 Price Trend Analysis
- 5.1.5 Africa
- 5.1.5.1 South Africa
- 5.1.5.1.1 Production Analysis
- 5.1.5.1.2 Consumption Analysis
- 5.1.5.1.3 Import Market Analysis
- 5.1.5.1.4 Export Market Analysis
- 5.1.5.1.5 Price Trend Analysis
- 5.1.5.2 Egypt
- 5.1.5.2.1 Production Analysis
- 5.1.5.2.2 Consumption Analysis
- 5.1.5.2.3 Import Market Analysis
- 5.1.5.2.4 Export Market Analysis
- 5.1.5.2.5 Price Trend Analysis
- 5.1.1 North America

