
再生可能エネルギー:市場シェア分析、業界動向と統計、成長予測(2026年~2031年)
Renewable Energy - Market Share Analysis, Industry Trends & Statistics, Growth Forecasts (2026 - 2031)- 発行日
- ページ情報
- 英文 125 Pages
- 納期
- 2~3営業日
- 商品コード
- 2035074
- カスタマイズ可能 お客様のご希望に応じて、既存データの加工や未掲載情報(例:国別セグメント)の追加などの対応が可能です。詳細はお問い合わせください。
- 適宜更新あり 本レポートは最新情報反映のため適宜更新し、内容構成変更を行う場合があります。ご検討の際はお問い合わせください。
- 翻訳ツール提供対象 PDF対応AI翻訳ツールの無料貸し出しサービスのご利用が可能です
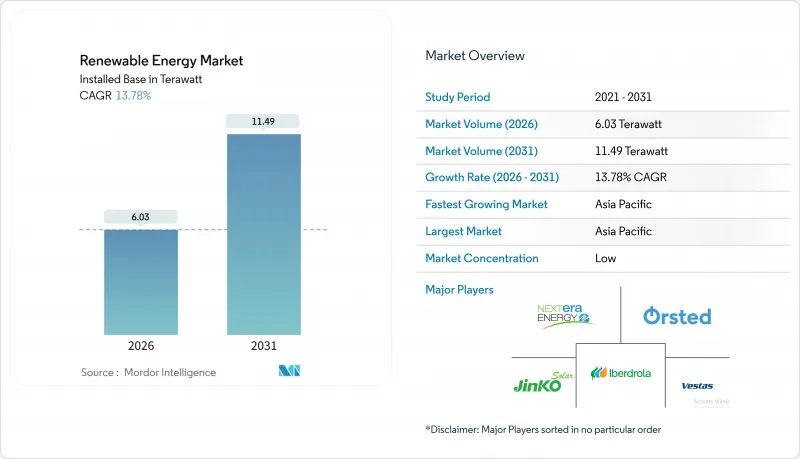
再生可能エネルギー市場の規模は、設置容量ベースで予測期間(2026年~2031年)においてCAGR13.78%で拡大し、2026年の6.03テラワットから2031年には11.49テラワットに達すると見込まれています。
この拡大は、プロジェクトを前倒しで推進する数ギガワット規模の企業間電力購入契約に加え、従来の送電網に依存しない需要を創出するグリーン水素事業によって支えられています。モジュールコストの低下、許認可手続きの迅速化、そして電解槽主導の電力引き取り需要が相まって、飽和状態にある市場においても、追加的な発電容量の経済的魅力が高まっています。独立系発電事業者(IPP)が低コストの資本とターンキーEPC(設計・調達・建設)サービスを組み合わせることで、競争環境は変化しており、垂直統合型電力会社の地位は着実に低下しています。一方、太陽光・風力・蓄電のハイブリッドシステムは、発電制限へのヘッジ手段として台頭しており、調整可能な再生可能電力を提供することで、長期間の蓄電技術の導入を加速させています。こうした状況下で、再生可能エネルギー市場では、従来型開発業者への利益率圧迫が高まる一方、下流事業を統合するOEM(オリジナル・エクイップメント・メーカー)にとっては機会が拡大するでしょう。
世界の再生可能エネルギー市場の動向と洞察
北米および欧州における企業向け電力購入契約(CPPA)が、ユーティリティ規模の建設を加速
企業向けPPAは、15~20年にわたるバランスシートヘッジとして成熟し、マーチャントリスクを投資適格級の信用力に置き換えることで、開発事業者が従来の電力会社による入札方式よりも迅速にファイナンシャル・クローズを達成することを可能にしています。2024年にMetaがRWEと締結した1.5GWのポートフォリオは、データセンターの電力購入者が複数国にわたるパイプラインを保証し、太陽光発電の建設サイクルを24ヶ月未満に、陸上風力発電を約30ヶ月に短縮している好例です。開発業者は投機的な資産よりも契約済みのプロジェクトを優先するため、再生可能エネルギー市場のペースは現在、規制当局ではなく大規模な買い手によって決定されています。科学に基づく目標を設定する企業が増えるにつれ、2030年まで年間40GWを超える新規設備容量の総需要が見込まれており、再生可能エネルギー市場の長期的な成長軌道を強化しています。その結果、将来の見通しが明確になることで、加重平均資本コストが低下し、再生可能エネルギーの普及率が高い電力網における導入の上限が引き上げられます。
北欧およびアイルランドにおけるハイパースケールデータセンターの需要が、太陽光・風力発電の調達を後押し
AIワークロードがクラウドキャンパスにおける電力需要の増加を牽引しており、これにより事業者は水力や風力が余剰となる地域で再生可能エネルギー発電を確保するよう迫られています。Googleによるノルウェーでの500MW規模の風力発電契約は、企業が北欧諸国のクリーンエネルギーミックスをいかに活用しているかを示しており、一方、ダブリン周辺の送電網の混雑により、投資はスウェーデンやフィンランドへとシフトしています。これに対し、再生可能エネルギー市場は、送電制約のある拠点への依存度を低減させるオンサイト太陽光発電および蓄電システムの開発を進めています。この動きにより、分散型資産へ資本が流入し、グリッド形成型インバーターやマイクログリッドアーキテクチャが促進されています。短期的な需要の弾力性は依然として高く、発電設備と蓄電池をセットで提供できる開発業者は、ハイパースケーラーから優先サプライヤーとしての地位を獲得しています。
ERCOT(米国)および内モンゴル(中国)における送電網の混雑と出力抑制リスク
ERCOTでは、2024年に西テキサスの発電量がヒューストンへの送電容量を上回ったため、3.2 TWhの再生可能エネルギー発電が抑制されました。現在、系統連系待ち期間は5年を超え、エネルの300 MW「アズール・スカイ」風力発電所などのプロジェクトは2026年まで延期されています。中国では、内モンゴルの出力抑制率が依然として4%前後で推移しており、東部の買い手に電力を販売する際には15~20%の価格割引が必要となっています。これらの要因により内部収益率が低下し、約10GWに上る風力・太陽光発電の新規導入が一時的に先送りされています。新たなHVDC送電線が最終的に制約を緩和する見込みですが、再生可能エネルギー市場のCAGRに対する短期的なマイナス影響は避けられません。
セグメント分析
海洋エネルギーは、2026年から2031年にかけてCAGR36.95%を記録し、再生可能エネルギー市場で最も急速に成長している分野となります。オービタル・マリン・パワー社がオークニー諸島に設置した2MWのO2潮力タービンは、稼働初年度に74%の設備利用率を達成しました。これは洋上風力の標準値を大幅に上回るものであり、潮力の予測可能性を如実に示しています。Minesto社の「Dragon 12」カイトは、低速の海流を有用な電力に変換し、水流の速い海峡以外にも資源基盤を拡大しています。太陽光発電は、2025年に再生可能エネルギー市場シェアの44.61%を占め、ポリシリコンの価格が1キログラムあたり8米ドルを下回ったことで、2024年に結晶シリコンパネルの価格が1ワットあたり0.12米ドルまで下落したことに支えられ、主導的な地位を維持しています。TOPConおよびヘテロ接合セルの効率が25%を超えたことで、システム全体のコストがさらに圧縮され、温帯地域においても競争力のある価格水準が維持されています。
風力発電は、EUにおける許認可手続きの効率化や中国での送電網の拡充を追い風として、2025年の発電容量の約35%を占める見込みです。しかし、洋上風力発電については、固定式プラットフォームが1MWあたり300万~400万米ドルであるのに対し、浮体式基礎の建設費が1MWあたり400万~500万米ドルと高騰しているという課題に直面しています。水力発電は、適地が減少する中、緩やかな拡大にとどまっていますが、中国の2.4GWの白鶴潭(バイヘタン)揚水発電所は、変動の激しい再生可能エネルギー網において、8時間の蓄電が持つ価値を実証しています。バイオエネルギーと地熱は、原料価格の変動や高エンタルピー貯留層の不足により、依然として8%未満のニッチな存在にとどまっていますが、アイスランドの90MWのテイスタレイキル拡張プロジェクトは、地熱のベースロード電源としての魅力を示しています。全体として、技術の多様化は再生可能エネルギー市場を単一セグメントのリスクから守りつつ、投資家に複数の参入機会を提供しています。
『再生可能エネルギー市場レポート』は、技術別(太陽光、風力、水力、バイオエネルギー、地熱、海洋エネルギー)、エンドユーザー別(公益事業、商業・産業、住宅)、地域別(北米、欧州、アジア太平洋、南米、中東・アフリカ)に分類されています。市場規模と予測は、設置容量(GW)で示されています。
地域別分析
アジア太平洋地域は2025年に57.23%のシェアを占めて首位となり、中国の2024年設置量216GWおよびインドの2030年目標500GWを牽引役として、CAGR16.19%で拡大すると予測されています。中国の国有開発業者はまた、モジュール、タービン、EPCサービスをパッケージ化した優遇融資を通じて、東南アジア、ラテンアメリカ、アフリカへ資本と設備を輸出しています。インドの洋上風力発電の入札や生産連動型インセンティブは、製造の現地化を目指しており、中国からの輸入への依存を抑制するものです。
北米では、「インフレ抑制法(Inflation Reduction Act)」の下で建設が加速しています。同法は税額控除を2032年まで延長するもので、すでに1,500億米ドル規模の国内製造への投資を喚起しています。米国は2024年に太陽光発電32GW、風力発電8GWを導入しましたが、ERCOT(テキサス州電力信頼性委員会)による出力抑制は、送電網の整備が遅れていることを示しています。カナダは水力発電と洋上風力発電を活用し、2030年までに電力の90%を再生可能エネルギーで賄うことを目標としています。一方、メキシコでは日射量は豊富であるにもかかわらず、規制の変更により民間投資が冷え込んでいます。欧州は「REPowerEU」を活用して許認可手続きの迅速化を図っており、スペインとギリシャが最も恩恵を受けています。一方、ドイツでは依然として24ヶ月を超える送電網接続の遅延に悩まされています。
中東とアフリカは水素輸出国として台頭しており、サウジアラビアのNEOM(4GWの電解装置)やエジプトの10GW規模のスエズ湾風力発電計画がその証拠となっています。南米の成長は、ブラジルの4GW規模の風力発電入札と、チリの25米ドル/MWhの太陽光発電回廊を中心に展開しています。アルゼンチンでは、リチウム鉱山に太陽光発電施設を併設し、加工工程の脱炭素化を図っています。こうした地域ごとの動向が相まって、再生可能エネルギー市場の規模を拡大し、サプライチェーンの多様化を促進しています。
その他の特典:
- エクセル形式の市場予測(ME)シート
- 3ヶ月間のアナリストサポート
よくあるご質問
目次
第1章 イントロダクション
- 調査の前提条件と市場の定義
- 調査範囲
第2章 調査手法
第3章 エグゼクティブサマリー
第4章 市場情勢
- 市場概要
- 再生可能エネルギー構成、2024年
- 市場促進要因
- 北米および欧州における企業向け電力購入契約(PPA)が、ユーティリティ規模の建設を加速させています
- 北欧およびアイルランドにおけるハイパースケールデータセンターの需要が、太陽光・風力発電の調達を後押ししています
- 中東・北アフリカ(MENA)およびオーストラリアにおける容量増強を牽引するグリーン水素のギガワット級パイプライン
- EUの「REPowerEU」による迅速な許認可手続きが、南欧における陸上風力発電のリードタイムを短縮(12ヶ月未満)
- 市場抑制要因
- ERCOT(米国)および内モンゴル(中国)における送電網の混雑および出力抑制リスク
- ドイツおよびフランスにおける使用済みブレード廃棄物規制がコストを押し上げている
- 東南アジアにおける長期間蓄電技術の不足が、変動性再生可能エネルギー(VRE)の高浸透率を阻害しています
- インドおよびブラジルにおける現地調達義務が洋上風力発電の設備投資を押し上げている
- サプライチェーン分析
- 規制の見通し
- テクノロジーの展望
- ポーターのファイブフォース
- 供給企業の交渉力
- 消費者の交渉力
- 新規参入業者の脅威
- 代替製品・サービスの脅威
- 競争企業間の敵対関係
第5章 市場規模と成長予測
- 技術別
- ソーラーエネルギー(PVおよびCSP)
- 風力エネルギー(陸上および洋上)
- 水力発電(小規模、大規模、PSH)
- バイオエネルギー
- 地熱
- 海洋エネルギー(潮・波)
- エンドユーザー別
- ユーティリティ
- 商業・産業
- 住宅
- 地域別
- 北米
- 米国
- カナダ
- メキシコ
- 欧州
- 英国
- ドイツ
- フランス
- スペイン
- 北欧諸国
- ロシア
- その他欧州地域
- アジア太平洋地域
- 中国
- インド
- 日本
- 韓国
- マレーシア
- タイ
- インドネシア
- ベトナム
- オーストラリア
- その他アジア太平洋地域
- 南米
- ブラジル
- アルゼンチン
- コロンビア
- その他南米
- 中東・アフリカ
- サウジアラビア
- アラブ首長国連邦
- 南アフリカ
- エジプト
- その他中東・アフリカ地域
- 北米
第6章 競合情勢
- 市場集中度
- 戦略的動き(M&A、合弁事業、資金調達、電力購入契約)
- 市場シェア分析(主要企業の市場順位・シェア)
- 企業プロファイル
- EPCディベロッパー/オペレーター/オーナー
- NextEra Energy, Inc.
- Orsted A/S
- Iberdrola, S.A.
- EDF Renewables(EDF S.A.)
- Duke Energy Corporation
- Berkshire Hathaway Energy
- Acciona Energia S.A.
- Engie S.A.
- China Three Gorges Corporation
- Enel Green Power S.p.A.
- Statkraft A.S.
- Pattern Energy Group
- Invenergy LLC
- RWE Renewables GmbH
- ACWA Power
- EDP Renovaveis S.A.
- Brookfield Renewable Partners L.P.
- ReNew Energy Global PLC
- Scatec ASA
- 機器サプライヤー
- First Solar, Inc.
- Vestas Wind Systems A/S
- Siemens Gamesa Renewable Energy S.A.
- GE Vernova(General Electric)
- JinkoSolar Holding Co. Ltd.
- Canadian Solar Inc.
- Longi Green Energy Technology Co., Ltd.
- Goldwind Science & Technology Co., Ltd.
- Trina Solar Co., Ltd.
- Enphase Energy, Inc.
- Sungrow Power Supply Co., Ltd.
- Mitsubishi Power, Ltd.
- Nordex SE
- MHI Vestas Offshore Wind A/S
- Shanghai Electric Group Co., Ltd.
- Hitachi Energy Ltd.
- ABB Ltd.
- Climeon AB
- Pelamis Wave Power Ltd.(in Administration)
- Ocean Power Technologies, Inc.
- EPCディベロッパー/オペレーター/オーナー
第7章 市場機会と将来の展望
- 発行日
- 発行
- Mordor Intelligence
- ページ情報
- 英文 125 Pages
- 納期
- 2~3営業日

