|
|
市場調査レポート
商品コード
1440113
バニラビーン:市場シェア分析、業界動向と統計、成長予測(2024-2029)Vanilla Bean - Market Share Analysis, Industry Trends & Statistics, Growth Forecasts (2024 - 2029) |
||||||
|
|||||||
カスタマイズ可能
適宜更新あり
|
|||||||

| バニラビーン:市場シェア分析、業界動向と統計、成長予測(2024-2029) |
|
出版日: 2024年02月15日
発行: Mordor Intelligence
ページ情報: 英文 120 Pages
納期: 2~3営業日
|

全表示
- 概要
- 目次
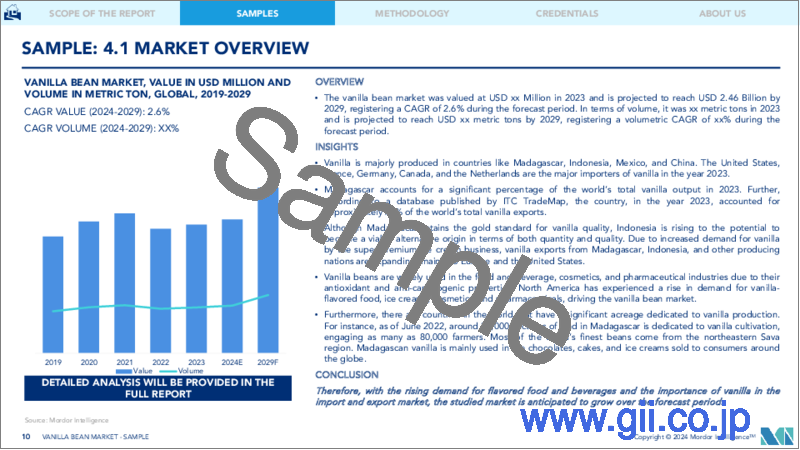
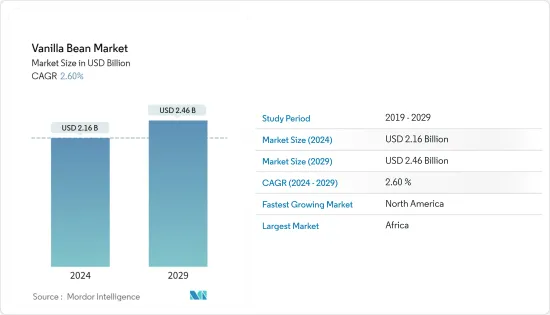
バニラビーン市場規模は2024年に21億6,000万米ドルと推定され、2029年までに24億6,000万米ドルに達すると予測されており、予測期間(2024年から2029年)中に2.60%のCAGRで成長します。
バニラは主にマダガスカル、インドネシア、メキシコ、中国などの国で生産されています。米国、フランス、ドイツがバニラの主要輸入国です。マダガスカルは世界のバニラ生産量の半分以上を占め、2021年の世界輸出額の半分以上に貢献しました。マダガスカルはバニラの品質のゴールドスタンダードを維持しているが、インドネシアは量の両方の点で実行可能な代替原産地となる可能性が高まっているそして品質。スーパープレミアムアイスクリーム事業によるバニラ需要の増加により、マダガスカルやインドネシアなどの生産国から米国を中心にバニラの輸出が拡大しています。
バニラビーンは、その抗酸化作用と抗発がん性の特性により、食品および飲料、化粧品、製薬業界で広く使用されています。北米ではバニラ風味の食品、アイスクリーム、化粧品、医薬品の需要が高まり、バニラビーン市場を牽引しています。人口の増加とフレーバー付き飲食品の需要が増加し、最終的に市場の成長を推進しています。
バニラビーン市場動向
食品および製薬業界での応用が市場を牽引
生産されたバニラの大部分はバニラビーンの商品(後発品)として取引されています。バニラ製品の購入者は、独自の購入習慣を持つ家庭用消費者と産業用消費者に分かれています。家庭ユーザーは、バニラビーン、エキス、パスタなどのバニラ完成品を小売店で購入することがよくあります。対照的に、企業は通常、原材料としてバニラをバニラビーンの形で大量に購入します。したがって、産業顧客はバニラビーンを商品として購入する傾向が高くなりますが、国内消費者は最終製品(認証またはブランド付き)を購入する傾向が高くなります。
バニラは、ゼリー、ジャム、シロップの風味成分として食品および飲料業界で広く使用されています。バニラの抗酸化物質と抗菌特性により、皮膚の洗浄や損傷した皮膚関連の問題の治療に適しています。不安障害やうつ病を軽減することも知られています。バニラの摂取に伴うこれらの利点により、消費者の需要が高まると予想されます。
バニラには抗酸化特性と抗発がん性特性があるため、製薬業界で広く使用されています。バニラのさやの風味豊かな成分であるバニリンは、食品や飲料、医薬品、化粧品にフラボノイドとして使用されています。バニラには、抗酸化作用と抗発がん性があるため、製薬業界での需要が高まっています。その結果、バニラビーン市場は予測期間中に成長すると予測されています。これらの要因により、バニラの需要は世界中で増加しており、バニラビーンの取引にプラスの影響を与えています。
アフリカがバニラビーン市場を独占
バニラの生産は非常に労働集約的であるため、人件費が低い国が好まれます。 FAOによると、2020年にマダガスカルは2,975トンのバニラを生産しました。成長率が低い国は、バニラ市場において長期的に人件費の優位性があり、生産量とランキングの増加につながると予想されます。
マダガスカルは、農業部門における労働力構成要素に比べて大きな利点があるため、依然として世界トップのバニラ生産国です。ウガンダは2020年に185トンのバニラを生産しました。コモロもアフリカ地域のバニラの主要生産国となることが期待されています。コモロの農村部の労働人口の少なくとも70%がバニラ生産に携わっていると推定されています。
ウガンダ中西部のいくつかの農家は、多国籍複合企業の介入によりバニラ栽培の援助を受けています。タンザニアの農家は利益を上げるためにコーヒーよりバニラを好みます。タンザニア農業省によると、バニラ生産量は過去5年間で大幅に増加し、2015年の年間229.8トンから2020年には1,949トンまで増加しました。タンザニアの小規模農家は、世界のバニラ市場の急成長から収益を上げており、それが彼らの経営を助けています。コーヒーを含む従来の換金作物の低収量によって引き起こされる損失のバランスを取る。
バニラビーン業界の概要
その他の特典
- エクセル形式の市場予測(ME)シート
- 3か月のアナリストサポート
目次
第1章 イントロダクション
- 調査の前提条件と市場の定義
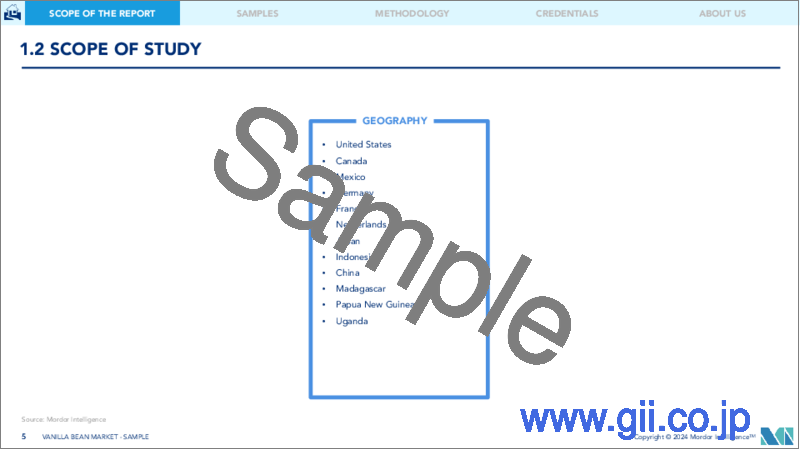
- 調査範囲
第2章 調査手法
第3章 エグゼクティブサマリー
第4章 市場力学
- 市場概要
- 市場促進要因
- 市場抑制要因
- バリューチェーン分析
第5章 市場セグメンテーション
- 地域
- 米国
- 生産分析
- 消費分析と市場価値
- 輸入市場分析(金額と数量)
- 輸出市場分析(金額と数量)
- 価格動向分析
- カナダ
- 生産分析
- 消費分析と市場価値
- 輸入市場分析(金額と数量)
- 輸出市場分析(金額と数量)
- 価格動向分析
- メキシコ
- 生産分析
- 消費分析と市場価値
- 輸入市場分析(金額と数量)
- 輸出市場分析(金額と数量)
- 価格動向分析
- ドイツ
- 生産分析
- 消費分析と市場価値
- 輸入市場分析(金額と数量)
- 輸出市場分析(金額と数量)
- 価格動向分析
- フランス
- 生産分析
- 消費分析と市場価値
- 輸入市場分析(金額と数量)
- 輸出市場分析(金額と数量)
- 価格動向分析
- オランダ
- 生産分析
- 消費分析と市場価値
- 輸入市場分析(金額と数量)
- 輸出市場分析(金額と数量)
- 価格動向分析
- 日本
- 生産分析
- 消費分析と市場価値
- 輸入市場分析(金額と数量)
- 輸出市場分析(金額と数量)
- 価格動向分析
- インドネシア
- 生産分析
- 消費分析と市場価値
- 輸入市場分析(金額と数量)
- 輸出市場分析(金額と数量)
- 価格動向分析
- 中国
- 生産分析
- 消費分析と市場価値
- 輸入市場分析(金額と数量)
- 輸出市場分析(金額と数量)
- 価格動向分析
- マダガスカル
- 生産分析
- 消費分析と市場価値
- 輸入市場分析(金額と数量)
- 輸出市場分析(金額と数量)
- 価格動向分析
- パプアニューギニア
- 生産分析
- 消費分析と市場価値
- 輸入市場分析(金額と数量)
- 輸出市場分析(金額と数量)
- ウガンダ
- 生産分析
- 消費分析と市場価値
- 輸入市場分析(金額と数量)
- 輸出市場分析(金額と数量)
- 価格動向分析
- 米国
第6章 市場機会と将来の動向
The Vanilla Bean Market size is estimated at USD 2.16 billion in 2024, and is expected to reach USD 2.46 billion by 2029, growing at a CAGR of 2.60% during the forecast period (2024-2029).
Vanilla is majorly produced in countries like Madagascar, Indonesia, Mexico, and China. The United States, France, and Germany are the major importer of vanilla. Madagascar accounts for over half of the world's vanilla output and contributed more than half of the world's export value in 2021. Although Madagascar retains the gold standard for vanilla quality, Indonesia is rising to the potential to become a viable alternative origin in terms of both quantity and quality. Due to increased vanilla demand by the super-premium ice cream business, vanilla exports from Madagascar, Indonesia, and other producing nations are expanding, mainly to Europe and the United States.
Vanilla beans are widely used in the food and beverage, cosmetics, and pharmaceutical industries due to their antioxidant and anti-carcinogenic properties. North America has experienced a rise in demand for vanilla-flavored food, ice creams, cosmetics, and pharmaceuticals, driving the vanilla bean market. The increasing population and demand for flavored food and beverages have been increasing, eventually driving market growth.
Vanilla Bean Market Trends
Application in Food and Pharmaceutical Industry is Driving the Market
The majority of vanilla produced is traded as a commodity (generic product) in vanilla beans. Vanilla product buyers are divided into home and industrial consumers with unique purchasing habits. Household users often buy finished vanilla goods like vanilla beans, extracts, or pasta at retail. In contrast, businesses typically buy vanilla as an ingredient in the form of vanilla beans in large quantities. Thus, industrial customers are more inclined to acquire vanilla beans as a commodity, but domestic consumers are more likely to purchase end goods (certified or branded).
Vanilla is widely used in the food and beverage industry as a flavoring ingredient in jellies, jams, and syrups. The antioxidants and antibacterial properties of vanilla make it suitable for skin cleansing and treating damaged skin-related problems. It is also known to alleviate anxiety disorders and depression. These benefits associated with the consumption of vanilla are expected to boost consumers' demand.
Vanilla possesses antioxidant properties and anti-carcinogenic properties, due to which it is widely used in the pharmaceutical industry. Vanillin, a flavorful constituent of vanilla pods, is used as a flavonoid in foods and beverages, pharmaceuticals, and cosmetics. The demand for vanilla is increasing in the pharmaceutical industry due to its antioxidant and anti-carcinogenic properties. As a result, the vanilla bean market is projected to grow during the forecast period. Due to these factors, demand for vanilla is increasing around the globe, thus impacting the vanilla bean trade positively.
Africa Dominates the Vanilla Beans Market
As vanilla production is highly labor-intensive, countries with low labor costs are favored. According to FAO, in 2020, Madagascar produced 2975 metric tons of vanilla. Countries with low growth rates are expected to have a long-term labor cost advantage within the vanilla market, leading to increased production and rankings.
Madagascar remains a top producer of vanilla worldwide because of its major advantage over the labor force component in the agricultural sector. Uganda produced 185 tons of vanilla in 2020. Comoros is also expected to be a major producer of vanilla in the African region. It is estimated that at least 70% of the working population in Comoros's rural areas is involved in vanilla production.
Several farmers in central and western Uganda are receiving vanilla farming assistance owing to the intervention of multinational conglomerates. Tanzanian farmers prefer vanilla over coffee for higher profits. According to Tanzania's Agriculture Ministry, vanilla production has increased significantly in the last five years, rising from 229.8 ton per year in 2015 to 1,949 ton in 2020. Smallholder farmers in Tanzania are generating revenues from the surging global vanilla market, which is helping them in balancing losses caused by weak yields from conventional cash crops, including coffee.
Vanilla Bean Industry Overview
Additional Benefits:
- The market estimate (ME) sheet in Excel format
- 3 months of analyst support
TABLE OF CONTENTS
1 INTRODUCTION
- 1.1 Study Assumptions and Market definition
- 1.2 Scope of the Study
2 RESEARCH METHODOLOGY
3 EXECUTIVE SUMMARY
4 MARKET DYNAMICS
- 4.1 Market Overview
- 4.2 Market Drivers
- 4.3 Market Restraints
- 4.4 Value Chain Analysis
5 MARKET SEGMENTATION
- 5.1 Geography
- 5.1.1 United States
- 5.1.1.1 Production Analysis
- 5.1.1.2 Consumption Analysis and Market Value
- 5.1.1.3 Import Market Analysis (Value and Volume)
- 5.1.1.4 Export Market Analysis (Value and Volume)
- 5.1.1.5 Price Trend Analysis
- 5.1.2 Canada
- 5.1.2.1 Production Analysis
- 5.1.2.2 Consumption Analysis and Market Value
- 5.1.2.3 Import Market Analysis (Value and Volume)
- 5.1.2.4 Export Market Analysis (Value and Volume)
- 5.1.2.5 Price Trend Analysis
- 5.1.3 Mexico
- 5.1.3.1 Production Analysis
- 5.1.3.2 Consumption Analysis and Market Value
- 5.1.3.3 Import Market Analysis (Value and Volume)
- 5.1.3.4 Export Market Analysis (Value and Volume)
- 5.1.3.5 Price Trend Analysis
- 5.1.4 Germany
- 5.1.4.1 Production Analysis
- 5.1.4.2 Consumption Analysis and Market Value
- 5.1.4.3 Import Market Analysis (Value and Volume)
- 5.1.4.4 Export Market Analysis (Value and Volume)
- 5.1.4.5 Price Trend Analysis
- 5.1.5 France
- 5.1.5.1 Production Analysis
- 5.1.5.2 Consumption Analysis and Market Value
- 5.1.5.3 Import Market Analysis (Value and Volume)
- 5.1.5.4 Export Market Analysis (Value and Volume)
- 5.1.5.5 Price Trend Analysis
- 5.1.6 Netherlands
- 5.1.6.1 Production Analysis
- 5.1.6.2 Consumption Analysis and Market Value
- 5.1.6.3 Import Market Analysis (Value and Volume)
- 5.1.6.4 Export Market Analysis (Value and Volume)
- 5.1.6.5 Price Trend Analysis
- 5.1.7 Japan
- 5.1.7.1 Production Analysis
- 5.1.7.2 Consumption Analysis and Market Value
- 5.1.7.3 Import Market Analysis (Value and Volume)
- 5.1.7.4 Export Market Analysis (Value and Volume)
- 5.1.7.5 Price Trend Analysis
- 5.1.8 Indonesia
- 5.1.8.1 Production Analysis
- 5.1.8.2 Consumption Analysis and Market Value
- 5.1.8.3 Import Market Analysis (Value and Volume)
- 5.1.8.4 Export Market Analysis (Value and Volume)
- 5.1.8.5 Price Trend Analysis
- 5.1.9 China
- 5.1.9.1 Production Analysis
- 5.1.9.2 Consumption Analysis and Market Value
- 5.1.9.3 Import Market Analysis (Value and Volume)
- 5.1.9.4 Export Market Analysis (Value and Volume)
- 5.1.9.5 Price Trend Analysis
- 5.1.10 Madagascar
- 5.1.10.1 Production Analysis
- 5.1.10.2 Consumption Analysis and Market Value
- 5.1.10.3 Import Market Analysis (Value and Volume)
- 5.1.10.4 Export Market Analysis (Value and Volume)
- 5.1.10.5 Price Trend Analysis
- 5.1.11 Papua New Guinea
- 5.1.11.1 Production Analysis
- 5.1.11.2 Consumption Analysis and Market Value
- 5.1.11.3 Import Market Analysis (Value and Volume)
- 5.1.11.4 Export Market Analysis (Value and Volume)
- 5.1.12 Uganda
- 5.1.12.1 Production Analysis
- 5.1.12.2 Consumption Analysis and Market Value
- 5.1.12.3 Import Market Analysis (Value and Volume)
- 5.1.12.4 Export Market Analysis (Value and Volume)
- 5.1.12.5 Price Trend Analysis
- 5.1.1 United States

