
|
市場調査レポート
商品コード
1851174
可変施肥技術:市場シェア分析、産業動向、統計、成長予測(2025年~2030年)Variable Rate Technology - Market Share Analysis, Industry Trends & Statistics, Growth Forecasts (2025 - 2030) |
||||||
カスタマイズ可能
適宜更新あり
|
|||||||
| 可変施肥技術:市場シェア分析、産業動向、統計、成長予測(2025年~2030年) |
|
出版日: 2025年06月25日
発行: Mordor Intelligence
ページ情報: 英文 120 Pages
納期: 2~3営業日
|

概要
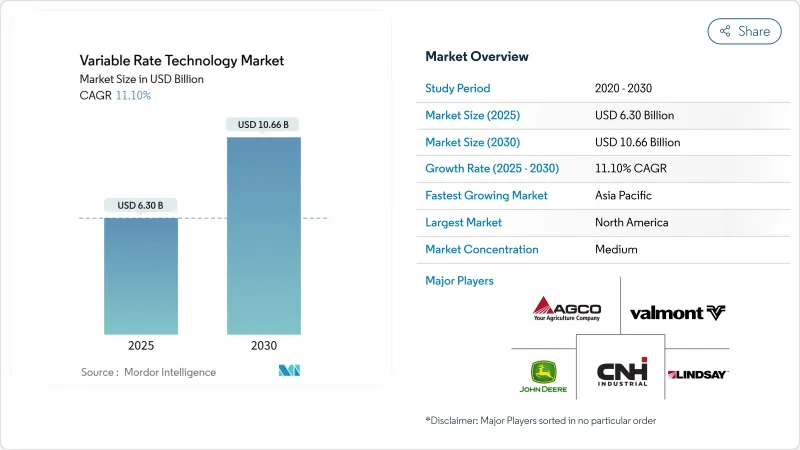
可変施肥技術市場規模は2025年に63億米ドルと推定・予測され、予測期間中のCAGRは11.10%で、2030年には106億6,000万米ドルに達すると予測されます。
より少ない資源でより多くの食料を生産するという圧力の高まりと、肥料や農薬の使用に関する規制の監視が相まって、可変施肥技術市場は精密投入物管理の極めて重要な実現要因として位置づけられています。農業のデジタル化、機器に組み込まれたAI、有利な補助金制度が技術の魅力を高め、機器メーカーの統合がプラットフォームの革新を加速します。北米が収益の柱であることに変わりはないが、近代化計画が拡大するにつれてアジア太平洋が最も成長率に寄与しています。価値創造は依然としてハードウェア販売が支配的だが、サービス中心のビジネスモデルが急速に拡大し、成果ベースの提供へと業界がシフトしていることを示しています。
世界の可変施肥技術市場の動向と洞察
農場の急速なデジタル化
米国の農場の61%は、リアルタイムの農学データをクラウドプラットフォームにフィードする精密ハードウェアにすでに依存しています。機器メーカーは、労働力を削減し、アプリケーションの精度を向上させる自律型ソリューションに数十億米ドルの予算を割り当てており、これはJohn Deere社の10年にわたる200億米ドルの国内製造計画に示されています。欧州の政策も同様に、農業のための今後のデジタル戦略を優先し、コネクテッドデバイスのための持続的な資金を確保しています。AI主導のアルゴリズムが生み出すクローズド・フィードバック・ループは、処方箋を継続的に調整し、可変施肥技術市場を静的な地図から自己学習システムへと移行させる。しかし、大規模農家と小規模農家との間に広がるデジタルデバイドが、公平な技術導入を脅かしています。
政府補助金と奨励金制度
政策立案者は、補助金、リベート、エコスキームなどを利用して、導入コストの引き受けを行っています。米国農務省の気候スマート商品イニシアティブは、きめ細かな生産データ、ひいては精密入力ツールを必要とするプロジェクトに31億米ドルを投入しています。オーストラリアのOn-Farm Connectivity Programは、スマート灌漑機器のコストの半分をカバーし、インドのDigital Agriculture Missionは、接続されたインフラに6,000カロールインドルピー(7億2,289万米ドル)を計上しています。欧州の共通農業政策では、直接支払額の少なくとも25%を、可変率施肥に報いるエコスキームに振り向けています。こうした補助金は、特に、かつてハイテク支出によってキャッシュフローが制限されていた中規模農場にとっては、参入障壁を下げることになります。
VRT対応機械の高い資本支出
収益性の損益分岐点は、経済的な農場規模が10万ユーロ(114,923.51米ドル)を超えた時点から始まることが多く、小規模な経営では機器購入から見放されてしまいます。AgDirectのような金融機関は、分野別のローンを提供しているが、バランスシートの薄い家族経営の農場には担保のハードルが高いです。このような状況を回避するために、所有ユニットではなく、サービス提供エーカーにコストを分散させるサービスとしての機器契約があります。
セグメント分析
2024年、穀物・穀類は売上の37.60%を占め、可変施肥技術市場の基盤としての役割を確固たるものにします。これらの広面積作物は、広大な土地で窒素、リン、播種密度を微調整する数十年にわたる処方マッピングの恩恵を受けています。綿花、タバコ、特殊繊維のような商業用作物は、14.80%のCAGR見通しで最も速い伸びを示し、より高い利幅がプレミアムセンサーとオン装置AIを正当化します。商業作物の可変施肥技術市場規模は、正確なミクロネアまたは葉の等級に報いる品質連動価格体系と連動して上昇すると予想されます。マルチスペクトルカメラによる植物ストレスの継続的モニタリングは、数分以内にカリウムや葉面給餌の介入を開始するリアルタイムモデルに供給されます。この応答性により、生産者は契約ボーナスを獲得し、等級に関連した格下げを減らすことができます。穀類は今後も設置ベースの台数を維持すると思われるが、先進的な機能の取り込みは特殊分野がペースを握る。
第二世代の土壌スペクトロスコピーは、油糧種子とパルスの輪作における肥料の微量施肥を支える養分放出曲線を測定できるようになりました。特に、タンパク質と油分の含有量が農産物価格に直接影響するブラジルとインドでの導入が進んでいます。可変施肥技術市場は、果物の輸出業者がBrixと色の許容範囲を厳しくするよう要求しているため、果樹園とブドウ園のオペレーションにさらに浸透しています。プロバイダーは、樹液分析と灌漑量制御をサブスクリプション・サービスにバンドルしているため、小規模な面積の果樹園でも、機器を購入することなくハイエンドの分析にアクセスすることができます。
2024年の肥料市場シェアは31.70%でした。これは、窒素効率の改善がほとんどの気候帯で迅速な投資回収を実現するためです。可変レート灌漑は、深刻化する水不足と季節的取水量に対する規制の上限を反映して、2030年までにCAGR 17.20%の勢いです。カリフォルニア州の試験において、精密ピボット灌漑は収量減を伴わずに水使用量を25%削減し、アーモンドとピスタチオの畑の経済性を実証しました。灌漑機器の可変施肥技術市場規模は、低圧ノズルの改修を償還する補助金プログラムに後押しされ、2030年までに10億米ドルの売上増が見込まれます。作物保護散布は、コンピューター・ビジョンによる雑草識別で除草剤の量が最大80%削減されるため、そのすぐ後に続きます。これらの利益に加え、収量モニタリング・アプリケーションは、将来の処方を改良し、分析ソフトウェアのサブスクリプション更新を支えるデータ・フィードバック・ループを完成させる。
ワイヤレス土壌プローブとクラウドダッシュボードの統合により、蒸発散予測と将来の降雨確率を考慮した灌漑の決定が可能になります。この予測機能により、ポンプの寿命が延び、エネルギー需要が削減され、資源効率の価値提案が強化されます。肥料アプリケーションでは、レートコントローラーと同期するポータブルラボキットによるリアルタイムの組織検査を活用し、静的マップをシーズン中の動的スケジュールに変換しています。生物学的作物保護投入物の製品革新は、センサー駆動の可変速度アルゴリズムに依存する正確な微量投与の必要性をさらに増幅しています。
地域分析
北米は可変施肥技術市場の2024年の売上高の39%を占めました。旺盛な機械普及率、支援融資、USDAの気候変動に配慮した調達規則が需要を支えています。補助金の枠組みは、文書化された栄養分の削減に報いるもので、ノズルレベルのログを取得するスマート器具の採用に拍車をかけています。農村部のブロードバンドは、中西部とプレーリー地方の一部で遅れているが、衛星リンクの展開により、2026年までにカバー範囲が拡大する見込みです。オハイオ州での試験では、VR窒素とドローンのスタンドカウントが交差した場合、収量が6%増加することが示されています。ディーラーのエコシステムは、フリートを維持しデータを解釈する認定技術者を供給し、サービス成長の物語を強調しています。
アジア太平洋は最も急速に成長しており、2030年までのCAGRは14.1%です。中国の最新5カ年計画では、低炭素で高効率の農業が推進されており、これは的を絞った投入資材の供給と連動しています。インドのアーダー(Aadhaar)連動農家登録はセンサー・キットの補助金支払いを簡素化し、日本の食糧農業省は水田に特化した可変率播種試験に共同出資します。この地域の小区画圃場構造が、村の起業家が運用するシェアード・サービスのドローンなど、独創的な解決策に火をつける。オーストラリアと中国北部の水不足は、可変容量灌漑の導入を加速させ、国境を越えた知識の移転とハードウェアの輸入を促進します。
欧州では、徹底した気候変動政策に可変施肥技術の採用が組み込まれます。2023年から27年にかけての共通農業政策では、2,695億ユーロ(3,124億米ドル)が割り当てられ、その半分近くが、肥料の流出や農薬のドリフトを減らすなどの気候変動対策に充てられます。各加盟国は、直接支払いの少なくとも25%をエコ・スキームに充てなければならないです。オランダのような国は、センサー設置の最大40%を償還するデジタル化助成金に資金を提供し、導入を急いでいます。データ主権に関する規則は、プラットフォームが一般データ保護規則(General Data Protection Regulation)の義務に適応するためのコンプライアンス・コストを引き上げています。それにもかかわらず、ドイツの5Gテストベッド農業のようなコンソーシアム・プロジェクトは、安全な接続性の信頼性を高め、欧州全体の炭素イニシアチブは、料金管理者によって生成された追跡可能な入力データに依存しています。
その他の特典:
- エクセル形式の市場予測(ME)シート
- 3ヶ月のアナリストサポート
よくあるご質問
目次
第1章 イントロダクション
- 調査の前提条件と市場の定義
- 調査範囲
第2章 調査手法
第3章 エグゼクティブサマリー
第4章 市場情勢
- 市場概要
- 市場促進要因
- 農場の急速なデジタル化
- 政府補助金とインセンティブ制度
- 農業労働者不足の深刻化
- 衛星NB-IoTによるサブエーカー施肥
- インプット・トレーサビリティを要求する炭素クレジットの収益化
- オフラインVRT分析用オン装置AIチップ
- 市場抑制要因
- VRT対応機械の設備投資が高め
- 脆弱な地方接続インフラ
- データの所有権と共有の曖昧さ
- VRT熟練農学サービス・プロバイダーの不足
- 規制情勢
- テクノロジーの展望
- ポーターのファイブフォース分析
- 新規参入業者の脅威
- 買い手の交渉力
- 供給企業の交渉力
- 代替品の脅威
- 競争企業間の敵対関係
第5章 市場規模と成長予測
- 作物タイプ別
- 穀物・穀類
- 果物・野菜
- 油糧種子および豆類
- 商業作物
- 用途別
- 肥料
- 農作物保護化学品
- 土壌センシング
- 収量モニタリング
- 灌漑
- その他(可変施肥播種/植え付け、可変率石灰および土壌改良剤散布)
- 提供別
- ハードウェア
- ソフトウェア
- サービス
- 実施方法別
- 地図ベースのVRT
- センサーベースVRT
- 農場規模別
- 大規模農場(1,000ヘクタール以上)
- 中規模農場(200~1,000ヘクタール)
- 小規模農場(200ヘクタール未満)
- 地域別
- 北米
- 米国
- カナダ
- メキシコ
- その他北米地域
- 欧州
- ドイツ
- フランス
- 英国
- イタリア
- スペイン
- ロシア
- その他欧州地域
- アジア太平洋地域
- 中国
- 日本
- インド
- 韓国
- オーストラリア
- その他アジア太平洋地域
- 中東
- トルコ
- サウジアラビア
- アラブ首長国連邦
- その他中東
- アフリカ
- 南アフリカ
- エジプト
- ナイジェリア
- その他アフリカ
- 北米
第6章 競合情勢
- 市場集中度
- 戦略的動向
- 市場シェア分析
- 企業プロファイル
- Deere & Company
- AGCO Corporation
- CNH Industrial N.V.
- Valmont Industries, Inc.
- Lindsay Corporation
- EarthOptics
- Hexagon AB
- CropX Technologies
- TeeJet Technologies(Spraying Systems)
- DJI
- DroneDeploy
- The Climate Corporation(Bayer AG)
- EOS Data Analytics,Inc
- SoilOptix
- Frontier Agriculture Ltd

