
|
市場調査レポート
商品コード
1433944
水産飼料添加物:市場シェア分析、産業動向と統計、成長予測(2024年~2029年)Aquafeed Additives - Market Share Analysis, Industry Trends & Statistics, Growth Forecasts (2024 - 2029) |
||||||
カスタマイズ可能
適宜更新あり
|
|||||||

| 水産飼料添加物:市場シェア分析、産業動向と統計、成長予測(2024年~2029年) |
|
出版日: 2024年02月15日
発行: Mordor Intelligence
ページ情報: 英文 109 Pages
納期: 2~3営業日
|

- 全表示
- 概要
- 目次
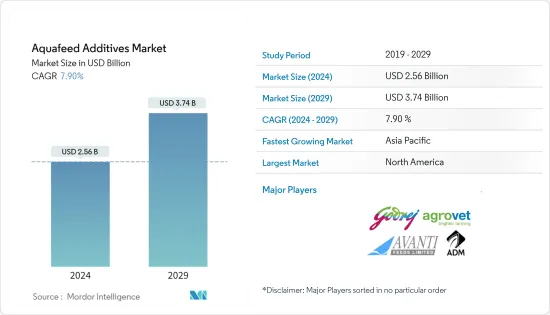
水産飼料添加物市場規模は、2024年に25億6,000万米ドルと推定され、2029年までに37億4,000万米ドルに達すると予測されており、予測期間(2024年から2029年)中に7.90%のCAGRで成長します。
水産飼料添加物は、タンパク質とオメガ 3脂肪酸の豊富な供給源です。これらの添加物は、飼料の品質を向上させ、寄生虫による魚の感染を防ぐために水産飼料に添加されます。養殖中の寄生虫の防除は経済的損失につながる可能性があるため、非常に重要です。これらの添加剤は、健全な成長、免疫システムの改善、飼料変換の強化、および水産飼料の死亡率の低下などの利点をもたらします。したがって、添加剤に対するメーカーの意識が高まることで市場が活性化するでしょう。例えば、コイ、ティラピア、サケ、ナマズなどのいくつかの養殖種における口塩や飼料酸性化剤などの水産飼料添加物は、特に新興国で大きな需要が見られます。これにより、予測期間中に補完的な成長が追加されます。
水産飼料添加物市場動向
魚の消費量の増加
国連食糧農業機関(FAO)によると、世界の食用魚の消費量は一人当たりで1961年の9 kgから2015年の20.2 kgまで増加し、年間平均1.5パーセントの拡大率となっています。 2016年と2017年の消費量はそれぞれ20.3 Kgと20.5 Kgでした。世界市場における水産養殖の劇的な台頭と台頭は、消費者の栄養に対する意識の高まりと相まって、世界的に配合飼料および飼料添加物の販売に拍車をかけました。例えば、アジア諸国、特に東アジアおよび東南アジアにおける魚の消費は、都市人口の増加と増加、魚生産の劇的な拡大、国際的な魚貿易の増加、可処分所得の増加が組み合わさって推進されており、水産飼料添加物市場を牽引することになると思われます。予測期間中。
北米が市場を独占
カナダや米国が水産飼料飼料添加剤市場を独占しています。サケ科や軟体動物などの種の消費量の増加が成長に大きく貢献しています。北米は国内市場だけでなく国際市場にもサービスを提供しています。欧州市場における水産飼料添加物の需要は、主にアイルランド、デンマーク、ノルウェーなどの地域に集中して過去数十年にわたって増加しています。アジア太平洋地域では、今後数十年間でさらに高い成長率が見られるでしょう。好ましい気候条件による安価な労働力、資源の豊富な入手可能性、添加物に関連する栄養に対する意識の高まりにより、予測期間中に市場は活性化するでしょう。
水産飼料添加物業界の概要
水産飼料添加物業界は細分化された市場であり、上位5~6社が市場シェアのほぼ40%を占めています。これらの企業は、新しい生産部門に投資したり、特定の地域で確立された小規模企業を買収したりすることにより、事業拡大のために世界のほとんどの地域の国をターゲットにしています。新しい効率的な製品を導入するための研究開発活動への投資は、北米や欧州の成熟した市場で競合に先んじるためにメーカーが採用するもう1つの戦略です。
その他の特典
- エクセル形式の市場予測(ME)シート
- 3か月のアナリストサポート
目次
第1章 イントロダクション
- 調査の成果
- 調査の前提
- 調査範囲
第2章 調査手法
第3章 エグゼクティブサマリー
第4章 市場力学
- 市場概要
- 市場促進要因
- 市場抑制要因
- ポーターのファイブフォース分析
- 新規参入業者の脅威
- 買い手・消費者の交渉力
- 供給企業の交渉力
- 代替品の脅威
- 競争企業間の敵対関係の強さ
第5章 市場セグメンテーション
- 魚種別
- 魚類
- 軟体動物
- 甲殻類
- その他
- 添加物別
- ビタミン
- ミネラル
- 酸化防止剤
- アミノ酸
- 酵素
- 酸味料
- その他
- 地域別
- 北米
- 米国
- カナダ
- メキシコ
- その他北米地域
- 欧州
- ドイツ
- 英国
- フランス
- ロシア
- スペイン
- その他欧州
- アジア太平洋
- インド
- 中国
- 日本
- その他アジア太平洋地域
- 南米
- ブラジル
- アルゼンチン
- その他南米
- 北米
第6章 競合情勢
- 市場シェア分析
- 最も採用されている戦略
- 企業プロファイル
- Thai Union Group
- Inve Aquaculture Inc.
- Growel Feeds Pvt Ltd
- BASF
- South East Asia Pte Ltd
- Adisseo Asia Pacific Lte
- CP Group
- Cargill incorporated
- Nutreco N.V
- Archer Daniels Midland Company(US)
第7章 市場機会と今後の動向
The Aquafeed Additives Market size is estimated at USD 2.56 billion in 2024, and is expected to reach USD 3.74 billion by 2029, growing at a CAGR of 7.90% during the forecast period (2024-2029).
Aquafeed additives are rich sources of proteins and omega 3 fatty acids. These additives are added to aquafeed to enhance the feed quality and prevent infections in fish caused by parasites. Controlling parasites during fish farming is highly important as it can lead to economic losses. These additives provide benefits such as healthy growth, improved immunity system, enhance feed conversion, and reduce the mortality rate of aquafeed. Thus increasing awareness among the manufacturers regarding the additives will boost up the market. For instance, Aquafeed additives such as palatants and feed acidifiers, in several cultivar species such as carp, tilapia, salmon and catfish, especially in emerging economies, are witnessing huge demand. This will add a complementary growth during the forecast period.
Aquafeed Additives Market Trends
Increase in Fish Consumption
According to the Food and Agriculture Organization of the United Nations ( FAO), in per capita terms, global food fish consumption grew from 9 Kg in 1961 to 20.2 Kg in 2015, representing an average expansion rate of 1.5 percent per annum. In 2016 and 2017, the consumption rate was 20.3 Kg and 20.5 Kg respectively. The dramatic rise and emergence of aquaculture in the global market place, coupled with the increased nutritional awareness among consumers, spurred the sales of compound feed and feed additives globally. For instance, fish consumption in Asian countries, particularly eastern and southeastern Asia, has been driven by a combination of large, growing and increasing urban population, dramatic expansion of fish production, rising international fish trade and increasing disposable income will drive the aquafeed additive market during the forecast period.
North America Dominates the Market
North America dominates the aquafeed additive market as the production is projected to increase with increase in seafood consumption in countries like Canada and The U.S. Increase consumption of species such as salmonids and mollusks are majorly contributing to the growth. North America serves both International as well as domestic markets. Demand for aquafeed additives in Europe market increasing over the past decades majorly focusing on the region like Ireland, Denmark, and Norway. The Asia Pacific will witness a higher growth rate in the upcoming decades. Cheap labor, abundance availability of resources, owing to favorable climatic conditions and increase awareness of the nutrition associated with additives will gear up the market during the forecast period.
Aquafeed Additives Industry Overview
The aquafeed additive industry is a fragmented market, with the top 5-6 companies accounting for almost 40% of the market share. These companies are targeting countries in most parts of the world for business expansion, either by investing in new production units or acquiring established small players in specific regions. The investment in R&D activities to introduce new and efficient products is another strategy adopted by manufacturers to stay ahead of their competition in the matured markets of North America and Europe.
Additional Benefits:
- The market estimate (ME) sheet in Excel format
- 3 months of analyst support
TABLE OF CONTENTS
1 INTRODUCTION
- 1.1 Study Deliverables
- 1.2 Study Assumptions
- 1.3 Scope of the Study
2 RESEARCH METHODOLOGY
3 EXECUTIVE SUMMARY
4 MARKET DYNAMICS
- 4.1 Market Overview
- 4.2 Market Drivers
- 4.3 Market Restraints
- 4.4 Porter's Five Forces Analysis
- 4.4.1 Threat of New Entrants
- 4.4.2 Bargaining Power of Buyers/Consumers
- 4.4.3 Bargaining Power of Suppliers
- 4.4.4 Threat of Substitute Products
- 4.4.5 Intensity of Competitive Rivalry
5 MARKET SEGMENTATION
- 5.1 By Species Type
- 5.1.1 Fish
- 5.1.2 Mollusks
- 5.1.3 Crustaceans
- 5.1.4 Others
- 5.2 By Additives
- 5.2.1 Vitamins
- 5.2.2 Minerals
- 5.2.3 Antioxidants
- 5.2.4 Amino Acids
- 5.2.5 Enzymes
- 5.2.6 Acidifiers
- 5.2.7 Others
- 5.3 Geography
- 5.3.1 North America
- 5.3.1.1 United States
- 5.3.1.2 Canada
- 5.3.1.3 Mexico
- 5.3.1.4 Rest of North America
- 5.3.2 Europe
- 5.3.2.1 Germany
- 5.3.2.2 United Kingdom
- 5.3.2.3 France
- 5.3.2.4 Russia
- 5.3.2.5 Spain
- 5.3.2.6 Rest of Europe
- 5.3.3 Asia Pacific
- 5.3.3.1 India
- 5.3.3.2 China
- 5.3.3.3 Japan
- 5.3.3.4 Rest of the Asia-Pacific
- 5.3.4 South America
- 5.3.4.1 Brazil
- 5.3.4.2 Argentina
- 5.3.4.3 Rest of South America
- 5.3.1 North America
6 COMPETITIVE LANDSCAPE
- 6.1 Market Share Analysis
- 6.2 Most Adopted Strategies
- 6.3 Company Profiles
- 6.3.1 Thai Union Group
- 6.3.2 Inve Aquaculture Inc.
- 6.3.3 Growel Feeds Pvt Ltd
- 6.3.4 BASF
- 6.3.5 South East Asia Pte Ltd
- 6.3.6 Adisseo Asia Pacific Lte
- 6.3.7 CP Group
- 6.3.8 Cargill incorporated
- 6.3.9 Nutreco N.V
- 6.3.10 Archer Daniels Midland Company (US)
