
|
市場調査レポート
商品コード
1911754
有機肥料:市場シェア分析、業界動向と統計、成長予測(2026年~2031年)Organic Fertilizer - Market Share Analysis, Industry Trends & Statistics, Growth Forecasts (2026 - 2031) |
||||||
カスタマイズ可能
適宜更新あり
|
|||||||
| 有機肥料:市場シェア分析、業界動向と統計、成長予測(2026年~2031年) |
|
出版日: 2026年01月12日
発行: Mordor Intelligence
ページ情報: 英文 120 Pages
納期: 2~3営業日
|

概要
有機肥料市場は2025年に110億米ドルと評価され、2026年の119億9,000万米ドルから2031年までに184億6,000万米ドルに達すると予測されています。
予測期間(2026-2031年)におけるCAGRは9.03%と見込まれます。
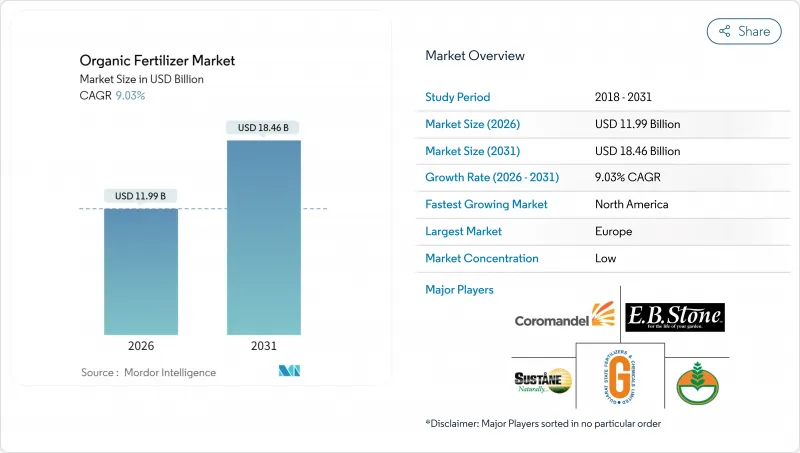
持続可能性への要求の高まり、クリーンラベル食品に対する消費者需要、高炭素投入物に対する規制上の罰則が、主要な作物システム全体での採用を推進しています。現在、欧州が市場の主導権を握っていますが、北米における急速な生産能力拡大と政府補助金プログラムの拡充により、成長のバランスは西半球へと傾きつつあります。家畜ふん尿、食品廃棄物、作物残渣を標準化された無病原性顆粒に変換する技術革新により、保存期間と栄養素の予測可能性が向上し、従来から合成肥料とのコスト差が縮小しています。同時に、企業のネットゼロ目標達成に向けた取り組みが、認証生産者への長期供給契約を促進し、収益の見通しを確定させるとともに投資リスクを低減しています。
世界の有機肥料市場の動向と洞察
政府の奨励策と補助金
公的支出が有機肥料市場のコスト経済性を再定義しています。米国農務省(USDA)の肥料生産拡大プログラムは2025年、国内生産能力に1億1,630万米ドルを投入。内訳は黒兵蠅による廃棄物アップサイクリングに2,500万米ドル、農場内堆肥処理に1,280万米ドルです。アイルランドの有機転換助成金やドイツの3年間のリスク軽減パッケージなど、欧州連合(EU)の同等の資金調達チャネルは、合成肥料との価格差を縮小しています。これらのインセンティブは、厳格化する環境規制と連動し、生産者を低炭素代替品へと効果的に誘導しています。補助金が資本障壁を低減するにつれ、小規模施設が増加し、地域の供給レジリエンスが高まり、輸送距離が短縮されています。自主的な炭素市場と組み合わせることで、政府助成金は二重の収益源を生み出し、プロジェクトの経済性をさらに強化します。
有機食品に対する消費者需要の高まり
有機食品への支出は堅調に推移しており、有機貿易協会(OTA)の報告によれば2024年まで二桁の売上成長が見込まれます。健康志向の若い世代やパンデミック期の購買習慣が、化学物質不使用の農産物を優先し続けています。ブランド各社はスコープ3排出量目標達成に向け、認証済みサプライチェーンへの調達シフトを進めており、ペプシコ欧州が2030年までに低炭素肥料を毎年調達する合意に至ったことがその証左です。プレミアム食品の価格帯拡大により農場出荷時のマージンが向上し、生産者は投入コストの上昇を吸収しつつ収量を維持できます。この需要牽引により、主要流通業者は有機認証農産物を標準在庫として取り扱うようになり、有機肥料市場はニッチからサプライチェーンの基盤的地位へと移行しつつあります。
合成肥料よりも高い生産コスト
有機肥料は、尿素やリン酸一アンモニウムと比較して、栄養素単位あたり30~50%高価な状態が続いております。これは主に、バッチ式堆肥化、長い熟成サイクル、高い労働集約性に起因します。また、栄養密度が低いことから施用量が増加し、繁忙期の燃料費や設備費を押し上げます。補助金により差は縮小しているもの、多くの商品作物生産者は依然として利益率が低く、管理規則が許容する場合、合成肥料が経済的に有利となる状況です。短距離輸送型の微粒化プラントは輸送コスト削減により問題の一部を緩和しますが、地域原料価格の高騰や労働市場の逼迫時には、見せかけの経済性が持続する可能性があります。
セグメント分析
2025年時点で、家畜ふん尿由来製品は有機肥料市場シェアの42.58%を占め、2031年までCAGR9.62%で首位を維持すると予測されています。これは市場の成熟と成長余地の両方を反映しています。本セグメントは、家畜頭数の増加と、家畜ふん尿を病原体フリーのペレットに処理する農場内消化装置の普及により恩恵を受けています。有機畑作農家からの堅調な需要が基盤となる販売量を支え、一方、特殊果樹・ナッツ栽培事業では、高温好熱性堆肥化処理を施した家畜ふん尿由来の葉面散布用製剤の試験導入が進められています。
循環型経済の経済性が、この分野の回復力を支えています。カリフォルニア州の酪農協同組合では、分離された固形物を蠕虫濾過ベッドに供給し、栄養豊富な堆肥を生産することで、従来は廃棄物処理の負担であったものを収益化しています。臭気制御用接種剤の特許出願が急増しており、近隣での堆肥処理に対する長年の地域反対という障壁に取り組んでいます。本セグメントは、原料のトレーサビリティが十分に文書化されているため、バイオソリッドよりも迅速な有機肥料認証機関(OMRI)登録が可能であり、認証プログラムにおける早期導入農地の獲得を促進しています。処理能力の拡大に伴い平均輸送距離が短縮され、物流コストが削減されることで、有機肥料市場における競争力がさらに高まっています。
本有機肥料市場レポートは、形態別(家畜ふん尿、粉状肥料など)、作物タイプ別(換金作物、園芸作物、畑作物)、地域別(アフリカ、アジア太平洋、欧州など)に分類されています。市場予測は金額(米ドル)および数量(メトリックトン)で提供されます。
地域別分析
欧州は2025年に世界収益の40.35%を占めており、この地位は2030年までに農地の25%を有機化することを目標とする欧州連合の「農場から食卓まで」戦略に根ざしています。ドイツの補助金プログラムでは、転換初年度の認証費用の最大70%が償還され、生産者の財務リスクが大幅に軽減されています。同地域の成熟した有機食品小売セクターは安定した下流プレミアムを支え、家計支出が抑制される中でも年間複合消費成長を可能にしています。COMPOグループが2024年にミュンスターに先進的な放出技術プラントを稼働させたことで、栄養素供給の精度が向上し、欧州が今後の世界の品質基準を形作る技術動向の先駆者としての地位を確固たるものにしています。
北米は最も成長が著しい地域であり、2031年までにCAGR11.55%が見込まれています。これは米国農務省(USDA)の肥料生産拡大プログラムによる76施設への資金支援が後押ししています。カリフォルニア州では、昆虫由来廃棄物の高度化処理を含む、重要なイノベーションが集積しています。特に加工食品大手企業における気候変動対策宣言により、調達先が有機原料へ移行し、原料供給業者への需要が高まっています。カナダ・プレーリー地方では現在、豆類加工工場と堆肥化施設を併設し、高タンパク質の微粉を畑用土壌改良材として再利用する取り組みが進められており、地域の循環型経済への貢献度を高めています。
アジア太平洋地域は最大の未開拓フロンティアとして位置づけられます。KRIBHCOがノボネシスと提携し、1エーカーあたり500~600ルピー(6.3~7.5米ドル)で「リゾスーパ」を販売するといった官民連携は、手頃な価格と技術的知識のギャップを埋める戦略を示しています。中国の環境改善策はポリハライトの輸入を促進し、有機基質との相性が良い補完的な鉱物資源を提供しています。タイでは2024年末から稼働中の完全統合型肥料パークが国内外のユーザーに供給しており、見通し期間中に同地域が輸入国から競合する輸出国へ転換する兆候を示しています。
その他の特典:
- エクセル形式の市場予測(ME)シート
- アナリストによる3ヶ月間のサポート
よくあるご質問
目次
第1章 イントロダクション
- 調査の前提条件と市場の定義
- 調査範囲
- 調査手法
第2章 レポート提供
第3章 エグゼクティブサマリーおよび主要な調査結果
第4章 主要な業界動向
- 有機栽培面積
- 有機製品への一人当たり支出額
- 規制の枠組み
- オーストラリア
- ブラジル
- カナダ
- 中国
- フランス
- ドイツ
- インド
- インドネシア
- イタリア
- 日本
- メキシコ
- オランダ
- フィリピン
- ロシア
- スペイン
- タイ
- トルコ
- 英国
- 米国
- ベトナム
- バリューチェーン及び流通チャネル分析
- 市場促進要因
- 政府による奨励策と補助金
- 有機食品に対する消費者需要の高まり
- 化学肥料を制限する環境規制
- 認証有機農地の拡大
- 循環型経済における廃棄物から肥料への転換パートナーシップ
- センサーによる堆肥品質分析
- 市場抑制要因
- 合成肥料よりも高い生産コスト
- 栄養成分含有量と品質基準の不均一性
- バイオエネルギーおよび飼料産業からの原料競合
- 物流排出規制によるかさばる堆肥輸送へのペナルティ
第5章 市場規模と成長予測(金額と数量)
- 形態
- 堆肥
- ミールベース肥料
- 油粕
- その他の有機肥料
- 作物タイプ
- 換金作物
- 園芸作物
- 畑作作物
- 地域
- アフリカ
- 国別
- エジプト
- ナイジェリア
- 南アフリカ
- その他アフリカ
- 国別
- アジア太平洋地域
- 国別
- オーストラリア
- 中国
- インド
- インドネシア
- 日本
- フィリピン
- タイ
- ベトナム
- その他アジア太平洋地域
- 国別
- 欧州
- 国別
- フランス
- ドイツ
- イタリア
- オランダ
- ロシア
- スペイン
- トルコ
- 英国
- その他欧州地域
- 国別
- 中東
- 国別
- イラン
- サウジアラビア
- その他中東
- 国別
- 北米
- 国別
- カナダ
- メキシコ
- 米国
- その他北米地域
- 国別
- 南米
- 国別
- アルゼンチン
- ブラジル
- その他南米
- 国別
- アフリカ
第6章 競合情勢
- 主要な戦略的動きs
- 市場シェア分析
- 企業概況
- 企業プロファイル
- Coromandel International Ltd
- Italpollina SPA
- Gujarat State Fertilizers and Chemicals Ltd
- Deepak Fertilisers and Petrochemicals Corp. Ltd
- E.B.Stone and Sons Inc
- Biolchim SPA(J.M. Huber Corporation)
- Sustane Natural Fertilizer Inc.
- Fertikal NV
- Nature Safe(Darling Ingredients Inc.)
- California Organic Fertilizers Inc.(Wilbur-Ellis Agribusiness)
- BioFert Manufacturing Inc.(Excel Industries Ltd)
- Indogulf BioAg LLC
- Midwestern BioAg
- True Organic Products Inc.
- The Espoma Company

