
|
市場調査レポート
商品コード
1693516
肥料:市場シェア分析、産業動向・統計、成長予測(2025年~2030年)Fertilizers - Market Share Analysis, Industry Trends & Statistics, Growth Forecasts (2025 - 2030) |
||||||
カスタマイズ可能
適宜更新あり
|
|||||||
| 肥料:市場シェア分析、産業動向・統計、成長予測(2025年~2030年) |
|
出版日: 2025年03月18日
発行: Mordor Intelligence
ページ情報: 英文 465 Pages
納期: 2~3営業日
|

全表示
- 概要
- 目次
概要
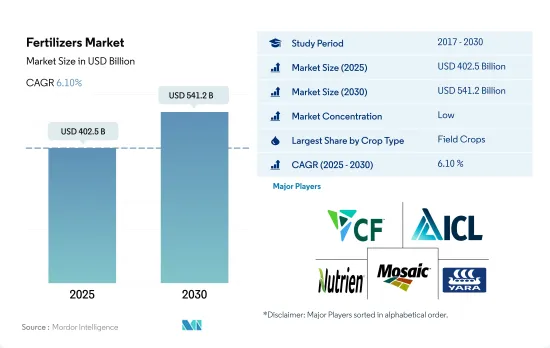
肥料市場規模は2025年に4,025億米ドルと推定・予測され、2030年には5,412億米ドルに達し、予測期間(2025-2030年)のCAGRは6.10%で成長すると予測されます。
農業面積の減少が肥料需要を増大させ、肥料市場を牽引すると予想される
- 2022年には畑作物が世界の肥料市場の約82.1%を占め、約3,539億米ドルとなりました。畑作物の生産は世界的に支配的で、世界の農地の95.0%以上が畑作物の栽培下にあります。米、小麦、トウモロコシが世界的に生産されている主要な畑作作物であり、これら3作物で世界の農地の約38.0%を占めています。
- 園芸作物は、世界の肥料市場全体の約15.0%を占めています。園芸作物の生産は、発展途上国、特にアジア太平洋諸国が支配的です。世界の園芸用肥料市場におけるアジア太平洋地域の優位性は、主に世界の園芸栽培面積の約73.0%(約1億3,766万ヘクタール)を占めていることによる。
- 芝・観葉植物分野は最も小さい肥料市場であり、次いで園芸作物です。2022年には、芝・観賞用分野は世界の肥料市場の約2.4%を占め、約104億2,000万米ドルでした。芝・観賞用肥料市場は細分化された市場です。しかし、北米や欧州のような新興国市場は、アジア太平洋や南米に比べて大きなシェアを占めています。
- アジア太平洋は、畑作と園芸作物の栽培で世界的に優位を占めています。アジア太平洋の肥料市場は急成長しています。欧州は第2位の肥料市場であり、アジア太平洋がそれに続きます。多くの地域で都市化が進み、農業面積全体が減少していることが肥料需要を増大させており、2023年から2030年にかけて肥料市場を牽引すると予想されています。
アジア太平洋が世界の肥料市場を独占している
- 世界の肥料市場は調査期間中安定した成長率を示し、2022年には4,290億米ドルを記録しました。
- アジア太平洋は2022年に44.8%の最大シェアを占め、欧州と南米がこれに続きます。USDAによると、中国はこの地域および世界最大の肥料生産・輸出国であり、世界の肥料生産量の25%を占めています。中国の肥料市場は2022年に703億米ドル、消費量は9,420万トンと推定されます。
- 北米は2022年の世界肥料市場の17.8%を占める。北米では、米国とカナダが肥料市場の金額と数量の90.0%以上を占めています。北米にはリン酸とカリの資源があるが、窒素肥料の半分以上とカリの85.0%以上を海外から輸入しています。
- 2022年の世界の肥料市場の15.1%は欧州が占めています。フランスは欧州最大の肥料消費国のひとつであり、2022年末には全体の20.1%のシェアが見込まれています。市場規模は2022年末までに90億米ドルに達すると予想され、前年比成長率は5.8%です。先進的な栽培方法の採用により、特殊肥料の使用量も増加します。
- 2022年の市場シェアは南米が11.2%を占めました。畑作物が南米の肥料市場を独占し、2022年の市場シェアの95%を占めました。南米で栽培されている上位3作物は、大豆、トウモロコシ、サトウキビです。
- 畑作物の栽培が増加し、それに伴い肥料の需要も増加していることから、市場は2023年から2030年にかけて成長すると予測されています。
世界の肥料市場動向
増大する食糧需要を満たすための農業への圧力の高まりにより、畑作物の栽培面積が増加する見込み
- 世界の農業セクターは多くの課題に直面しています。国連によると、世界人口は2050年までに90億人を超える可能性があります。この人口増加は、すでに労働力不足と都市化の進展による農地の縮小で生産高が減少している農業に過重な負担をかける可能性があります。国連食糧農業機関によると、2050年までに世界人口の70%が都市に住むようになると予想されています。世界的に耕地が減少しているため、農家は作物の収穫量を増やすために、より多くの肥料を利用する必要があります。
- アジア太平洋は世界最大の農産物生産地です。農業はこの地域の経済にとって不可欠であり、全労働人口の約20%を雇用しています。畑作物の栽培がこの地域を支配しており、地域全体の作物栽培面積の約95%以上を占めています。米、小麦、トウモロコシがこの地域で生産される主要な畑作物で、2022年の総栽培面積の約24.3%を占める。
- 北米は世界第2位の耕作可能地域です。その農場では、畑作物を中心に多様な作物が栽培されています。特に、トウモロコシ、綿花、米、大豆、小麦は、米国農務省が強調しているように、著名な畑作物です。2022年、米国は北米の作物栽培面積の46.2%を占めていました。しかし、同国は2017年から2019年にかけて作物栽培面積の大幅な減少を目の当たりにしたが、これは主にテキサスやヒューストンのような地域で大洪水を引き起こした悪環境のためです。
畑作物における一次養分の窒素、カリウム、リンの世界平均施用量は164.31 kg/ha
- トウモロコシ、菜種、綿花、ソルガム、米、小麦、大豆は、世界的に主要な養分集約型作物のひとつです。2022年のこれらの作物の平均施用量は、トウモロコシ:230.57 kg/ha、菜種:255.75 kg/ha、綿花:172.70 kg/ha、ソルガム:158.46 kg/ha、米:154.49 kg/ha、小麦:135.35 kg/ha、大豆:120.97 kg/haでした。一次栄養素は、植物の必須代謝プロセスを支え、細胞、細胞膜、葉緑素などの主要組織の形成に寄与するため、作物にとって不可欠です。特に、リンは高品質な作物の栽培に不可欠であり、カリウムは植物の成長に必要な酵素の活性化に極めて重要な役割を果たしています。
- 世界規模では、畑作物の窒素、カリウム、リンの平均施用量は164.31kg/haです。窒素は最も広く使用されている元肥として際立っており、2022年の施用量は224.6 kg/haです。カリ肥料は150.3 kg/haでこれに続き、リンは117.9 kg/haで第3位です。
- 2022年の窒素施用量は菜種が347.4 kg/haで最も多く、リン施用量はトウモロコシが156.3 kg/haでトップでした。カリウム施用ではキャノーラが248.6 kg/haでトップでした。
- 畑作物の栽培は世界的に増加傾向にあり、特に南米とアジア太平洋で顕著です。これらの地域は肥料の主要市場として台頭してきています。欧州や北米のような先進地域は、栄養不足に悩む地域とともに、その効能から特殊肥料の採用を増やしています。これらの動向は、2023年から2030年にかけての一次栄養肥料市場を促進するものと思われます。
肥料産業の概要
肥料市場は細分化されており、上位5社で14.27%を占めています。この市場の主要企業は以下の通りです。 CF Industries Holdings, Inc., ICL Group Ltd, Nutrien Ltd., The Mosaic Company and Yara International ASA(アルファベット順)
その他の特典
- エクセル形式の市場予測(ME)シート
- 3ヶ月のアナリストサポート
目次
第1章 エグゼクティブサマリーと主な調査結果
第2章 レポートのオファー
第3章 イントロダクション
- 調査の前提条件と市場定義
- 調査範囲
- 調査手法
第4章 主要産業動向
- 主要作物の作付面積
- 畑作物
- 園芸作物
- 平均養分施用率
- 微量栄養素
- 畑作物
- 園芸作物
- 一次栄養素
- 畑作物
- 園芸作物
- 二次多量栄養素
- 畑作物
- 園芸作物
- 微量栄養素
- 灌漑農地
- 規制の枠組み
- バリューチェーンと流通チャネル分析
第5章 市場セグメンテーション
- タイプ
- 複合型
- ストレート
- 微量栄養素
- ホウ素
- 銅
- 鉄
- マンガン
- モリブデン
- 亜鉛
- その他
- 窒素
- 硝酸アンモニウム
- 無水アンモニア
- 尿素
- その他
- リン酸
- DAP
- MAP
- SSP
- TSP
- その他
- カリウム
- MoP
- SoP
- その他
- 二次栄養素
- カルシウム
- マグネシウム
- 硫黄
- 形態
- 従来型
- 特殊
- CRF
- 液体肥料
- SRF
- 水溶性
- 施肥モード
- 施肥
- 葉面散布
- 土壌
- 作物タイプ
- 畑作物
- 園芸作物
- 芝・観賞用
- 地域
- アジア太平洋
- オーストラリア
- バングラデシュ
- 中国
- インド
- インドネシア
- 日本
- パキスタン
- フィリピン
- タイ
- ベトナム
- その他アジア太平洋地域
- 欧州
- フランス
- ドイツ
- イタリア
- オランダ
- ロシア
- スペイン
- ウクライナ
- 英国
- その他欧州
- 中東・アフリカ
- ナイジェリア
- サウジアラビア
- 南アフリカ
- トルコ
- その他中東とアフリカ
- 北米
- カナダ
- メキシコ
- 米国
- その他北米地域
- 南米
- アルゼンチン
- ブラジル
- その他南米
- アジア太平洋
第6章 競合情勢
- 主要な戦略動向
- 市場シェア分析
- 企業情勢
- 企業プロファイル
- CF Industries Holdings, Inc.
- Coromandel International Ltd.
- Grupa Azoty S.A.(Compo Expert)
- Haifa Group
- ICL Group Ltd
- Indian Farmers Fertiliser Cooperative Limited
- Nutrien Ltd.
- Sociedad Quimica y Minera de Chile SA
- The Mosaic Company
- Yara International ASA
第7章 CEOへの主な戦略的質問
第8章 付録
- 世界概要
- 概要
- ファイブフォース分析フレームワーク
- 世界のバリューチェーン分析
- 市場力学(DROs)
- 情報源と参考文献
- 図表一覧
- 主要洞察
- データパック
- 用語集
目次
Product Code: 92580
The Fertilizers Market size is estimated at 402.5 billion USD in 2025, and is expected to reach 541.2 billion USD by 2030, growing at a CAGR of 6.10% during the forecast period (2025-2030).
Decreasing agricultural area is increasing the demand for fertilizers and is expected to drive the fertilizer market
- In 2022, field crops dominated the global fertilizers market, accounting for about 82.1% of the market value of the global fertilizer market, at about USD 353.9 billion. Field crop production is dominant worldwide, and more than 95.0% of the agricultural land in the world is under field crop cultivation. Rice, wheat, and corn are the major field crops produced globally, and these three crops account for about 38.0% of the global agricultural land.
- Horticultural crops account for about 15.0% of the total fertilizer market value worldwide. Horticultural crop production is dominant in developing countries, particularly in Asia-Pacific. Asia-Pacific's dominance in the global horticultural fertilizer market is primarily due to the presence of about 73.0% of the global horticultural cultivation area, which is about 137.66 million hectares of land under horticulture cultivation.
- The turf and ornamentals segment is the smallest fertilizer market, followed by horticultural crops. In 2022, the turf and ornamentals segment accounted for about 2.4% of the market value of the global fertilizer market, at about USD 10.42 billion. The turf and ornamental fertilizer market is a fragmented market. However, developed regions like North America and Europe occupy a major market share compared to Asia-Pacific and South America.
- Asia-Pacific dominates in growing both field and horticultural crops worldwide. The Asia-Pacific fertilizer market is growing at a fast rate. Europe is the second-largest fertilizer market, followed by Asia-Pacific. The increasing urbanization in many regions and the decreasing overall agricultural area are increasing the demand for fertilizers and are expected to drive the fertilizer market between 2023 and 2030.
Asia Pacific is dominating the global fertilizer market
- The global fertilizer market grew at a stable rate during the study period, registering a value of USD 429.0 billion in 2022.
- Asia-Pacific occupied the largest share of 44.8% in 2022, followed by Europe and South America. China is the largest producer and exporter of fertilizers in the region and the world, contributing 25% to global fertilizer production, according to the USDA. The Chinese fertilizer market is estimated to be valued at USD 70.3 billion in 2022, with a volume consumption of 94.2 million metric tons.
- North America accounted for 17.8% of the global fertilizer market in 2022. In North America, the United States and Canada constitute more than 90.0% of the fertilizer market's value and volume. Although North America has phosphate and potash resources, the region is a net importer of more than half of its nitrogenous fertilizers and over 85.0% of its potash from international sources.
- Europe accounted for 15.1% of the global fertilizer market in 2022. France is one of the largest fertilizer-consuming countries in Europe, with an expected overall share of 20.1% by the end of 2022. The market value is expected to reach USD 9 billion by the end of 2022, with a 5.8% y-o-y growth rate. The adoption of advanced cultivation methods will also increase the usage of specialty fertilizers.
- South America accounted for 11.2% of the market share in 2022. Field crops dominated the South American fertilizer market and accounted for 95% of the market share in 2022. The top three crops grown in South America are soybean, corn, and sugarcane.
- With the increasing cultivation of field crops, along with a subsequently increased demand for fertilizers, the market is anticipated to grow between 2023 and 2030.
Global Fertilizers Market Trends
The rising pressure on the agriculture industry to meet the growing demand for food is expected to increase the area under field crop cultivation
- The global agricultural sector is facing many challenges. According to the UN, the world population may exceed 9 billion by 2050. This population growth may overburden the agricultural industry, which is already experiencing an output loss due to a lack of laborers and the shrinkage of agricultural fields caused by rising urbanization. According to the Food and Agriculture Organization, 70% of the global population is expected to live in cities by 2050. Due to the global loss of arable land, farmers now need to utilize more fertilizers to increase crop yields.
- Asia-Pacific is the world's largest producer of agricultural products. Agriculture is critical to the region's economy, as it employs about 20% of the total available workforce. Field crop cultivation dominates the region, accounting for about more than 95% of the total crop area in the region. Rice, wheat, and corn are the major field crops produced in the region, together accounting for about 24.3% of the total crop area in 2022.
- North America ranks as the second-largest arable region globally. Its farms cultivate a diverse range of crops, with a focus on field crops. Notably, corn, cotton, rice, soybean, and wheat are the prominent field crops, as highlighted by the USDA. In 2022, the United States commanded 46.2% of North America's crop cultivation area. However, the country witnessed a significant drop in crop acreage between 2017 and 2019, primarily due to adverse environmental conditions, leading to severe flooding in regions like Texas and Houston.
The global average application rate of primary nutrient nitrogen, potassium, and phosphorus in field crops is 164.31 kg/ha
- Corn, rapeseed, cotton, sorghum, rice, wheat, and soybean are among the primary nutrient-intensive crops globally. In 2022, the average application rates for these crops were as follows: corn - 230.57 kg/ha, rapeseed - 255.75 kg/ha, cotton - 172.70 kg/ha, sorghum - 158.46 kg/ha, rice - 154.49 kg/ha, wheat - 135.35 kg/ha, and soybean - 120.97 kg/ha. Primary nutrients are vital for crops as they support essential plant metabolic processes and contribute to the formation of key tissues like cells, cell membranes, and chlorophyll. Notably, phosphorus is crucial for cultivating high-quality crops, while potassium plays a pivotal role in activating enzymes necessary for plant growth.
- On a global scale, field crops have an average application rate of 164.31 kg/ha for nitrogen, potassium, and phosphorus. Nitrogen stands out as the most widely used primary nutrient fertilizer, with an application rate of 224.6 kg/ha in 2022. Potassic fertilizers follow, with an application rate of 150.3 kg/ha, and phosphorus ranks third, with an application rate of 117.9 kg/ha.
- In 2022, rapeseed had the highest nitrogen application rate at 347.4 kg/ha, while corn led in phosphorus application at 156.3 kg/ha. Canola took the lead in potassium application, with a rate of 248.6 kg/ha.
- Field crop cultivation is on the rise globally, particularly in South America and Asia-Pacific. These regions are emerging as key markets for fertilizers. Developed regions like Europe and North America, along with areas grappling with nutrient deficiencies, are increasingly adopting specialty fertilizers for their efficacy. These trends are poised to propel the primary nutrient fertilizers market during 2023-2030.
Fertilizers Industry Overview
The Fertilizers Market is fragmented, with the top five companies occupying 14.27%. The major players in this market are CF Industries Holdings, Inc., ICL Group Ltd, Nutrien Ltd., The Mosaic Company and Yara International ASA (sorted alphabetically).
Additional Benefits:
- The market estimate (ME) sheet in Excel format
- 3 months of analyst support
TABLE OF CONTENTS
1 EXECUTIVE SUMMARY & KEY FINDINGS
2 REPORT OFFERS
3 INTRODUCTION
- 3.1 Study Assumptions & Market Definition
- 3.2 Scope of the Study
- 3.3 Research Methodology
4 KEY INDUSTRY TRENDS
- 4.1 Acreage Of Major Crop Types
- 4.1.1 Field Crops
- 4.1.2 Horticultural Crops
- 4.2 Average Nutrient Application Rates
- 4.2.1 Micronutrients
- 4.2.1.1 Field Crops
- 4.2.1.2 Horticultural Crops
- 4.2.2 Primary Nutrients
- 4.2.2.1 Field Crops
- 4.2.2.2 Horticultural Crops
- 4.2.3 Secondary Macronutrients
- 4.2.3.1 Field Crops
- 4.2.3.2 Horticultural Crops
- 4.2.1 Micronutrients
- 4.3 Agricultural Land Equipped For Irrigation
- 4.4 Regulatory Framework
- 4.5 Value Chain & Distribution Channel Analysis
5 MARKET SEGMENTATION (includes market size in Value in USD and Volume, Forecasts up to 2030 and analysis of growth prospects)
- 5.1 Type
- 5.1.1 Complex
- 5.1.2 Straight
- 5.1.2.1 Micronutrients
- 5.1.2.1.1 Boron
- 5.1.2.1.2 Copper
- 5.1.2.1.3 Iron
- 5.1.2.1.4 Manganese
- 5.1.2.1.5 Molybdenum
- 5.1.2.1.6 Zinc
- 5.1.2.1.7 Others
- 5.1.2.2 Nitrogenous
- 5.1.2.2.1 Ammonium Nitrate
- 5.1.2.2.2 Anhydrous Ammonia
- 5.1.2.2.3 Urea
- 5.1.2.2.4 Others
- 5.1.2.3 Phosphatic
- 5.1.2.3.1 DAP
- 5.1.2.3.2 MAP
- 5.1.2.3.3 SSP
- 5.1.2.3.4 TSP
- 5.1.2.3.5 Others
- 5.1.2.4 Potassic
- 5.1.2.4.1 MoP
- 5.1.2.4.2 SoP
- 5.1.2.4.3 Others
- 5.1.2.5 Secondary Macronutrients
- 5.1.2.5.1 Calcium
- 5.1.2.5.2 Magnesium
- 5.1.2.5.3 Sulfur
- 5.2 Form
- 5.2.1 Conventional
- 5.2.2 Speciality
- 5.2.2.1 CRF
- 5.2.2.2 Liquid Fertilizer
- 5.2.2.3 SRF
- 5.2.2.4 Water Soluble
- 5.3 Application Mode
- 5.3.1 Fertigation
- 5.3.2 Foliar
- 5.3.3 Soil
- 5.4 Crop Type
- 5.4.1 Field Crops
- 5.4.2 Horticultural Crops
- 5.4.3 Turf & Ornamental
- 5.5 Region
- 5.5.1 Asia-Pacific
- 5.5.1.1 Australia
- 5.5.1.2 Bangladesh
- 5.5.1.3 China
- 5.5.1.4 India
- 5.5.1.5 Indonesia
- 5.5.1.6 Japan
- 5.5.1.7 Pakistan
- 5.5.1.8 Philippines
- 5.5.1.9 Thailand
- 5.5.1.10 Vietnam
- 5.5.1.11 Rest of Asia-Pacific
- 5.5.2 Europe
- 5.5.2.1 France
- 5.5.2.2 Germany
- 5.5.2.3 Italy
- 5.5.2.4 Netherlands
- 5.5.2.5 Russia
- 5.5.2.6 Spain
- 5.5.2.7 Ukraine
- 5.5.2.8 United Kingdom
- 5.5.2.9 Rest of Europe
- 5.5.3 Middle East & Africa
- 5.5.3.1 Nigeria
- 5.5.3.2 Saudi Arabia
- 5.5.3.3 South Africa
- 5.5.3.4 Turkey
- 5.5.3.5 Rest of Middle East & Africa
- 5.5.4 North America
- 5.5.4.1 Canada
- 5.5.4.2 Mexico
- 5.5.4.3 United States
- 5.5.4.4 Rest of North America
- 5.5.5 South America
- 5.5.5.1 Argentina
- 5.5.5.2 Brazil
- 5.5.5.3 Rest of South America
- 5.5.1 Asia-Pacific
6 COMPETITIVE LANDSCAPE
- 6.1 Key Strategic Moves
- 6.2 Market Share Analysis
- 6.3 Company Landscape
- 6.4 Company Profiles
- 6.4.1 CF Industries Holdings, Inc.
- 6.4.2 Coromandel International Ltd.
- 6.4.3 Grupa Azoty S.A. (Compo Expert)
- 6.4.4 Haifa Group
- 6.4.5 ICL Group Ltd
- 6.4.6 Indian Farmers Fertiliser Cooperative Limited
- 6.4.7 Nutrien Ltd.
- 6.4.8 Sociedad Quimica y Minera de Chile SA
- 6.4.9 The Mosaic Company
- 6.4.10 Yara International ASA
7 KEY STRATEGIC QUESTIONS FOR FERTILIZER CEOS
8 APPENDIX
- 8.1 Global Overview
- 8.1.1 Overview
- 8.1.2 Porter's Five Forces Framework
- 8.1.3 Global Value Chain Analysis
- 8.1.4 Market Dynamics (DROs)
- 8.2 Sources & References
- 8.3 List of Tables & Figures
- 8.4 Primary Insights
- 8.5 Data Pack
- 8.6 Glossary of Terms
