
|
市場調査レポート
商品コード
1408869
金:市場シェア分析、産業動向と統計、2024~2029年の成長予測Gold - Market Share Analysis, Industry Trends & Statistics, Growth Forecasts 2024 - 2029 |
||||||
カスタマイズ可能
適宜更新あり
|
|||||||
| 金:市場シェア分析、産業動向と統計、2024~2029年の成長予測 |
|
出版日: 2024年01月04日
発行: Mordor Intelligence
ページ情報: 英文 120 Pages
納期: 2~3営業日
|

全表示
- 概要
- 目次
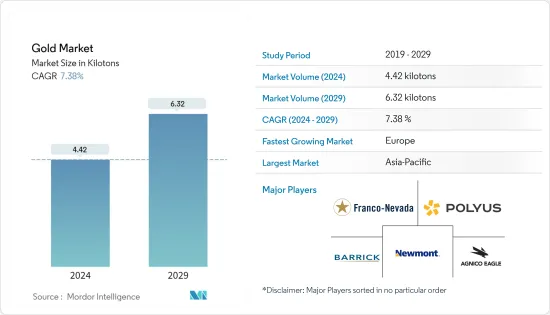
金市場規模は2024年に4.42キロトンと推定され、2029年には6.32キロトンに達し、予測期間(2024-2029年)のCAGRは7.38%で成長すると予測されています。
COVID-19パンデミックは2020年にいくつかの産業に悪影響を与えました。ほとんどの地域で封鎖が行われたため、採掘や加工活動に混乱が生じ、貨物輸送の制限がサプライチェーンを混乱させました。しかし、2021年には状況が回復し始め、市場の成長軌道が回復しました。
市場を牽引する主な要因は、宝飾品、技術、長期貯蓄といった形での金需要です。これは特に発展途上国において顕著であり、金は贅沢品や富を維持する手段として頻繁に利用されています。
しかし、鉱石の品位低下、技術的課題、ストライキなどの要因が世界の金市場の拡大を妨げると予想されます。
とはいえ、中国とインドの婚礼市場セクターは、今後金市場にいくつかの成長機会を与えると予測されています。
アジア太平洋地域は、中国やインドなどの国からの消費が最も多く、世界市場を独占しており、これは今後も変わらないと予想されています。
金市場の動向
宝飾品セグメントが需要を独占
- 金は、宝飾品、電子機器、コイン、メダル、美術品、歯科、医療、貨幣システムなど、さまざまな用途に使用されています。金は導電性、耐食性、生体適合性、可鍛性などの特性により、これらの用途に適しています。がんや関節炎などの特定の医療問題も、放射性同位体や金塩を採用することで金で治療することができます。
- 金は、掘削、発破、または周囲の岩を削ることによって、ロード鉱床から抽出されます。鉱脈は通常、地下深くで発見されます。鉱山労働者は、鉱脈に沿って地中にトンネルを掘って採掘します。その後、技術者がピックと小さな爆薬を使い、周囲の岩石から金鉱石を抽出します。
- 通常、ヒープリーチングの前に、金鉱石は破砕され、凝集されます。高品位の鉱石や、粒径が粗くシアン浸出に耐性のある鉱石から金含有物を抽出するには、さらなる処理が必要です。シアン浸出の前には、粉砕、濃縮、焙煎、加圧酸化などの処理方法が用いられます。
- 予測期間中、宝飾品セクターが金市場で最大のシェアを占めると思われます。金は変色せず、錆びず、腐食しないです。その優れた特徴と輝きにより、宝飾品製造において最も重要な金属です。金は日常的に使用するには柔らかすぎるため、ジュエリーに使用できるように、より丈夫にするために金属の組み合わせで合金化されます。
- ジュエリーの製造には、他にも数多くの種類の金が使われます。ゴールドには様々な色合い、カラット、コーティングがあり、それぞれに特質があります。市場には、イエローゴールド、ホワイトゴールド、ローズゴールドなど、約15種類のゴールドが出回っています。
- さらに、WGCによると、2022年の第3四半期において、宝飾用途の金の需要は581.7トンと推定されています。これは同四半期において、投資、テクノロジー、中央銀行を抑えて最も人気のある目的でした。
- 全体的に、金の宝飾品需要は、予測期間中、世界の金市場の需要を牽引する重要な役割を果たし続けると思われます。
市場を独占するアジア太平洋地域
- アジア太平洋地域は、中国とオーストラリアが牽引する金の最大生産国の一つです。中国は最大の市場シェアを持っており、予測期間中金のトップユーザーでもあります。
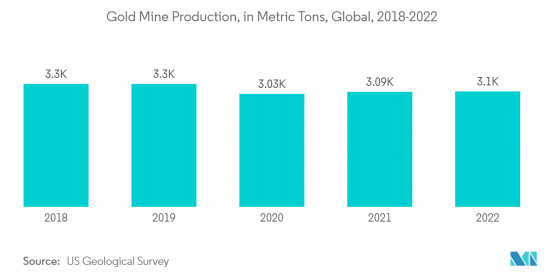
- 米国地質調査所によると、2022年には中国の金鉱山がアジア太平洋地域で最も金を生産しました。オーストラリア、ウズベキスタン、インドネシアがこの地域の他のトップ生産国で、2022年にはそれぞれ320トン、100トン、70トンが採掘されました。
- ワールド・ゴールド・カウンシルによると、中国の鉱山生産量は2022年に13%増の374トンとなり、これは山東省での採掘が2021年の大部分にわたる安全停止から正常に戻ったためです。
- 地域別では、アジア太平洋の鉱山生産量が2022年に最も増加し、中国の生産量の回復に牽引され、2021年に比べ11トン増加しました。
- 2022年の金リサイクル市場はインドが牽引し、リサイクル供給が急増しました。インドが最大の市場である南アジア地域では、リサイクル供給量が前年同期比で40%近く増加し、前四半期比では約60%増加しました。
- また、2022年(55日)に比べ、2023年(67日)は結婚式の吉日が増えることも、ゴールドジュエリーの需要に拍車をかけるでしょう。
- 金融の世界では、金は最も人気のある貴金属です。WGCによると、1971年1月から2022年12月までの金の平均年間リターンは7.78%で、平均年間リターンが8.3%であったコモディティを引き離しています。金投資の収益率は2002年から2022年まで大きく変動しましたが、調査した年の大半でプラスの収益をもたらしました。2022年には、投資としての金のリターンは約0.44%でした。多くの人々が株式市場に対するヘッジとして金に投資しようとしており、金の需要は高まると思われます。
- したがって、上記のようなすべての要因は、予測期間中、アジア太平洋地域における金市場の需要促進に貢献すると予測されます。
金産業の概要
金市場は部分的に断片化されており、市場には少数の大手プレーヤーと多数の小規模プレーヤーが存在します。調査市場の主要企業(順不同)には、Newmont Corporation、Barrick Gold Corporation、FRANCO-NEVADA CORPORATION、PJSC Polyus、Agnico Eagle Mines Limitedなどが含まれます。
その他の特典:
- エクセル形式の市場予測(ME)シート
- 3ヶ月間のアナリスト・サポート
目次
第1章 イントロダクション
- 調査の前提条件
- 調査範囲
第2章 調査手法
第3章 エグゼクティブサマリー
第4章 市場力学
- 促進要因
- 宝飾品および長期貯蓄としての金需要
- ハイエンド・エレクトロニクス・アプリケーションにおける消費の増加
- その他の促進要因
- 抑制要因
- 鉱石品位の低下とその他の技術的課題
- その他の阻害要因
- 産業バリューチェーン分析
- ポーターのファイブフォース分析
- 供給企業の交渉力
- 買い手の交渉力
- 新規参入業者の脅威
- 代替品の脅威
- 競合の程度
第5章 市場セグメンテーション(市場規模)
- タイプ別
- 合金金
- 層状金
- 用途別
- 宝飾品
- 電子機器
- 賞とステータス・シンボル
- その他の用途(歯科、航空宇宙など)
- 地域
- 生産分析
- 米国
- オーストラリア
- ブラジル
- ブルキナファソ
- カナダ
- 中国
- コロンビア
- ガーナ
- インドネシア
- カザフスタン
- マリ
- メキシコ
- パプアニューギニア
- ペルー
- ロシア
- 南アフリカ
- スーダン
- タンザニア
- ウズベキスタン
- その他の国
- 消費分析
- アジア太平洋
- 中国
- インド
- 日本
- 韓国
- その他アジア太平洋地域
- 北米
- 米国
- カナダ
- メキシコ
- 欧州
- ドイツ
- 英国
- イタリア
- フランス
- その他欧州
- 南米
- ブラジル
- アルゼンチン
- その他南米
- 中東・アフリカ
- サウジアラビア
- 南アフリカ
- その他中東とアフリカ
- 生産分析
第6章 競合情勢
- M&A、合弁事業、提携、協定
- 市場シェア(%)**/ランキング分析
- 主要企業の戦略
- 企業プロファイル
- Agnico Eagle Mines Limited
- Barrick Gold Corporation
- FRANCO-NEVADA CORPORATION
- FURUKAWA CO.,LTD
- Gabriel Resources Ltd.
- Harmony Gold Mining Company Limited
- Jinshan Gold
- Johnson Matthey
- Kinross Gold Corporation
- New Gold Inc.
- Newmont Corporation
- PJSC Polyus
- Tertiary Minerals
- Vedanta Resources Limited
- Zijin Mining Group
第7章 市場機会と今後の動向
- 外貨準備高を増やすための金投資の増加
- その他の機会
The Gold Market size is estimated at 4.42 kilotons in 2024, and is expected to reach 6.32 kilotons by 2029, growing at a CAGR of 7.38% during the forecast period (2024-2029).
The COVID-19 pandemic affected several industries negatively in 2020. The lockdown in most regions caused disruptions in mining and processing activities, and restrictions in freight transportation disturbed the supply chain. However, the conditions started recovering in 2021, restoring the market's growth trajectory.
The major factor driving the market is the demand for gold in the form of jewelry, technology, and long-term savings. This is especially true in developing nations, where gold is frequently utilized as a luxury item and a way of preserving wealth.
However, factors like declining ore grades, technical challenges, and strikes are expected to hinder global gold market expansion.
Nevertheless, the wedding market sector in China and India is projected to give several growth opportunities for the gold market segment in the future.
The Asia-Pacific region dominated the market globally, with the largest consumption coming from countries such as China and India, and this is expected to remain the same in the future.
Gold Market Trends
Jewelry Segment to Dominate the Demand
- Gold is used in a variety of applications, including jewelry, electronics, coins, medals, art, dentistry, medicine, and monetary systems. Gold is suitable for these applications due to properties such as conductivity, corrosion resistance, biocompatibility, and malleability. Certain medical problems, such as cancer and arthritis, can also be treated with gold by adopting radioactive isotopes or gold salts.
- Gold is extracted from lode deposits by drilling, blasting, or shoveling the surrounding rock. Lode deposits are typically found deep underground. Miners mine underground by digging tunnels through the earth following the vein. Technicians then use picks and tiny explosives to extract the gold ore from the surrounding rock.
- Typically, before heap leaching, the gold ore is crushed and agglomerated. Further processing is required to extract the gold contents from high-grade ores and ores resistant to cyanide leaching at coarse particle sizes. Before cyanidation, processing methods such as grinding, concentration, roasting, and pressure oxidation may be used.
- During the forecast period, the jewelry sector is likely to have the largest share of the gold market. Gold does not tarnish, rust, or corrode. It is the most significant metal in jewelry manufacturing due to its excellent features and shine. Since gold is too soft for everyday usage, it is alloyed with a metal combination to make it tougher so that it may be used for jewelry.
- Numerous other varieties of gold are used to produce the jewelry. Gold is available in a variety of hues, karats, and coatings, each with its own set of qualities. On the market, there are around 15 distinct varieties of gold available, including yellow gold, white gold, rose gold, and others.
- Moreover, according to the WGC, in the third quarter of 2022, the demand for gold for jewelry applications was estimated to be 581.7 metric tons. This was the most popular purpose in that quarter, ahead of investment, technology, and central banks.
- Overall, the gold jewelry demand is likely to continue playing an instrumental role in driving the global demand for the gold market over the forecast period.
Asia-Pacific Region to Dominate the Market
- Asia-Pacific is one of the largest producers of gold, driven by China and Australia. China has the biggest market share and will also be the top gold user over the forecast period.
- According to the U.S. Geological Survey, in 2022, gold mines in China produced the most gold in the Asia-Pacific region. Australia, Uzbekistan, and Indonesia were the other top producers in the region, with 320 metric tons, 100 metric tons, and 70 metric tons mined in 2022, respectively.
- According to the World Gold Council, mine production in China increased by 13% in 2022 to 374 tons as mining in Shandong province returned to normal, following the widespread safety stoppages for most of 2021.
- Region-wise, mine production in Asia-Pacific saw the largest increase in 2022, up by 11 tons compared to 2021, driven by the recovery in China's output.
- India led the gold recycling market in 2022, with sharp increases in recycling supply. The South Asian region, with India being the biggest market, saw recycling supply up nearly 40% year-on-year and about 60% quarter-on-quarter.
- A higher number of auspicious wedding days in the country in 2023 (67 days) as compared to 2022 (55 days) will also add to the demand for gold jewelry.
- In the financial world, gold is the most popular precious metal. According to the WGC, from January 1971 and December 2022, gold had an average annual return of 7.78%, trailing only commodities, which had an average annual return of 8.3%. The rate of return on gold investments varied greatly from 2002 to 2022 but provided positive returns in the majority of the years studied. In 2022, the return on gold as an investment was around 0.44%. Many people are looking to invest in gold as a hedge against equity markets, which will increase its demand.
- Therefore, all such factors mentioned above are projected to contribute to driving demand for the gold market in the Asia-Pacific region over the forecast period.
Gold Industry Overview
The gold market is partially fragmented, with the presence of a few large-sized players and a large number of small players operating in the market. The major players in the studied market (not in any particular order) include Newmont Corporation, Barrick Gold Corporation, FRANCO-NEVADA CORPORATION, PJSC Polyus, and Agnico Eagle Mines Limited, amongst others.
Additional Benefits:
- The market estimate (ME) sheet in Excel format
- 3 months of analyst support
TABLE OF CONTENTS
1 INTRODUCTION
- 1.1 Study Assumptions
- 1.2 Scope of the Study
2 RESEARCH METHODOLOGY
3 EXECUTIVE SUMMARY
4 MARKET DYNAMICS
- 4.1 Drivers
- 4.1.1 Demand for Gold in the form of Jewelry and Long-term Savings
- 4.1.2 Increasing Consumption in High-End Electronics Applications
- 4.1.3 Other Drivers
- 4.2 Restraints
- 4.2.1 Declining Ore Grades and Other Technical Challenges
- 4.2.2 Other Restraints
- 4.3 Industry Value Chain Analysis
- 4.4 Porter's Five Forces Analysis
- 4.4.1 Bargaining Power of Suppliers
- 4.4.2 Bargaining Power of Buyers
- 4.4.3 Threat of New Entrants
- 4.4.4 Threat of Substitute Products and Services
- 4.4.5 Degree of Competition
5 MARKET SEGMENTATION (Market Size in Volume)
- 5.1 By Type
- 5.1.1 Alloyed Gold
- 5.1.2 Layered Gold
- 5.2 Application
- 5.2.1 Jewellery
- 5.2.2 Electronics
- 5.2.3 Awards and Status Symbols
- 5.2.4 Other Applications (Dentistry, Aerospace, etc.)
- 5.3 Geography
- 5.3.1 Production Analysis
- 5.3.1.1 United States
- 5.3.1.2 Australia
- 5.3.1.3 Brazil
- 5.3.1.4 Burkina Faso
- 5.3.1.5 Canada
- 5.3.1.6 China
- 5.3.1.7 Colombia
- 5.3.1.8 Ghana
- 5.3.1.9 Indonesia
- 5.3.1.10 Kazakhstan
- 5.3.1.11 Mali
- 5.3.1.12 Mexico
- 5.3.1.13 Papua New Guinea
- 5.3.1.14 Peru
- 5.3.1.15 Russia
- 5.3.1.16 South Africa
- 5.3.1.17 Sudan
- 5.3.1.18 Tanzania
- 5.3.1.19 Uzbekistan
- 5.3.1.20 Other countries
- 5.3.2 Consumption Analysis
- 5.3.2.1 Asia-Pacific
- 5.3.2.1.1 China
- 5.3.2.1.2 India
- 5.3.2.1.3 Japan
- 5.3.2.1.4 South Korea
- 5.3.2.1.5 Rest of Asia-Pacific
- 5.3.2.2 North America
- 5.3.2.2.1 United States
- 5.3.2.2.2 Canada
- 5.3.2.2.3 Mexico
- 5.3.2.3 Europe
- 5.3.2.3.1 Germany
- 5.3.2.3.2 United Kingdom
- 5.3.2.3.3 Italy
- 5.3.2.3.4 France
- 5.3.2.3.5 Rest of Europe
- 5.3.2.4 South America
- 5.3.2.4.1 Brazil
- 5.3.2.4.2 Argentina
- 5.3.2.4.3 Rest of South America
- 5.3.2.5 Middle East and Africa
- 5.3.2.5.1 Saudi Arabia
- 5.3.2.5.2 South Africa
- 5.3.2.5.3 Rest of Middle East and Africa
- 5.3.1 Production Analysis
6 COMPETITIVE LANDSCAPE
- 6.1 Mergers and Acquisitions, Joint Ventures, Collaborations, and Agreements
- 6.2 Market Share (%) **/Ranking Analysis
- 6.3 Strategies Adopted by Leading Players
- 6.4 Company Profiles
- 6.4.1 Agnico Eagle Mines Limited
- 6.4.2 Barrick Gold Corporation
- 6.4.3 FRANCO-NEVADA CORPORATION
- 6.4.4 FURUKAWA CO.,LTD
- 6.4.5 Gabriel Resources Ltd.
- 6.4.6 Harmony Gold Mining Company Limited
- 6.4.7 Jinshan Gold
- 6.4.8 Johnson Matthey
- 6.4.9 Kinross Gold Corporation
- 6.4.10 New Gold Inc.
- 6.4.11 Newmont Corporation
- 6.4.12 PJSC Polyus
- 6.4.13 Tertiary Minerals
- 6.4.14 Vedanta Resources Limited
- 6.4.15 Zijin Mining Group
7 MARKET OPPORTUNITIES AND FUTURE TRENDS
- 7.1 Rising Investment in Gold to Increase the Forex Reserves
- 7.2 Other Opportunities
