
|
市場調査レポート
商品コード
1910810
硝酸:市場シェア分析、業界動向と統計、成長予測(2026年~2031年)Nitric Acid - Market Share Analysis, Industry Trends & Statistics, Growth Forecasts (2026 - 2031) |
||||||
カスタマイズ可能
適宜更新あり
|
|||||||
| 硝酸:市場シェア分析、業界動向と統計、成長予測(2026年~2031年) |
|
出版日: 2026年01月12日
発行: Mordor Intelligence
ページ情報: 英文 120 Pages
納期: 2~3営業日
|

概要
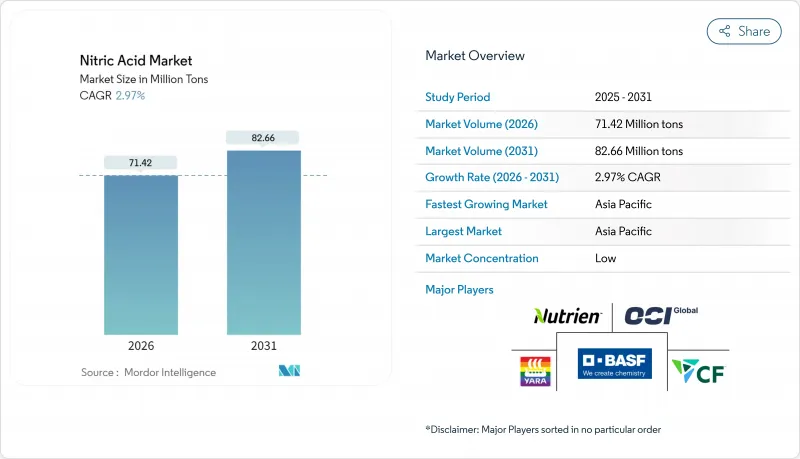
硝酸市場は2025年に6,936万トンと評価され、2026年の7,142万トンから2031年までに8,266万トンに達すると予測されています。
予測期間(2026-2031年)におけるCAGRは2.97%と見込まれます。
低炭素アンモニアへの持続的な投資、爆発物需要の拡大、肥料需要の堅調な伸びが硝酸市場の基盤を支え続けておりますが、環境規制対応コストの上昇とガス価格の変動がコスト構造を再構築しております。欧州ではBAT-AEL基準の強化に伴いグリーン生産手法への移行が急速に進む一方、北米ではエネルギー安全保障強化のためブルーアンモニアプロジェクトを活用しております。炭素回収技術、再生可能水素、先進触媒を早期に統合した企業は、商品価格変動が激化する中で利益率の回復力を高めています。
世界の硝酸市場の動向と展望
欧州全域で低炭素硝酸アンモニウム肥料の需要が急増
欧州の肥料メーカーは、2030年までに水素原料の42%を再生可能とする「再生可能エネルギー指令III」の要件を満たすため、再生可能水素への転換を進めています。グリーン原料の確保に成功した先行企業は供給ショックの影響を受けにくく、スコープ3排出量削減を目指す食品小売チェーンとの販売契約を締結可能です。主要メーカーはこれに対応し、大規模なCCSプロジェクトを推進しており、ヤラの2026年スライスキルCCS施設はスコープ1排出量を大幅に削減すると見込まれています。この転換により、硝酸市場と欧州連合の気候目標との結びつきが深まり、グリーンアンモニア回廊における新たな合弁事業の促進につながっています。
EUの自動車軽量化目標に向けたポリアミド6,6の採用拡大
EUの乗用車CO2排出量規制(95g/km)により、金属から高性能ポリマーへの代替が進展しております。ポリアミド6,6は最大40%の軽量化を実現し、構造強度を損なうことなくEVの航続距離を向上させます。硝酸誘導体であるアジピン酸が主要な前駆体であるため、ポリアミド6,6への移行が進むほど、地域の硝酸需要が増加します。サプライチェーンは高純度グレードに注力し、ポリマーメーカー向け電子グレード硝酸の増産計画が宇部興産株式会社により進められています。自動車ティア1サプライヤーは、より厳格なユーロ7規制に先立ち、一貫した品質と原料の安定供給を確保するため、硝酸メーカーとの長期樹脂購入契約を調整中です。
EUのN2O排出規制強化(BAT-AEL)が設備投資と運用コストを押し上げる
欧州委員会によるLVIC BREF(ベスト利用可能な技術に関する環境基準文書)の改訂作業が進められており、亜酸化窒素排出基準が引き下げられる見込みです。これにより、老朽化した設備における改修または新規排出抑制装置の導入が迫られています。二次触媒システムや三次分解装置の導入には、ライン当たり800万米ドルを超える資本投資が必要となり、中堅プラントの利益率を圧迫する可能性があります。BOCリミテッドのCO2回収・液化プラントのように、統合型CCSや先進的バーナーを備えた事業者は、長期供給契約の入札においてコスト優位性を享受します。この政策環境はプラント閉鎖や資産交換を加速させ、コンプライアンス投資のための財務的余裕を持つトップティア生産者を中心に硝酸市場を統合する方向へと導いています。
セグメント分析
2025年時点で弱硝酸が市場シェアの57.45%を占めており、肥料や中間体用途における汎用性を反映しています。このセグメントは腐食管理コストが低く、生産者は最小限のアップグレードで単一モノプレッシャーループを稼働できる利点があります。欧州が弱酸中和に依存する硝酸塩放出制御肥料を義務付ける中、弱硝酸関連市場規模は着実な拡大が見込まれます。
次に大きなシェアを占める濃硝酸は、爆発物や電子機器の需要増加を背景に、CAGR3.48%で勢いを増しています。高純度ラインの生産能力増強、特に宇部興産株式会社による山口県での拡張は、特殊セグメントのプレミアム獲得を目的としています。発煙硝酸はニッチな分野ながら、航空宇宙推進分野において戦略的に重要な位置を占めています。
硝酸市場の市場セグメンテーションは、濃度(弱硝酸(68%以下)、濃硝酸(68~98%)、発煙/赤発煙(98%超))、エンドユーザー産業(肥料、化学製造、爆発物、航空宇宙、インク、顔料・染料、その他エンドユーザー産業)、地域(アジア太平洋、北米、欧州、南米、中東・アフリカ)によって区分されます。
地域別分析
アジア太平洋地域は2025年に硝酸市場の57.60%を占め、重工業、肥料使用量、電子機器製造の同時成長に伴い、CAGR3.62%で拡大しております。中国は環境検査により旧式設備の触媒アップグレードが推進される中、硝酸系中間体への投資を継続しております。インドのディーパック・ファーティライザーズ社によるダヘジプロジェクトは、年間45万トンの総合生産能力を追加し、同国の自給率向上と純輸入量の削減に貢献しています。
欧州では高エネルギーコストと厳格な排出規制によりシェアが縮小を続けております。BAT-AEL基準の強化により、採算性の低い生産者は設備更新か撤退を迫られ、BASFやYaraなどの統合大手企業による生産集約が進んでおります。北米は豊富なシェールガスと発展中のブルーアンモニア事業が追い風となっております。OCIのボーモント工場は2025年より、低炭素供給ルートを確立し、メキシコ湾岸の硝酸・硝酸塩プラントへ供給を開始します。
南米は構造的に窒素不足が継続しており、ブラジルでは需要の95%を輸入で賄っています。大豆生産者が輸出向けプレミアム認証を追求する中、グリーン肥料の導入は増加傾向にあります。しかしながら、通貨変動やインフラのボトルネックが、硝酸の即時的な生産能力投資を制約しています。
その他の特典:
- エクセル形式の市場予測(ME)シート
- アナリストによる3ヶ月間のサポート
よくあるご質問
目次
第1章 イントロダクション
- 調査の前提条件と市場の定義
- 調査範囲
第2章 調査手法
第3章 エグゼクティブサマリー
第4章 市場情勢
- 市場概要
- 市場促進要因
- 欧州全域における低炭素性硝酸アンモニウム肥料の需要急増
- EU自動車軽量化目標に伴うポリアミド6,6(アジピン酸誘導体)の採用拡大
- インドの硝酸塩系医薬品クラスターにおけるオンサイト弱硝酸プラントに対する政府の優遇措置
- 爆発物製造分野における需要増加
- 市場抑制要因
- EUのBAT-AEL強化によるN2O排出規制の厳格化が設備投資(Capex)と運営費(Opex)を増加させる
- 天然ガス価格の変動がアンモニアから硝酸へのマージンを圧迫
- 硝酸による健康被害
- バリューチェーン分析
- ポーターのファイブフォース
- 供給企業の交渉力
- 買い手の交渉力
- 新規参入業者の脅威
- 代替品の脅威
- 競争企業間の敵対関係
- 貿易フロー分析
- コスト分析
第5章 市場規模と成長予測(金額および数量)
- 分野別
- 弱硝酸(68%以下)
- 濃縮硝酸(68~98%)
- フミング/レッドフミング(98%以上)
- エンドユーザー業界別
- 肥料
- 化学品製造
- 爆発物
- 航空宇宙
- インク、顔料、染料
- その他のエンドユーザー産業(製薬および食品加工)
- 地域別
- アジア太平洋地域
- 中国
- インド
- 日本
- 韓国
- インドネシア
- マレーシア
- ベトナム
- タイ
- その他アジア太平洋地域
- 北米
- 米国
- カナダ
- メキシコ
- 欧州
- ドイツ
- 英国
- フランス
- イタリア
- スペイン
- ロシア
- トルコ
- 北欧諸国
- その他欧州地域
- 南米
- ブラジル
- アルゼンチン
- コロンビア
- その他南米
- 中東・アフリカ
- サウジアラビア
- アラブ首長国連邦
- カタール
- ナイジェリア
- エジプト
- 南アフリカ
- その他の中東・アフリカ
- アジア太平洋地域
第6章 競合情勢
- 市場集中度
- 戦略的動き(合併・買収、合弁事業、生産能力拡張、技術ライセンシング)
- 市場シェア分析
- 企業プロファイル
- Asahi Kasei Corporation
- BASF
- Borealis AG
- CF Industries Holdings, Inc.
- DFPCL
- ENAEX
- EuroChem Group
- Gujarat Narmada Valley Fertilizers & Chemicals Limited
- Hanwha Group
- TKG HUCHEMS
- INEOS
- Incitec Pivot Fertilisers Pty Ltd
- LSB Industries
- MAXAMCORP HOLDING, SL
- Mitsubishi Chemical Group Corporation
- Nutrien
- OCI Global
- Orica Limited
- Sasol
- China Petrochemical Corporation
- Sumitomo Chemical Co., Ltd.
- Yara
- UBE Corporation

