
|
市場調査レポート
商品コード
1910804
蛍石:市場シェア分析、業界動向と統計、成長予測(2026年~2031年)Fluorspar - Market Share Analysis, Industry Trends & Statistics, Growth Forecasts (2026 - 2031) |
||||||
カスタマイズ可能
適宜更新あり
|
|||||||
| 蛍石:市場シェア分析、業界動向と統計、成長予測(2026年~2031年) |
|
出版日: 2026年01月12日
発行: Mordor Intelligence
ページ情報: 英文 120 Pages
納期: 2~3営業日
|

概要
蛍石市場は、2025年の801万トンから2026年には823万トンへ成長し、2026年から2031年にかけてCAGR2.77%で推移し、2031年までに944万トンに達すると予測されております。
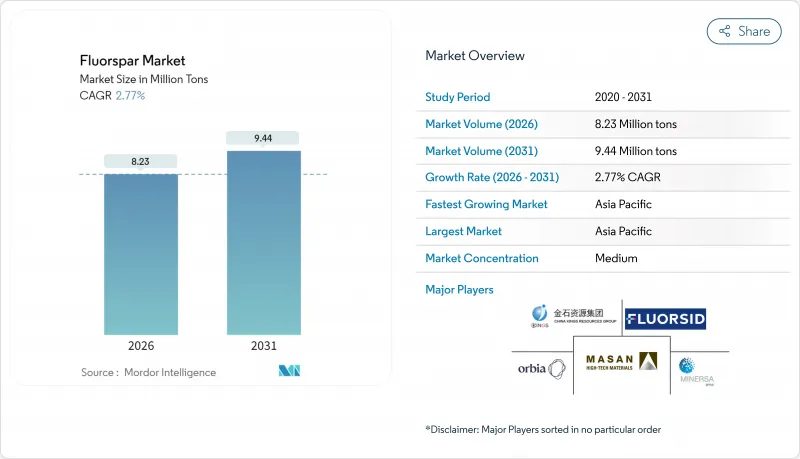
安定した数量の伸びは、フッ化水素酸の生産、鉄鋼・アルミニウム冶金、フッ素樹脂製造における本鉱物の確固たる用途を反映しており、バッテリー、半導体、冷媒のサプライチェーンから新たな需要が生まれている状況下でも同様です。中国は依然として主要供給国であり、採掘量の60%以上を占めております。同国の輸出規制姿勢を受けて、エンドユーザーは調達先の分散化、備蓄、長期供給契約の締結を進めております。
世界の蛍石市場の動向と洞察
フッ素化学品需要の急増が市場拡大を牽引
地球温暖化係数が低い冷媒がフッ化水素酸消費量の急増を支えており、2025年第2四半期におけるケムアーズ社のサーマル・スペシャライズドソリューション部門の売上高が前期比25%増加したことがその顕著な例です。米国AIM法のスケジュールにより高GWPフロン代替が加速し、並行するEUフロン規制も欧州全域で同様の導入曲線を推進しています。電気自動車1台あたり約30kgの酸用蛍石相当量がバインダー・冷却剤・電線被覆に使用されるため、電池市場の成長が蛍石の大量需要に直結します。燃料電池膜や水素インフラ向けフッ素樹脂用途が二次的な需要牽引要因となります。プロセス革新も注目に値します。韓国研究チームは先進的な電気化学的経路により、フルオロエーテルの収率を12~16パーセントポイント向上させました。これは完成フッ素化学品1トン当たりの原料鉱石使用量削減の可能性を示唆しています。
新興市場における鉄鋼・アルミニウム生産の急増
インドの粗鋼生産量は2024-25年度に1億5,196万7,000トンと前年比5.3%増となり、国内消費も増加したため、スラグ調整および脱硫用の冶金用蛍石の調達量が増加しました。湾岸協力会議(GCC)加盟国の製錬所は、サウジアラビアの「ビジョン2030」に基づき、低コストのエネルギーを活用してアルミニウム生産量とそれに伴うフッ化アルミニウムの需要を拡大し、生産能力の増強を進めています。循環経済の進展も同様に重要です。ScienceDirectの研究では、廃棄された氷晶石から高純度のAlF3を85.6%抽出することに成功しており、金属リサイクルネットワークが整備された地域では、二次原料が一次酸鉱石の需要の15~20%を代替できることを示しています。
環境規制により鉱業のコンプライアンスコストが増加
米国環境保護庁(EPA)の40 CFR Part 436により、浮選法を用いた蛍石工場に対し廃液ゼロ排出基準が適用され、事業者はペースト濃縮装置、フィルタープレス、電気脱水システムに1,000万~1,500万米ドルの投資を余儀なくされています。中国の2024年安全キャンペーンにより、複数の小規模鉱山の許可が取り消され、少なくとも12万トンの生産能力が失われ、世界の供給が逼迫しています。モンゴルの業界では児童労働問題が懸念されており、OECD加盟国の買い手はサプライチェーンの監査を義務付けられ、場合によっては認証プレミアムを支払う必要があります。一方、新たに確定したPFAS飲料水基準(PFOAおよびPFOS各4ppt)により、帯水層付近のフッ素化学工場における監視義務が拡大しています。
セグメント分析
2025年、酸級原料は蛍石市場の61.36%のシェアを維持しました。これは、フッ化水素酸合成に不可欠な97%以上のCaF2規格に支えられたものです。この高純度基盤は、冷凍、アルミニウム精錬、半導体エッチング剤分野に供給する化学メーカー向けの蛍石市場規模を支えています。研磨用グレードは、レーザー、リソグラフィー、宇宙搭載センサーシステムにおける光学レンズ需要を背景に、CAGR4.23%で拡大しています。
製法改良により品位の柔軟性が拡大しております。中国湖南省における新たな浮選回路の導入により、低品位鉱石のCaF2含有率が70%から95%に向上し、実質的にセラミックグレード資源を酸用蛍石原料へ転換可能となりました。同様に、メキシコ・ドゥランゴ鉱山では加圧浸出と溶媒抽出により回収率が向上しています。2031年までに北米における酸用グレードの供給増加により、世界の蛍石貿易における中国のシェアは54%から47%に縮小し、蛍石市場は緩やかに多様化すると見込まれます。
蛍石レポートは、品位別(酸用級、陶磁器用級、冶金用級、光学用級、宝石用級)、品種別(アントゾナイト、ブルージョン、クロロファン、イットロセリテなど)、用途(冶金用途、セラミックス用途、化学用途、その他用途)、地域(アジア太平洋、北米、欧州、南米、中東・アフリカ)ごとに分類されています。市場予測は数量(トン)単位で提供されます。
地域別分析
アジア太平洋地域は2025年の蛍石市場量の73.88%を占め、中国の酸用蛍石の優位性とインドの鉄鋼生産能力拡大を背景に、2031年までCAGR2.95%で拡大が見込まれます。日本と韓国は電子機器およびEVサプライチェーン向けに高純度素材を輸入しており、韓国は自国でのフッ素化学品生産を確保するため電気化学的フッ素化技術を推進中です。
北米地域はほぼ完全な輸入依存から部分的な自給自足へと移行中です。ユタ州ロストシープ鉱山は2026年に6万5,000トンの蛍石供給を予定しており、これは米国輸入量の約10%を代替する見込みです。メキシコは同地域の主力供給国であり、2024年には123万トンを出荷、これは米国酸性鉱石輸入量の74%に相当します。カナダのセントローレンス鉱山の再開は、2025年の生産再開後、電池グレードフッ化物の供給リスクをさらに緩和する見込みです。
スペインと南アフリカが地域内原料を供給する一方、ケニアでは現在、国内加工なしの原料輸出が禁止されています。中東諸国は鉱業を経済の柱と位置付けており、サウジアラビアの2024年鉱物法改正では25年間の採掘権が付与され、有望な蛍石鉱床への外国投資が促進されています。
その他の特典:
- エクセル形式の市場予測(ME)シート
- アナリストによる3ヶ月間のサポート
よくあるご質問
目次
第1章 イントロダクション
- 調査の前提条件と市場の定義
- 調査範囲
第2章 調査手法
第3章 エグゼクティブサマリー
第4章 市場情勢
- 市場概要
- 市場促進要因
- フッ素化学品需要の急増(低GWP冷媒およびフッ素樹脂)
- アジアおよび中東・北アフリカ地域における鉄鋼・アルミニウム生産量の増加
- リチウムイオン電池用ギガファクトリーからの電池グレードフッ化アルミニウム需要
- 半導体エッチングガスには超高純度酸スパールが必要です(過小報告)
- 欧米における「重要鉱物」の国内回帰促進策(過小評価されている)
- 市場抑制要因
- 鉱業における環境規制および尾鉱処理規則の厳格化
- 中国の輸出割当変動と輸送ボトルネック(過小報告)
- フッ化ケイ酸由来のHFによる代替(過小報告)
- バリューチェーン分析
- ポーターのファイブフォース
- 新規参入業者の脅威
- 買い手の交渉力
- 供給企業の交渉力
- 代替品の脅威
- 競合の程度
第5章 市場規模と成長予測
- グレード別
- 酸グレード
- セラミックグレード
- 冶金グレード
- 光学グレード
- 研磨用グレード
- 種類別
- アントゾナイト
- ブルージョン
- クロロファン
- イットロセリテ
- イットロフルオライト
- その他の種類
- 用途別
- 冶金
- セラミックス
- 化学品
- その他の用途(光学、ガラス、セメント、コーティング)
- 地域別
- アジア太平洋
- 中国
- インド
- 日本
- 韓国
- マレーシア
- タイ
- インドネシア
- ベトナム
- その他アジア太平洋
- 北米
- 米国
- カナダ
- メキシコ
- 欧州
- ドイツ
- 英国
- フランス
- イタリア
- スペイン
- 北欧諸国
- トルコ
- ロシア
- その他欧州
- 南米
- ブラジル
- アルゼンチン
- コロンビア
- その他南米
- 中東・アフリカ
- サウジアラビア
- アラブ首長国連邦
- カタール
- ナイジェリア
- エジプト
- 南アフリカ
- その他の中東・アフリカ
- アジア太平洋
第6章 競合情勢
- 市場集中度
- 戦略的動向
- 市場シェア(%)/順位分析
- 企業プロファイル
- ARES Strategic Mining Inc.
- Chifeng Sky-Horse Fluorspar Mining Co., Ltd.
- China Kings Resources Group Co., Ltd.
- Erdenes Critical Minerals SOE
- Fluorsid
- Kenya Fluorspar Company Ltd.
- Luoyang Fengrui Fluorine Industry Co., Ltd.
- Masan High-Tech Materials Corporation
- MINERSA GROUP
- Orbia
- Sallies Industrial Minerals
- SepFluor
- Sinochem Group Co., Ltd.
- Steyuan Mineral Resources Group Ltd.
- Yingpeng Chemical Co., Ltd.

