|
|
市場調査レポート
商品コード
1424840
フロー電池市場:製品別、電池タイプ別、材料別、所有者別、用途別、エンドユーザー別、地域別 - 世界予測(2031年まで)Flow Battery Market by Offering (Energy Storage Systems), Battery Type (Vanadium Redox Flow Batteries, Zinc-Bromine Flow Batteries), Material, Ownership, Application, End User (Utilities, Commercial & Industrial), and Geography - Global Forecast to 2031 |
||||||

|
|||||||
カスタマイズ可能
|
|||||||

| フロー電池市場:製品別、電池タイプ別、材料別、所有者別、用途別、エンドユーザー別、地域別 - 世界予測(2031年まで) |
|
出版日: 2024年02月12日
発行: Meticulous Research
ページ情報: 英文 204 Pages
納期: 即納可能
|

全表示
- 概要
- 図表
- 目次
世界のフロー電池市場は、2024年から2031年の予測期間中のCAGRは16.5%で、2031年までに10億3,000万米ドルに達すると予測されています。
フロー電池市場の成長は、主にユーティリティ用途におけるフロー電池の高い需要と再生可能エネルギーへの投資の増加によってもたらされます。しかし、フロー電池システムの開拓における標準化の欠如とフロー電池製造の初期コストの高さがこの市場の成長を抑制しています。
さらに、技術革新とデータセンターにおけるバックアップ電源需要の高まりは、フロー電池市場で事業を展開するプレーヤーに大きな成長機会を提供すると予想されます。しかし、フロー電池の普及率の低下や電池製造用原材料の供給途絶は、この市場の成長を阻害する可能性があります。さらに、フロー電池とサービスとしてのエネルギー貯蔵の進歩は、フロー電池市場の顕著な動向です。
世界のフロー電池市場は、製品、電池タイプ、材料、所有者、所有、用途、エンドユーザーでセグメント分けされています。また、業界の競合他社を評価し、地理的レベルで市場を分析しています。
目次
第1章 市場の定義と範囲
第2章 調査手法
第3章 エグゼクティブサマリー
- 概要
- 市場分析:製品別
- 市場分析:電池タイプ別
- 市場分析:材料別
- 市場分析:所有者別
- 市場分析:用途別
- 市場分析:エンドユーザー別
- 市場分析:地域別
- 競合分析
第4章 市場洞察
- 概要
- 市場成長に影響を与える要因
- 市場成長を支えるユーティリティ用途でのフロー電池の使用拡大
- 再生可能エネルギー分野への投資の増加がフロー電池の需要を押し上げる
- フロー電池システム開拓における標準化の欠如が市場成長を抑制
- 高い製造初期コストがフロー電池の生産に影響
- フロー電池の技術革新が市場プレイヤーの成長機会を生む
- データセンターにおける電源バックアップのニーズの高まりが市場成長機会の創出に期待
- フロー電池の制約が産業界への普及を抑制
- 不安定な原材料供給が引き続き市場プレイヤーの大きな課題に
- 動向
- フロー電池技術の進歩への注目の高まり
- サービスとしてのエネルギー貯蔵(ESaaS)
- 主要な電池タイプの比較概要
- フロー電池に使用される部品と材料
- サプライチェーン分析
- ポーターのファイブフォース分析
第5章 フロー電池市場評価:製品別
- 概要
- エネルギー貯蔵システム
- 電池
- サービス
第6章 フロー電池市場評価:電池タイプ別
- 概要
- バナジウムレドックスフロー電池
- 亜鉛-臭素フロー電池
- 全鉄フロー電池
- その他のフロー電池
第7章 フロー電池市場評価:材料別
- 概要
- バナジウム
- 亜鉛-臭素
- 水素-臭素
- その他の材料
第8章 フロー電池市場評価:所有者別
- 概要
- 電力会社所有
- 第三者所有
- 顧客所有
第9章 フロー電池市場評価:用途別
- 概要
- 負荷シフト
- ピークカット
- 商業用
- 送電・配電
- EV充電
- 住宅
- 周波数調整
- その他の用途
第10章 フロー電池市場評価:エンドユーザー別
- 概要
- ユーティリティ
- 商業・産業
- オフグリッド&マイクログリッド電力
- EV充電ステーション
- 住宅
- その他のエンドユーザー
第11章 フロー電池市場評価:地域別
- 概要
- アジア太平洋
- 中国
- 日本
- インド
- 韓国
- その他アジア太平洋
- 北米
- 米国
- カナダ
- 欧州
- 英国
- ドイツ
- イタリア
- スペイン
- フランス
- その他欧州
- ラテンアメリカ
- 中東・アフリカ
第12章 競合分析
- 概要
- 主要成長戦略
- 競合ベンチマーキング
- 競合ダッシュボード
- 業界リーダー
- 市場差別化要因
- 先行企業
- 新興企業
- 市場シェア分析(2022年)
第13章 企業プロファイル
- フロー電池製造企業
- Sumitomo Electric Industries, Ltd.
- Invinity Energy Systems PLC
- ESS Tech, Inc.
- Redflow Limited
- StorEn Technologies, Inc.
- LION Alternative Energy PLC
- CEC Science & Technology Co., Ltd.
- StorTera Ltd
- Stryten Energy
- フロー電池蓄電システム製造企業
- Largo Inc.
- ViZn Energy, Inc.
- VRB Energy
- Primus Power Solutions
- SCHMID Energy Systems GmbH
- Delectrik Systems Pvt. Ltd
第14章 付録
- Table 1 Currency Conversion Rates (2018-2022)
- Table 2 A Comparison Between Different Battery Types
- Table 3 Components and Materials Used in Flow Batteries
- Table 4 Global Flow Batteries Market, by Offering, 2024-2031 (USD Million)
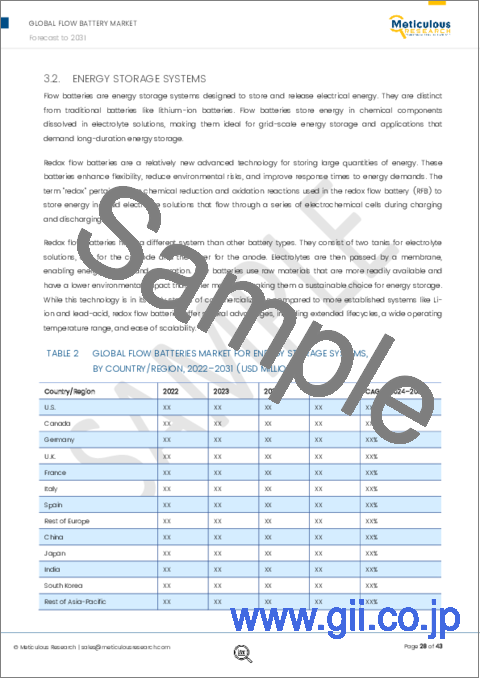
- Table 5 Global Flow Batteries Market for Energy Storage Systems, by Country/Region, 2022-2031 (USD Million)
- Table 6 Global Flow Batteries Market for Batteries, by Country/Region, 2022-2031 (USD Million)
- Table 7 Global Flow Batteries Market for Services, by Country/Region, 2022-2031 (USD Million)
- Table 8 Global Flow Batteries Market, by Battery Type, 2022-2031 (USD Million)
- Table 9 Global Vanadium Redox Flow Batteries Market, by Country/Region, 2022-2031 (USD Million)
- Table 10 Global Zinc-Bromine Flow Batteries Market, by Country/Region, 2022-2031 (USD Million)
- Table 11 Global All-Iron Flow Batteries Market, by Country/Region, 2022-2031 (USD Million)
- Table 12 Global Other Flow Batteries Market, by Country/Region, 2022-2031 (USD Million)
- Table 13 Global Flow Batteries Market, By Material, 2022-2031 (USD Million)
- Table 14 Global Flow Batteries Market for Vanadium, by Country/Region, 2022-2031 (USD Million)
- Table 15 Global Flow Batteries Market for Zinc-Bromine, by Country/Region, 2022-2031 (USD Million)
- Table 16 Global Flow Batteries Market for Hydrogen-Bromine, by Country/Region, 2022-2031 (USD Million)
- Table 17 Global Flow Batteries Market for Other Materials, by Country/Region, 2022-2031 (USD Million)
- Table 18 Global Flow Batteries Market, by Ownership, 2022-2031 (USD Million)
- Table 19 Global Utility-owned Flow Batteries Market, by Country/Region, 2022-2031 (USD Million)
- Table 20 Global Third-party-owned Flow Batteries Market, by Country/Region, 2022-2031 (USD Million)
- Table 21 Global Customer-Owned Flow Batteries Market, By Country/Region, 2022-2031 (USD Million)
- Table 22 Global Flow Batteries Market, by Application, 2022-2031 (USD Million)
- Table 23 Global Flow Batteries Market for Load Shifting, by Country/Region, 2022-2031 (USD Million)
- Table 24 Global Flow Batteries Market for Peak Shaving, by Country/Region, 2022-2031 (USD Million)
- Table 25 Global Flow Batteries Market for Commercial Applications, by Country/Region, 2022-2031 (USD Million)
- Table 26 Global Flow Batteries Market for Transmission & Distribution, by Country/Region, 2022-2031 (USD Million)
- Table 27 Global Flow Batteries Market for EV Charging, by Country/Region, 2022-2031 (USD Million)
- Table 28 Global Flow Batteries Market for Residential Applications, by Country/Region, 2022-2031 (USD Million)
- Table 29 Global Flow Batteries Market for Frequency Regulation, by Country/Region, 2022-2031 (USD Million)
- Table 30 Global Flow Batteries Market for Other Applications, by Country/Region, 2022-2031 (USD Million)
- Table 31 Global Flow Batteries Market, by End User, 2022-2031 (USD Million)
- Table 32 Global Flow Batteries Market for Utilities, by Country/Region, 2022-2031 (USD Million)
- Table 33 Global Flow Batteries Market for Commercial & Industrial, by Country/Region, 2022-2031 (USD Million)
- Table 34 Global Flow Batteries Market for Off-Grid & Micro-Grid Power, by Country/Region, 2022-2031 (USD Million)
- Table 35 Global Flow Batteries Market for EV Charging Stations, by Country/Region, 2022-2031 (USD Million)
- Table 36 Global Flow Batteries Market for Residential, by Country/Region, 2022-2031 (USD Million)
- Table 37 Global Flow Batteries Market for Other End Users, by Country/Region, 2022-2031 (USD Million)
- Table 38 Global Flow Battery Market, by Country/Region, 2022-2031 (USD Million)
- Table 39 Asia-Pacific: Flow Battery Market, by Country/Region, 2022-2031 (USD Million)
- Table 40 Asia-Pacific: Flow Battery Market, by Offering, 2022-2031 (USD Million)
- Table 41 Asia-Pacific: Flow Battery Market, by Battery Type, 2022-2031 (USD Million)
- Table 42 Asia-Pacific: Flow Battery Market, by Material, 2022-2031 (USD Million)
- Table 43 Asia-Pacific: Flow Battery Market, by Ownership, 2022-2031 (USD Million)
- Table 44 Asia-Pacific: Flow Battery Market, by Application, 2022-2031 (USD Million)
- Table 45 Asia-Pacific: Flow Battery Market, by End User, 2022-2031 (USD Million)
- Table 46 China: Flow Battery Market, by Offering, 2022-2031 (USD Million)
- Table 47 China: Flow Battery Market, by Battery Type, 2022-2031 (USD Million)
- Table 48 China: Flow Battery Market, by Material, 2022-2031 (USD Million)
- Table 49 China: Flow Battery Market, by Ownership, 2022-2031 (USD Million)
- Table 50 China: Flow Battery Market, by Application, 2022-2031 (USD Million)
- Table 51 China: Flow Battery Market, by End User, 2022-2031 (USD Million)
- Table 52 Japan: Flow Battery Market, by Offering, 2022-2031 (USD Million)
- Table 53 Japan: Flow Battery Market, by Battery Type, 2022-2031 (USD Million)
- Table 54 Japan: Flow Battery Market, by Material, 2022-2031 (USD Million)
- Table 55 Japan: Flow Battery Market, by Ownership, 2022-2031 (USD Million)
- Table 56 Japan: Flow Battery Market, by Application, 2022-2031 (USD Million)
- Table 57 Japan: Flow Battery Market, by End User, 2022-2031 (USD Million)
- Table 58 India: Flow Battery Market, by Offering, 2022-2031 (USD Million)
- Table 59 India: Flow Battery Market, by Battery Type, 2022-2031 (USD Million)
- Table 60 India: Flow Battery Market, by Material, 2022-2031 (USD Million)
- Table 61 India: Flow Battery Market, by Ownership, 2022-2031 (USD Million)
- Table 62 India: Flow Battery Market, by Application, 2022-2031 (USD Million)
- Table 63 India: Flow Battery Market, by End User, 2022-2031 (USD Million)
- Table 64 South Korea: Flow Battery Market, by Offering, 2022-2031 (USD Million)
- Table 65 South Korea: Flow Battery Market, by Battery Type, 2022-2031 (USD Million)
- Table 66 South Korea: Flow Battery Market, by Material, 2022-2031 (USD Million)
- Table 67 South Korea: Flow Battery Market, by Ownership, 2022-2031 (USD Million)
- Table 68 South Korea: Flow Battery Market, by Application, 2022-2031 (USD Million)
- Table 69 South Korea: Flow Battery Market, by End User, 2022-2031 (USD Million)
- Table 70 Rest of Asia-Pacific: Flow Battery Market, by Offering, 2022-2031 (USD Million)
- Table 71 Rest of Asia-Pacific: Flow Battery Market, by Battery Type, 2022-2031 (USD Million)
- Table 72 Rest of Asia-Pacific: Flow Battery Market, by Material, 2022-2031 (USD Million)
- Table 73 Rest of Asia-Pacific: Flow Battery Market, by Ownership, 2022-2031 (USD Million)
- Table 74 Rest of Asia-Pacific: Flow Battery Market, by Application, 2022-2031 (USD Million)
- Table 75 Rest of Asia-Pacific: Flow Battery Market, by End User, 2022-2031 (USD Million)
- Table 76 North America: Flow Battery Market, by Country, 2022-2031 (USD Million)
- Table 77 North America: Flow Battery Market, by Offering, 2022-2031 (USD Million)
- Table 78 North America: Flow Battery Market, by Battery Type, 2022-2031 (USD Million)
- Table 79 North America: Flow Battery Market, by Material, 2022-2031 (USD Million)
- Table 80 North America: Flow Battery Market, by Ownership, 2022-2031 (USD Million)
- Table 81 North America: Flow Battery Market, by Application, 2022-2031 (USD Million)
- Table 82 North America: Flow Battery Market, by End User, 2022-2031 (USD Million)
- Table 83 U.S.: Flow Battery Market, by Offering, 2022-2031 (USD Million)
- Table 84 U.S.: Flow Battery Market, by Battery Type, 2022-2031 (USD Million)
- Table 85 U.S.: Flow Battery Market, by Material, 2022-2031 (USD Million)
- Table 86 U.S.: Flow Battery Market, by Ownership, 2022-2031 (USD Million)
- Table 87 U.S.: Flow Battery Market, by Application, 2022-2031 (USD Million)
- Table 88 U.S.: Flow Battery Market, by End User, 2022-2031 (USD Million)
- Table 89 Canada: Flow Battery Market, by Offering, 2022-2031 (USD Million)
- Table 90 Canada: Flow Battery Market, by Battery Type, 2022-2031 (USD Million)
- Table 91 Canada: Flow Battery Market, by Material, 2022-2031 (USD Million)
- Table 92 Canada: Flow Battery Market, by Ownership, 2022-2031 (USD Million)
- Table 93 Canada: Flow Battery Market, by Application, 2022-2031 (USD Million)
- Table 94 Canada: Flow Battery Market, by End User, 2022-2031 (USD Million)
- Table 95 Europe: Flow Battery Market, by Country/Region, 2022-2031 (USD Million)
- Table 96 Europe: Flow Battery Market, by Offering, 2022-2031 (USD Million)
- Table 97 Europe: Flow Battery Market, by Battery Type, 2022-2031 (USD Million)
- Table 98 Europe: Flow Battery Market, by Material, 2022-2031 (USD Million)
- Table 99 Europe: Flow Battery Market, by Ownership, 2022-2031 (USD Million)
- Table 100 Europe: Flow Battery Market, by Application, 2022-2031 (USD Million)
- Table 101 Europe: Flow Battery Market, by End User, 2022-2031 (USD Million)
- Table 102 U.K.: Flow Battery Market, by Offering, 2022-2031 (USD Million)
- Table 103 U.K.: Flow Battery Market, by Battery Type, 2022-2031 (USD Million)
- Table 104 U.K.: Flow Battery Market, by Material, 2022-2031 (USD Million)
- Table 105 U.K.: Flow Battery Market, by Ownership, 2022-2031 (USD Million)
- Table 106 U.K.: Flow Battery Market, by Application, 2022-2031 (USD Million)
- Table 107 U.K.: Flow Battery Market, by End User, 2022-2031 (USD Million)
- Table 108 Germany: Flow Battery Market, by Offering, 2022-2031 (USD Million)
- Table 109 Germany: Flow Battery Market, by Battery Type, 2022-2031 (USD Million)
- Table 110 Germany: Flow Battery Market, by Material, 2022-2031 (USD Million)
- Table 111 Germany: Flow Battery Market, by Ownership, 2022-2031 (USD Million)
- Table 112 Germany: Flow Battery Market, by Application, 2022-2031 (USD Million)
- Table 113 Germany: Flow Battery Market, by End User, 2022-2031 (USD Million)
- Table 114 Italy: Flow Battery Market, by Offering, 2022-2031 (USD Million)
- Table 115 Italy: Flow Battery Market, by Battery Type, 2022-2031 (USD Million)
- Table 116 Italy: Flow Battery Market, by Material, 2022-2031 (USD Million)
- Table 117 Italy: Flow Battery Market, by Ownership, 2022-2031 (USD Million)
- Table 118 Italy: Flow Battery Market, by Application, 2022-2031 (USD Million)
- Table 119 Italy: Flow Battery Market, by End User, 2022-2031 (USD Million)
- Table 120 Spain: Flow Battery Market, by Offering, 2022-2031 (USD Million)
- Table 121 Spain: Flow Battery Market, by Battery Type, 2022-2031 (USD Million)
- Table 122 Spain: Flow Battery Market, by Material, 2022-2031 (USD Million)
- Table 123 Spain: Flow Battery Market, by Ownership, 2022-2031 (USD Million)
- Table 124 Spain: Flow Battery Market, by Application, 2022-2031 (USD Million)
- Table 125 Spain: Flow Battery Market, by End User, 2022-2031 (USD Million)
- Table 126 France: Flow Battery Market, by Offering, 2022-2031 (USD Million)
- Table 127 France: Flow Battery Market, by Battery Type, 2022-2031 (USD Million)
- Table 128 France: Flow Battery Market, by Material, 2022-2031 (USD Million)
- Table 129 France: Flow Battery Market, by Ownership, 2022-2031 (USD Million)
- Table 130 France: Flow Battery Market, by Application, 2022-2031 (USD Million)
- Table 131 France: Flow Battery Market, by End User, 2022-2031 (USD Million)
- Table 132 Rest of Europe: Flow Battery Market, by Offering, 2022-2031 (USD Million)
- Table 133 Rest of Europe: Flow Battery Market, by Battery Type, 2022-2031 (USD Million)
- Table 134 Rest of Europe: Flow Battery Market, by Material, 2022-2031 (USD Million)
- Table 135 Rest of Europe: Flow Battery Market, by Ownership, 2022-2031 (USD Million)
- Table 136 Rest of Europe: Flow Battery Market, by Application, 2022-2031 (USD Million)
- Table 137 Rest of Europe: Flow Battery Market, by End User, 2022-2031 (USD Million)
- Table 138 Latin America: Flow Battery Market, by Offering, 2022-2031 (USD Million)
- Table 139 Latin America: Flow Battery Market, by Battery Type, 2022-2031 (USD Million)
- Table 140 Latin America: Flow Battery Market, by Material, 2022-2031 (USD Million)
- Table 141 Latin America: Flow Battery Market, by Ownership, 2022-2031 (USD Million)
- Table 142 Latin America: Flow Battery Market, by Application, 2022-2031 (USD Million)
- Table 143 Latin America: Flow Battery Market, by End User, 2022-2031 (USD Million)
- Table 144 Middle East & Africa: Flow Battery Market, by Offering, 2022-2031 (USD Million)
- Table 145 Middle East & Africa: Flow Battery Market, by Battery Type, 2022-2031 (USD Million)
- Table 146 Middle East & Africa: Flow Battery Market, by Material, 2022-2031 (USD Million)
- Table 147 Middle East & Africa: Flow Battery Market, by Ownership, 2022-2031 (USD Million)
- Table 148 Middle East & Africa: Flow Battery Market, by Application, 2022-2031 (USD Million)
- Table 149 Middle East & Africa: Flow Battery Market, by End User, 2022-2031 (USD Million)
- Table 150 Recent Developments from Leading Market Players (2020-2023)
LIST OF FIGURES
- Figure 1 Market Ecosystem
- Figure 2 Key Stakeholders
- Figure 3 Research Process
- Figure 4 Key Secondary Sources
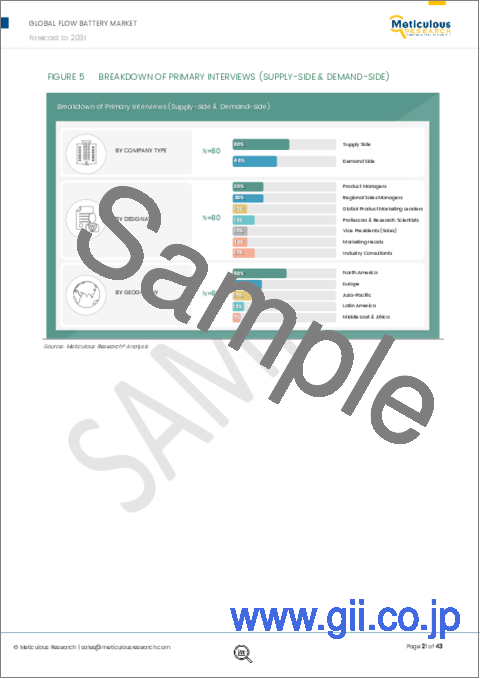
- Figure 5 Primary Research Techniques
- Figure 6 Key Executives Interviewed
- Figure 7 Breakdown of Primary Interviews (Supply Side & Demand Side)
- Figure 8 Market Sizing and Growth Forecast Approach
- Figure 9 Key Insights
- Figure 10 The Energy Storage Systems Segment to Account for the Largest Market Share in 2024
- Figure 11 The Vanadium Redox Flow Batteries Segment to Account for the Largest Market Share in 2024
- Figure 12 The Vanadium Segment to Account for the Largest Market Share in 2024
- Figure 13 The Utility-owned Segment to Account for the Largest Market Share in 2024
- Figure 14 The Load Shifting Segment to Account for the Largest Market Share in 2024
- Figure 15 The Utilities Segment to Account for the Largest Market Share in 2024
- Figure 16 Global Flow Batteries Market, By Region (2024 VS. 2031)
- Figure 17 Impact Analysis of Market Dynamics
- Figure 18 Flow Batteries Market Supply Chain
- Figure 19 PORTER'S Five Forces Analysis
- Figure 20 Global Flow Batteries Market, by Offering, 2024 Vs. 2031 (USD Million)
- Figure 21 Global Flow Batteries Market, by Battery Type, 2024 Vs. 2031 (USD Million)
- Figure 22 Vanadium Redox Flow Battery
- Figure 23 Zinc-Bromine Flow Battery
- Figure 24 All-iron Flow Battery
- Figure 25 Global Flow Batteries Market, by Material, 2024 Vs. 2031 (USD Million)
- Figure 26 Global Flow Batteries Market, by Ownership, 2024 Vs. 2031 (USD Million)
- Figure 27 Global Flow Batteries Market, by Application, 2024 Vs. 2031 (USD Million)
- Figure 28 Global Flow Batteries Market, by End User, 2024 Vs. 2031 (USD Million)
- Figure 29 Global Flow Battery Market, By Country/Region, 2024 Vs. 2031 (USD Million)
- Figure 30 Asia-Pacific: Flow Battery Market Snapshot
- Figure 31 North America: Flow Battery Market Snapshot
- Figure 32 Europe: Flow Battery Market Snapshot
- Figure 33 Leading Market Players' Strategic Developments (2020-2023)
- Figure 34 Vendor Market Positioning Analysis (2021-2023)
- Figure 35 Competitive Dashboard: Global Flow Batteries Market
- Figure 36 Market Share Analysis, by Leading Players, 2022
- Figure 37 Sumitomo Electric Industries, Ltd.: Financial Overview (2022)
- Figure 38 Invinity Energy Systems PLC: Financial Overview (2022)
- Figure 39 ESS Tech, Inc.: Financial Overview (2022)
- Figure 40 Redflow Limited: Financial Overview (2022)
- Figure 41 Largo Inc.: Financial Overview (2022)
'Flow Battery Market by Offering (Energy Storage Systems), Battery Type (Vanadium Redox Flow Batteries, Zinc-bromine Flow Batteries), Material, Ownership, Application, End User (Utilities, Commercial & Industrial), and Geography-Global Forecast to 2031.'
The research report titled 'Flow Battery Market by Offering (Energy Storage Systems), Battery Type (Vanadium Redox Flow Batteries, Zinc-bromine Flow Batteries), Material, Ownership, Application, End User (Utilities, Commercial & Industrial), and Geography-Global Forecast to 2031' provides an in-depth analysis of global flow battery market in five major geographies and emphasizes on the current market trends, market sizes, market shares, recent developments, and forecasts till 2031.
The global flow battery market is projected to reach $1.03 billion by 2031, at a CAGR of 16.5% during the forecast period of 2024-2031.
The growth of the flow batteries market is mainly driven by the high demand for flow batteries in utility applications and increasing investments in renewable energy. However, the lack of standardization in the development of flow battery systems and the high initial costs of flow battery manufacturing restrain the growth of this market.
Furthermore, technological innovation and the growing demand for backup power among data centers are expected to offer significant growth opportunities for players operating in the flow batteries market. However, the declining rate of flow battery deployment and disruptions in the supply of raw materials for battery manufacturing may hinder the growth of this market. Additionally, advancements in flow batteries and energy storage as a service are prominent trends in the flow batteries market.
The global flow battery market is segmented by offering (batteries, energy storage systems, and services), battery type (vanadium redox flow batteries, zinc-bromine flow batteries, all-iron flow batteries, and other flow batteries), material (zinc-bromine, vanadium, hydrogen-bromine, and other materials), ownership (customer-owned, third-party-owned, and utility-owned), application (peak shaving, load shifting, transmission & distribution, frequency regulation, commercial, EV charging, residential, and other applications), and end user (utilities, commercial & industrial, EV charging stations, off-grid & micro-grid power, residential, and other end users). The study also evaluates industry competitors and analyzes the market at geographical levels.
Based on offering, the global flow batteries market is segmented into batteries, energy storage systems, and services. In 2024, the energy storage systems segment is expected to account for the largest share of the global flow battery market. The large market share of this segment is attributed to various factors, as redox flow batteries are a relatively new advanced technology for storing large quantities of energy. These batteries enhance flexibility, reduce environmental risks, and improve response times to energy demands.
However, the battery segment is projected to register the highest CAGR during the forecast period due to the various benefits offered by flow batteries, such as scalability, long cycle life, durability, and rapid response. Also, flow batteries can be used for storing energy from intermittent renewable sources like wind and solar power, enabling grid stabilization.
Based on battery type, the global flow batteries market is segmented into vanadium redox flow batteries, zinc-bromine flow batteries, all-iron flow batteries, and other flow batteries. In 2024, the vanadium redox flow batteries segment is expected to account for the largest share of the global flow battery market. The large market share of this segment is attributed to various factors, as vanadium redox flow batteries are considered promising electrochemical energy storage systems due to their efficiency, flexibility, and scalability. Moreover, VRFBs have a long cycle life and can store large amounts of energy, making them suitable for grid energy storage and renewable energy integration.
Additionally, the same segment is projected to register the highest CAGR during the forecast period.
Based on material, the global flow batteries market is segmented into zinc-bromine, vanadium, hydrogen-bromine, and other materials. In 2024, the vanadium segment is expected to account for the largest share of the global flow battery market. The large market share of this segment is attributed to various factors as vanadium in the flow batteries allows for efficient and reversible electrochemical reactions, making it a key component of this energy storage technology.
Additionally, the same segment is projected to register the highest CAGR during the forecast period.
Based on ownership, the global flow batteries market is segmented into customer-owned, third-party-owned, and utility-owned. In 2024, the utility-owned segment is expected to account for the largest share of the global flow battery market. The growth of this segment is driven by the increasing demand for utility-scale ancillary services and the growing need to deliver peak loads to consumers through flow battery-powered ESS instead of extending power lines and transformers.
Additionally, the same segment is projected to register the highest CAGR during the forecast period.
Based on application, the global flow batteries market is segmented into peak shaving, load shifting, transmission & distribution, frequency regulation, commercial, EV charging, residential, and other applications. In 2024, the load shifting segment is expected to account for the largest share of the global flow battery market. The growth of this segment is driven by various factors, as flow batteries can be easily scaled up or down to meet specific energy storage needs. This makes them suitable for a wide range of applications, from residential to utility-scale projects. Also, flow batteries have a longer cycle life compared to many other energy storage technologies, such as lithium-ion batteries.
Additionally, the same segment is projected to register the highest CAGR during the forecast period.
Based on end user, the global flow batteries market is segmented into utilities, commercial & industrial, EV charging stations, off-grid & micro-grid power, residential, and other end users. In 2024, the utilities segment is expected to account for the largest share of the global flow battery market. The expansion of this segment can be attributed to the escalating endeavors of market players to introduce flow batteries that align with the environmental, longevity, and safety objectives of the utility industry. Additionally, the increasing utilization of Battery Energy Storage Systems (BESS) across various applications further contributes to this growth.
Additionally, the same segment is projected to register the highest CAGR during the forecast period.
Based on geography, the flow battery market is segmented into North America, Europe, Asia-Pacific, Latin America, and the Middle East & Africa. In 2023, Asia-Pacific is expected to account for the largest share of the global flow battery market. The expansion of the flow battery market in the Asia-Pacific region is credited to the rising investments in energy storage. Governments in burgeoning economies within the APAC region are implementing new policies aimed at enhancing the reliability and quality of power distribution facilities for residential customers, thereby contributing to the market's growth.
Additionally, Asia-Pacific is projected to record the highest CAGR during the forecast period.
The key players operating in the global flow batteries market include Invinity Energy Systems PLC (Jersey), Sumitomo Electric Industries, Ltd. (Japan), ESS Tech, Inc. (U.S.), Redflow Limited (Japan), StorEn Technologies, Inc. (U.S.), LION Alternative Energy PLC (England), CEC Science & Technology Co., Ltd. (China), StorTera Ltd (U.K.), Largo Inc. (U.S.), ViZn Energy, Inc. (U.S.), VRB ENERGY (U.S.), Primus Power Solutions (U.S.), SCHMID Energy Systems GmbH (Germany), Stryten Energy (Georgia), and Delectrik Systems Pvt. Ltd (India).
Key Questions Answered in the Report:
- Which are the high-growth market segments in terms of offering, battery type, material, ownership, application, and end user?
- What is the historical market size for the global flow battery market?
- What are the market forecasts and estimates for 2024-2031?
- What are the major drivers, restraints, opportunities, challenges, and trends in the global flow battery market?
- Who are the major players in the global flow battery market, and what are their market shares?
- What is the competitive landscape like?
- What are the recent developments in the global flow battery market?
- What are the geographic trends and high-growth countries?
- Who are the local emerging players in the global flow battery market, and how do they compete with other players?
Flow Battery Market Assessment-by Offering
- Energy Storage Systems
- Batteries
- Services
Flow Battery Market Assessment-by Battery Type
- Vanadium Redox Flow Batteries
- Zinc-bromine Flow Batteries
- All-iron Flow Batteries
- Other Flow Batteries
Flow Battery Market Assessment-by Material
- Vanadium
- Zinc-bromine
- Hydrogen-bromine
- Other Materials
Flow Battery Market Assessment-by Ownership
- Utility-owned
- Third-party-owned
- Customer-owned
Flow Battery Market Assessment-by Application
- Load Shifting
- Peak Shaving
- Commercial
- Transmission & Distribution
- EV Charging
- Residential
- Frequency Regulation
- Other Applications
Flow Battery Market Assessment-by End User
- Utilities
- Commercial & Industrial
- Off-grid & Micro-grid Power
- EV Charging Station
- Residential
- Other End Users
Flow Battery Market Assessment-by Geography
- North America
- U.S.
- Canada
- Asia-Pacific
- China
- Japan
- India
- South Korea
- Rest of Asia-Pacific
- Europe
- U.K.
- Germany
- Italy
- France
- Spain
- Rest of Europe
- Latin America
- Middle East & Africa
TABLE OF CONTENTS
1. Market Definition & Scope
- 1.1. Market Definition
- 1.2. Currency & Limitations
- 1.2.1. Currency
- 1.2.2. Limitations
2. Research Methodology
- 2.1. Research Approach
- 2.2. Data Collection & Validation Process
- 2.2.1. Secondary Research
- 2.2.2. Primary Research/Interviews with Key Opinion Leaders from the Industry
- 2.3. Market Sizing and Forecasting
- 2.3.1. Market Size Estimation Approach
- 2.3.2. Growth Forecast Approach
- 2.4. Assumptions for the Study
3. Executive Summary
- 3.1. Overview
- 3.2. Market Analysis, By Offering
- 3.3. Market Analysis, By Battery Type
- 3.4. Market Analysis, By Material
- 3.5. Market Analysis, By Ownership
- 3.6. Market Analysis, By Application
- 3.7. Market Analysis, By End User
- 3.8. Market Analysis, By Geography
- 3.9. Competitive Analysis
4. Market Insights
- 4.1. Overview
- 4.2. Factors Affecting Market Growth
- 4.2.1. Growing Use of Flow Batteries in Utility Applications Supporting Market Growth
- 4.2.2. Increasing Investments in the Renewable Energy Sector Boosting the Demand for Flow Batteries
- 4.2.3. Lack of Standardization in the Development Of Flow Battery Systems Restraining Market Growth
- 4.2.4. High Initial Costs of Manufacturing Impacting the Production of Flow Batteries
- 4.2.5. Technological Innovation in Flow Batteries Generating Growth Opportunities for Market Players
- 4.2.6. Growing Need for Power Backup in Data Centers Expected to Create Market Growth Opportunities
- 4.2.7. Limitations of Flow Batteries Reducing Deployment Across Industries
- 4.2.8. Unstable Raw Materials Supply to Remain a Major Challenge For Market Players
- 4.3. Trends
- 4.3.1. Increasing Focus on Advancing Flow Battery Technology
- 4.3.2. Energy Storage-as-a-Service (ESaaS)
- 4.4. A Comparative Overview of Major Battery Types
- 4.5. Components and Materials Used in Flow Batteries
- 4.6. Supply Chain Analysis
- 4.7. PORTER'S Five Forces Analysis
- 4.7.1. Bargaining Power of Buyers
- 4.7.2. Bargaining Power of Suppliers
- 4.7.3. Threat of Substitutes
- 4.7.4. Threat of New Entrants
- 4.7.5. Degree of Competition
5. Flow Battery Market Assessment-by Offering
- 5.1. Overview
- 5.2. Energy Storage Systems
- 5.3. Batteries
- 5.4. Services
6. Flow Battery Market Assessment-by Battery Type
- 6.1. Overview
- 6.2. Vanadium Redox Flow Batteries
- 6.3. Zinc-Bromine Flow Batteries
- 6.4. All-iron Flow Batteries
- 6.5. Other Flow Batteries
7. Flow Battery Market Assessment-by Material
- 7.1. Overview
- 7.2. Vanadium
- 7.3. Zinc-Bromine
- 7.4. Hydrogen-Bromine
- 7.5. Other Materials
8. Flow Battery Market Assessment-by Ownership
- 8.1. Overview
- 8.2. Utility-owned
- 8.3. Third-party-owned
- 8.4. Customer-owned
9. Flow Battery Market Assessment-by Application
- 9.1. Overview
- 9.2. Load Shifting
- 9.3. Peak Shaving
- 9.4. Commercial
- 9.5. Transmission & Distribution
- 9.6. EV Charging
- 9.7. Residential
- 9.8. Frequency Regulation
- 9.9. Other Applications
10. Flow Battery Market Assessment-by End User
- 10.1. Overview
- 10.2. Utilities
- 10.3. Commercial & Industrial
- 10.4. Off-grid & Micro-grid Power
- 10.5. EV Charging Stations
- 10.6. Residential
- 10.7. Other End Users
11. Flow Battery Market Assessment-by Geography
- 11.1. Overview
- 11.2. Asia-Pacific
- 11.2.1. China
- 11.2.2. Japan
- 11.2.3. India
- 11.2.4. South Korea
- 11.2.5. Rest of Asia-Pacific
- 11.3. North America
- 11.3.1. U.S.
- 11.3.2. Canada
- 11.4. Europe
- 11.4.1. U.K.
- 11.4.2. Germany
- 11.4.3. Italy
- 11.4.4. Spain
- 11.4.5. France
- 11.4.6. Rest of Europe
- 11.5. Latin America
- 11.6. Middle East & Africa
12. Competition Analysis
- 12.1. Overview
- 12.2. Key Growth Strategies
- 12.3. Competitive Benchmarking
- 12.4. Competitive Dashboard
- 12.4.1. Industry Leaders
- 12.4.2. Market Differentiators
- 12.4.3. Vanguards
- 12.4.4. Emerging Companies
- 12.5. Market Share Analysis (2022)
13. Company Profiles
- 13.1. Flow Battery Manufacturing Companies
- 13.1.1. Sumitomo Electric Industries, Ltd.
- 13.1.1.1. Company Overview
- 13.1.1.2. Financial Overview
- 13.1.1.3. Product Portfolio
- 13.1.1.4. Strategic Developments
- 13.1.1.5. SWOT Analysis
- 13.1.2. Invinity Energy Systems PLC
- 13.1.2.1. Company Overview
- 13.1.2.2. Financial Overview
- 13.1.2.3. Product Portfolio
- 13.1.2.4. Strategic Developments
- 13.1.2.5. SWOT Analysis
- 13.1.3. ESS Tech, Inc.
- 13.1.3.1. Company Overview
- 13.1.3.2. Financial Overview
- 13.1.3.3. Product Portfolio
- 13.1.3.4. Strategic Developments
- 13.1.3.5. SWOT Analysis
- 13.1.4. Redflow Limited
- 13.1.4.1. Company Overview
- 13.1.4.2. Financial Overview
- 13.1.4.3. Product Portfolio
- 13.1.4.4. Strategic Developments
- 13.1.5. StorEn Technologies, Inc.
- 13.1.5.1. Company Overview
- 13.1.5.2. Product Portfolio
- 13.1.5.3. Strategic Developments
- 13.1.6. LION Alternative Energy PLC
- 13.1.6.1. Company Overview
- 13.1.6.2. Product Portfolio
- 13.1.7. CEC Science & Technology Co., Ltd.
- 13.1.7.1. Company Overview
- 13.1.7.2. Product Portfolio
- 13.1.8. StorTera Ltd
- 13.1.8.1. Company Overview
- 13.1.8.2. Product Portfolio
- 13.1.9. Stryten Energy
- 13.1.9.1. Company Overview
- 13.1.9.2. Product Portfolio
- 13.1.9.3. Strategic Developments
- 13.1.1. Sumitomo Electric Industries, Ltd.
- 13.2. Flow Battery Energy Storage Systems Manufacturing Companies
- 13.2.1. Largo Inc.
- 13.2.1.1. Company Overview
- 13.2.1.2. Financial Overview
- 13.2.1.3. Product Portfolio
- 13.2.2. ViZn Energy, Inc.
- 13.2.2.1. Company Overview
- 13.2.2.2. Product Portfolio
- 13.2.3. VRB Energy
- 13.2.3.1. Company Overview
- 13.2.3.2. Product Portfolio
- 13.2.3.3. Strategic Developments
- 13.2.4. Primus Power Solutions
- 13.2.4.1. Company Overview
- 13.2.4.2. Product Portfolio
- 13.2.5. SCHMID Energy Systems GmbH
- 13.2.5.1. Company Overview
- 13.2.5.2. Product Portfolio
- 13.2.6. Delectrik Systems Pvt. Ltd
- 13.2.6.1. Company Overview
- 13.2.6.2. Product Portfolio
- 13.2.1. Largo Inc.
14. Appendix
- 14.1. Available Customization
- 14.2. Related Reports

