|
|
市場調査レポート
商品コード
1449538
ガスエンジンの世界市場:燃料タイプ (天然ガス・特殊ガス)・出力・エンドユーザー (発電・コージェネレーション・機械駆動)・エンドユーザー産業・地域別 - 予測(~2029年)Gas Engine Market by Fuel Type (Natural Gas, Special Gas), Power Output, Application (Power Generation, Cogeneration, Mechanical Drive), End-Use Industry and Region - Global Forecast to 2029 |
||||||
|
|||||||
カスタマイズ可能
|
|||||||

| ガスエンジンの世界市場:燃料タイプ (天然ガス・特殊ガス)・出力・エンドユーザー (発電・コージェネレーション・機械駆動)・エンドユーザー産業・地域別 - 予測(~2029年) |
|
出版日: 2024年03月08日
発行: MarketsandMarkets
ページ情報: 英文 282 Pages
納期: 即納可能
|

全表示
- 概要
- 目次
ガスエンジンの市場規模は、予測期間中に4.5%のCAGRで推移し、2024年の51億米ドルから、2029年には63億米ドルの規模に成長すると予測されています。
ガスエンジン市場は、いくつかの重要な要因によって大きな成長を遂げています。主な原動力のひとつは、よりクリーンで持続可能なエネルギーソリューションに対する世界の需要の高まりです。産業界や政府が二酸化炭素排出量の削減や従来の化石燃料からの脱却に注力する中、ガスエンジンは排出量が少なく効率が高いという魅力的な代替手段を提供しています。さらに、燃料効率や信頼性の向上など、ガスエンジン技術の進歩は、さまざまな用途におけるこれらのエンジンの性能と汎用性を高めることで、市場の成長にさらに貢献しています。さらに、特にユーティリティ、製造、石油・ガスなどの産業における分散型発電ソリューションに対する需要の高まりが、自家発電やコージェネレーション用ガスエンジンの採用に拍車をかけています。また、天然ガスや再生可能エネルギー源の利用を促進する政府の支援政策やインセンティブが、ガスエンジンインフラへの投資を奨励し、市場拡大を後押ししています。良好な市場力学と環境の持続可能性に対する意識の高まりにより、ガスエンジン市場は当面継続的な成長が見込まれています。
| 調査範囲 | |
|---|---|
| 調査対象年 | 2020-2029年 |
| 基準年 | 2023年 |
| 予測期間 | 2024-2029年 |
| 単位 | 金額 (米ドル) |
| セグメント | 燃料タイプ・出力・用途・エンドユーザー別 |
| 対象地域 | アジア太平洋・北米・欧州・中東&アフリカ・南米 |
出力別では、5.1~15MWの部門が2024年から2029年にかけてもっとも急成長する市場:
5.1~15MWの部門はその急速な拡大を促進するいくつかの主要な要因により、2024年から2029年にかけてもっとも急成長する市場になると予測されています。第一に、この出力範囲のガスエンジンは出力容量が大幅に増加するため、多様な産業にわたる大規模用途に適しています。これらのエンジンは、中規模から大規模の発電プロジェクト、産業施設、ユーティリティ規模のコージェネレーション用途に特に適しています。さらに、ガスエンジン技術の進歩により、この出力範囲のエンジンの効率、信頼性、性能が向上し、堅牢でコスト効率の高い電力ソリューションを求めるエンドユーザーにとって、ますます魅力的なものとなっています。さらに、5.1~15MWのガスエンジンは汎用性が高いため、さまざまなグリッドサポートや分散型エネルギー発電用途に柔軟に展開でき、市場の成長をさらに後押ししています。インフラ整備や再生可能エネルギー発電への投資の増加、分散型発電ソリューションへの需要の拡大なども同部門でのガスエンジンの採用を後押しすると予想されています。このような良好な市場環境と5.1~15MWのガスエンジンの拡張性により、同部門は予測期間中に大きな成長を遂げる見通しです。
2024年から2029年にかけて、エンドユーザー産業別ではユーティリティ部門が最大市場に:
エンドユーザー産業別では、ユーティリティの部門がその優位性に寄与するいくつかの促進要因により、2024年から2029年にかけて最大の市場として浮上すると予測されています。ユーティリティ部門には、電力、ガス、水道など幅広いサービスが含まれ、発電やコージェネレーション用途でガスエンジンに大きく依存しています。ガスエンジンは、電力会社に発電のための信頼できる効率的なソリューションを提供し、送電網の安定性を高めながら、現代社会の増大するエネルギー需要を満たすことを可能にします。また、ガスエンジンは、ピークカット、グリッドサポート、分散型エネルギー発電など、さまざまな用途にユーティリティ企業が柔軟に導入できるため、市場での地位をさらに強固なものにしています。よりクリーンなエネルギー源への移行や持続可能性への関心の高まりが、従来の化石燃料ベースの発電に比べて排出量が少なく、燃料の柔軟性が高いガスエンジンの採用をユーティリティ会社に促しています。政府の政策やインセンティブによる後押し、信頼性が高く持続可能なエネルギーソリューションへのニーズなどから、ガスエンジン市場では予測期間中、ユーティリティ部門が優位性を維持する見通しです。
アジア太平洋地域がガスエンジン市場で最大かつ最速の成長地域に:
アジア太平洋地域は、ガスエンジン市場において最大かつ最速の成長地域となります。第一に、この地域の国々における急速な工業化、都市化、人口増加が、さまざまな分野におけるエネルギー需要の大幅な増加をもたらしています。ガスエンジンは、発電、コジェネレーション、機械駆動アプリケーションに信頼性が高く効率的なソリューションを提供し、新興経済諸国の高まるエネルギー需要を満たす上で不可欠なものとなっています。さらに、よりクリーンなエネルギー源を推進し、温室効果ガスの排出を削減することを目的とした政府の支援政策やイニシアティブが、アジア太平洋地域におけるガスエンジンの採用を加速させています。中国、インド、オーストラリアなどの国々には天然ガス資源が豊富にあるため、費用対効果が高く持続可能な発電ソリューションとしてのガスエンジンの魅力が高まっています。発電所、分散型エネルギーシステム、輸送ネットワークなどのインフラ整備への継続的な投資もこの地域全体のガスエンジン需要をさらに押し上げています。良好な市場力学、投資流入の増加、持続可能性の重視の高まりにより、アジア太平洋地域はガスエンジン市場の大幅な成長が見込まれ、当面は最大かつ最速の成長地域となります。
当レポートでは、世界のガスエンジンの市場を調査し、市場概要、市場影響因子および市場機会の分析、技術・特許の動向、法規制環境、ケーススタディ、市場規模の推移・予測、各種区分・地域別の詳細分析、競合情勢、主要企業のプロファイルなどをまとめています。
目次
第1章 イントロダクション
第2章 調査手法
第3章 エグゼクティブサマリー
第4章 重要考察
第5章 市場概要
- 市場力学
- 促進要因
- 抑制要因
- 機会
- 課題
- 顧客の事業に影響を与える動向/ディスラプション
- マーケットマップ
- バリューチェーン分析
- 価格分析
- 投資と資金調達のシナリオ
- 貿易分析
- 関税、法規、規制
- 特許分析
- 主要な会議とイベント
- ポーターのファイブフォース分析
- ケーススタディ分析
- 技術分析
- 主なステークホルダーと購入基準
第6章 ガスエンジン市場:燃料タイプ別
- 天然ガス
- 特殊ガス
- その他
第7章 ガスエンジン市場:出力別
- 0.5~1MW
- 1.1~2MW
- 2.1~5MW
- 5.1-15MW
- 15MW以上
第8章 ガスエンジン市場:用途別
- 発電
- コージェネレーション
- 機械駆動
- その他
第9章 ガスエンジン市場:エンドユーザー産業別
- ユーティリティ
- 製造
- 船舶
- 石油・ガス
- その他
第10章 ガスエンジン市場:地域別
- アジア太平洋
- 欧州
- 北米
- 南米
- 中東・アフリカ
第11章 競合情勢
- 主要企業の戦略
- 上位5社の市場シェア分析
- 上位5社の収益分析
- 企業評価マトリックス
- ブランド/製品の比較
- ガスエンジン市場:企業のフットプリント
- 新興企業/中小企業評価マトリックス
- 主要なガスエンジン市場参入企業の評価と財務指標
- 競合シナリオ
第12章 企業プロファイル
- 主要企業
- CATERPILLAR
- WARTSILA
- ROLLS-ROYCE HOLDINGS
- CUMMINS
- VOLKSWAGEN (MAN ENERGY SOLUTIONS)
- SIEMENS ENERGY
- MITSUBISHI HEAVY INDUSTRIES, LTD.
- INNIO
- KAWASAKI HEAVY INDUSTRIES, LTD.
- NINGBO C.S.I. POWER & MACHINERY GROUP CO., LTD.
- IHI POWER SYSTEMS
- JFE ENGINEERING CORPORATION
- LIEBHERR
- HYUNDAI HEAVY INDUSTRIES CO., LTD.
- JINAN LVNENG POWER MACHINERY EQUIPMENT CO., LTD
- その他の企業
- R SCHMITT ENERTEC
- CNPC JICHAI POWER COMPLEX
- FAIRBANKS MORSE
- GOOGOL ENGINE TECH
- BAUDOUIN
- DOOSAN
- YANMAR
- KOHLER CO.
- DEUTZ AG
- ACHATES POWER INC.
第13章 付録
The global market for gas engines is poised for substantial growth, with a projected trajectory reaching USD 6.3 billion by the year 2029. This represents a noteworthy increase from the estimated value of USD 5.1 billion in 2024, reflecting a steady Compound Annual Growth Rate (CAGR) of 4.5% over the period spanning from 2024 to 2029. The gas engine market is experiencing significant growth driven by several key factors. One of the primary drivers is the increasing demand for cleaner and more sustainable energy solutions worldwide. As industries and governments focus on reducing carbon emissions and transitioning away from traditional fossil fuels, gas engines offer a compelling alternative with lower emissions and higher efficiency. Additionally, advancements in gas engine technology, such as improved fuel efficiency and reliability, further contribute to market growth by enhancing the performance and versatility of these engines across various applications. Moreover, the rising demand for decentralized power generation solutions, particularly in industries like utilities, manufacturing, and oil and gas, is fueling the adoption of gas engines for onsite power generation and cogeneration. Furthermore, supportive government policies and incentives promoting the use of natural gas and renewable energy sources are driving market expansion by incentivizing investments in gas engine infrastructure. With favorable market dynamics and increasing awareness of environmental sustainability, the gas engine market is poised for continued growth in the foreseeable future.
| Scope of the Report | |
|---|---|
| Years Considered for the Study | 2020-2029 |
| Base Year | 2023 |
| Forecast Period | 2024-2029 |
| Units Considered | Value (USD Billion) |
| Segments | By Fuel Type, By Power Output, By Application, and By End User |
| Regions covered | Asia Pacific, North America, Europe, Middle East and Africa, and South America |
"5.1-15 MW segment, by power output, to be fastest growing market from 2024 to 2029."
The 5.1-15 MW segment, categorized by power output, is anticipated to emerge as the fastest-growing market from 2024 to 2029 due to several key factors driving its rapid expansion. Firstly, gas engines within this power range offer a substantial increase in power capacity, making them suitable for larger-scale applications across a diverse range of industries. These engines are particularly well-suited for medium to large-scale power generation projects, industrial facilities, and utility-scale cogeneration applications. Additionally, advancements in gas engine technology have enhanced the efficiency, reliability, and performance of engines within this power range, making them increasingly attractive to end-users seeking robust and cost-effective power solutions. Moreover, the versatility of gas engines in the 5.1-15 MW range allows for flexible deployment in various grid support and distributed energy generation applications, further driving their market growth. Furthermore, the growing demand for decentralized power generation solutions, coupled with increasing investments in infrastructure development and renewable energy integration, is expected to bolster the adoption of gas engines in this segment. With these favorable market conditions and the scalability of gas engines in the 5.1-15 MW range, this segment is poised to witness significant growth during the forecast period.
"Utilities Segment, by end-use industry, to be the largest market from 2024 to 2029."
The utilities segment, classified by end-use industry, is projected to emerge as the largest market from 2024 to 2029 due to several driving factors contributing to its dominance. Utilities encompass a wide range of services, including electricity, gas, and water supply, and they rely heavily on gas engines for power generation and cogeneration applications. Gas engines offer utilities a reliable and efficient solution for electricity generation, enabling them to meet the increasing energy demands of modern societies while enhancing grid stability. Additionally, gas engines provide utilities with the flexibility to deploy them in various applications such as peak shaving, grid support, and distributed energy generation, further solidifying their position in the market. Furthermore, the transition towards cleaner energy sources and the increasing focus on sustainability are driving utilities to adopt gas engines, which offer lower emissions and greater fuel flexibility compared to traditional fossil fuel-based power generation. With supportive government policies, incentives, and the need for reliable and sustainable energy solutions, the utilities segment is poised to maintain its dominance in the gas engine market during the forecast period.
"Asia Pacific to be largest and fastest growing region in gas engine market."
The Asia Pacific region is poised to emerge as both the largest and fastest-growing region in the gas engine market due to several compelling factors driving its prominence. Firstly, rapid industrialization, urbanization, and population growth across countries in the region are leading to a significant increase in energy demand across various sectors. Gas engines offer a reliable and efficient solution for power generation, cogeneration, and mechanical drive applications, making them indispensable in meeting the escalating energy needs of these rapidly developing economies. Additionally, supportive government policies and initiatives aimed at promoting cleaner energy sources and reducing greenhouse gas emissions are accelerating the adoption of gas engines in the Asia Pacific region. Moreover, the abundance of natural gas resources in countries like China, India, and Australia enhances the attractiveness of gas engines as cost-effective and sustainable power generation solutions. Furthermore, ongoing investments in infrastructure development, including power plants, distributed energy systems, and transportation networks, further drive the demand for gas engines across the region. With favorable market dynamics, increasing investment inflows, and a growing emphasis on sustainability, the Asia Pacific region is positioned for substantial growth in the gas engine market, making it both the largest and fastest-growing region in the foreseeable future.
Breakdown of Primaries:
Important qualitative and quantitative data were gathered and verified, as well as future market prospects, through in-depth interviews with subject-matter experts, C-level executives of major market players, industry consultants, and other experts. The following is how the main interviews were dispersed:
By Company Type: Tier 1-40%, Tier 2-35%, and Tier 3-25%
By Designation: C-Level-35%, D-Level-25%, and Others-40%
By Region: Asia Pacific-55%, North America-20%, Europe-12%, Middle East & Africa-8%, and South America-5%
Note: "Others" include sales managers, engineers, and regional managers
The tiers of the companies are defined based on their total revenue as of 2023: Tier 1: >USD 1 billion, Tier 2: USD 500 million-1 billion, and Tier 3: <USD 500 million.
The market for gas engines is primarily controlled by reputable international giants. In the industrial control transformer market, some of the leading companies are Caterpillar (USA), Wartsila (Finland), Rolls-Royce Holdings (UK), Cummins (USA), Volkswagen (Germany), Siemens Energy (Germany), Mitsubishi Heavy Industries (Japan) and a few more.
Research Coverage:
The report offers an in-depth analysis of the gas engines market, providing comprehensive definitions, descriptions, and forecasts based on various parameters. These parameters encompass fuel type (including Natural gas, Specific gas, and Others), Power Output (ranging from 0.5-1 MW to Above 15 MW), Application (covering Power Generation, Cogeneration, Mechanical Drive, and Others), End-User (such as Utilities, Manufacturing, Marine, Oil & Gas, and Others), and region (including Asia Pacific, North America, Europe, Middle East and Africa, and South America). Through both qualitative and quantitative approaches, the report examines key drivers, limitations, opportunities, and challenges within the gas engine market. Additionally, it delves into critical aspects such as competitive landscape analysis, market dynamics assessment, value-based market estimates, and insights into future trends shaping the gas engines market.
Key Benefits of Buying the Report
The report is meticulously crafted to cater to the needs of both established industry leaders and newcomers entering the gas engines market. It offers reliable revenue forecasts for the entire market and its individual sub-segments, serving as a valuable resource for stakeholders to gain a comprehensive understanding of the competitive landscape. This data empowers stakeholders to formulate effective market strategies for their businesses. Additionally, the report acts as a conduit for stakeholders to comprehend the current state of the market, providing crucial insights into market drivers, limitations, challenges, and growth opportunities. By integrating these insights, stakeholders can make informed decisions and stay abreast of the ever-evolving dynamics within the gas engines industry.
- Analysis of key drivers (Embracing Clean and Efficient Power Generation, Enforcing Stringent Emission Regulations, Advance Gas Engine Technology, Integrated Renewable Energy Sources), restraints ( Policy and Regulatory Uncertainty, Managing Fluctuating Gas Prices ), opportunities ( Navigating the Evolving Landscape of Coal, Gas, and Nuclear, The adoption of natural gas as a transition fuel, Leverage Biogas and Landfill Gas Potential), and challenges (Addressing Infrastructural shortcomings, Ensuring Long-Term Sustainability) influencing the growth of the gas engine market.
- Product Development/ Innovation: In the gas engine market, product development and innovation play a crucial role in driving growth and competitiveness. Manufacturers continually invest in research and development to enhance the performance, efficiency, and environmental sustainability of gas engines. One significant trend in product development is the integration of advanced technologies such as digitalization, automation, and predictive maintenance capabilities. These innovations aim to optimize engine operation, improve reliability, and reduce downtime, thereby enhancing overall productivity and cost-effectiveness for end-users. Additionally, there is a growing emphasis on developing gas engines that are compatible with a wider range of fuel types, including biogas, syngas, and hydrogen, to offer greater flexibility and sustainability. Furthermore, manufacturers are exploring novel design concepts and materials to optimize engine components, reduce emissions, and improve energy efficiency. Collaborations with research institutions, government agencies, and industry partners are also fostering innovation in the gas engine market, facilitating the development of cutting-edge technologies and solutions to meet evolving customer demands and regulatory requirements. Overall, product development and innovation are driving forces in shaping the future of the gas engine market, enabling manufacturers to stay ahead in a rapidly evolving industry landscape.
- Market Development: The gas engine market is undergoing significant development, driven by various factors shaping its trajectory. One notable aspect is the increasing demand for cleaner and more sustainable energy solutions globally. Gas engines, renowned for their efficiency and lower emissions compared to traditional fossil fuel-based alternatives, are witnessing heightened adoption across industries and applications. Additionally, technological advancements, such as improvements in engine efficiency and reliability, are enhancing the performance and versatility of gas engines, further bolstering market growth. Moreover, the growing emphasis on decentralized power generation solutions, particularly in sectors like utilities, manufacturing, and oil and gas, is fueling the deployment of gas engines for onsite power generation and cogeneration applications. Furthermore, supportive government policies and incentives aimed at promoting renewable energy sources and reducing greenhouse gas emissions are driving investments in gas engine infrastructure and accelerating market development. With these favorable market dynamics and increasing awareness of environmental sustainability, the gas engine market is experiencing notable development, presenting lucrative opportunities for stakeholders across various industries.
- Market Diversification: The gas engine market is witnessing significant diversification across various dimensions, reflecting the evolving needs and preferences of end-users as well as the dynamic nature of technological advancements and market trends. Market diversification is evident across multiple facets, including fuel type, power output, application, end-user industries, and geographic regions. In terms of fuel type, gas engines are adaptable to a range of fuel sources, including natural gas, specific gases like biogas or syngas, and others, catering to diverse environmental and operational requirements. Similarly, the market exhibits diversification in power output, with engines spanning a wide range from small-scale units below 1 MW to large-scale units exceeding 15 MW, addressing the varying power needs of different applications and industries. Furthermore, gas engines find application across multiple sectors such as power generation, cogeneration, mechanical drive systems, and others, demonstrating versatility and adaptability across various industrial processes and operations. The end-user landscape also showcases diversification, encompassing utilities, manufacturing, marine, oil & gas, and other sectors, each with unique demands and challenges driving the adoption of gas engines. Geographically, the market is diversified across regions such as Asia Pacific, North America, Europe, Middle East and Africa, and South America, each presenting distinct market dynamics, regulatory environments, and growth opportunities. Overall, market diversification in the gas engine industry reflects a multifaceted landscape characterized by innovation, customization, and adaptation to meet the evolving needs of a diverse range of end-users and industries worldwide.
- Competitive Assessment: The competitive landscape of the gas engine market is characterized by a diverse array of players vying for market share through various strategies and offerings. Major players such as Caterpillar Inc., Wartsila Corporation, Siemens Energy AG, Rolls-Royce Holdings plc, and Cummins Inc. dominate the market with their extensive product portfolios, global presence, and technological advancements. These companies continuously focus on research and development to innovate and introduce new products that meet the evolving needs of customers and align with sustainability goals. Additionally, partnerships, collaborations, mergers, and acquisitions are common strategies employed by players to enhance their market position and expand their geographic footprint. Alongside established players, there is a growing presence of smaller and niche players offering specialized solutions catering to specific market segments or applications. The competitive assessment within the gas engine market underscores the importance of innovation, strategic partnerships, and customer-centric approaches in maintaining and enhancing competitiveness in the evolving landscape of the industry.
TABLE OF CONTENTS
1 INTRODUCTION
- 1.1 STUDY OBJECTIVES
- 1.2 DEFINITION
- 1.3 INCLUSIONS AND EXCLUSIONS
- 1.3.1 GAS ENGINES MARKET, BY FUEL TYPE
- 1.3.2 GAS ENGINES MARKET, BY POWER OUTPUT
- 1.3.3 GAS ENGINES MARKET, BY APPLICATION
- 1.3.4 GAS ENGINES MARKET, BY END-USE INDUSTRY
- 1.3.5 GAS ENGINES MARKET, BY REGION
- 1.4 MARKET SCOPE
- 1.4.1 GAS ENGINES MARKET SEGMENTATION
- 1.4.2 REGIONAL SCOPE
- 1.5 YEARS CONSIDERED
- 1.6 CURRENCY
- 1.7 LIMITATIONS
- 1.8 STAKEHOLDERS
- 1.9 SUMMARY OF CHANGES
2 RESEARCH METHODOLOGY
- 2.1 RESEARCH DATA
- FIGURE 1 GAS ENGINES MARKET: RESEARCH DESIGN
- 2.1.1 SECONDARY DATA
- 2.1.1.1 Key data from secondary sources
- 2.1.2 PRIMARY DATA
- 2.1.2.1 Key data from primary sources
- 2.1.2.2 Breakdown of primaries
- FIGURE 2 BREAKDOWN OF PRIMARY INTERVIEWS: BY COMPANY TYPE, DESIGNATION, AND REGION
- FIGURE 3 GAS ENGINES DEMAND: MAIN METRICS CONSIDERED FOR ANALYSIS AND ASSESSMENT
- 2.2 MARKET SIZE ESTIMATION
- 2.2.1 BOTTOM-UP APPROACH
- FIGURE 4 MARKET SIZE ESTIMATION METHODOLOGY: BOTTOM-UP APPROACH
- 2.2.2 TOP-DOWN APPROACH
- FIGURE 5 MARKET SIZE ESTIMATION METHODOLOGY: TOP-DOWN APPROACH
- 2.2.3 DEMAND-SIDE ANALYSIS
- 2.2.3.1 Regional analysis
- 2.2.3.2 Country analysis
- 2.2.3.3 Demand-side assumptions
- 2.2.3.4 Demand-side calculations
- 2.2.4 SUPPLY-SIDE ANALYSIS
- FIGURE 6 KEY STEPS CONSIDERED TO ASSESS SUPPLY OF GAS ENGINES
- FIGURE 7 GAS ENGINES MARKET: SUPPLY-SIDE ANALYSIS
- 2.2.4.1 Supply-side assumptions
- 2.2.4.2 Supply-side calculations
- 2.2.5 FORECAST
- 2.3 RISK ASSESSMENT
- 2.4 LIMITATIONS
- 2.5 IMPACT OF RECESSION
- 2.6 MARKET BREAKDOWN AND DATA TRIANGULATION
- FIGURE 8 DATA TRIANGULATION METHODOLOGY
3 EXECUTIVE SUMMARY
- TABLE 1 GAS ENGINES MARKET SNAPSHOT
- FIGURE 9 NATURAL GAS TO ACCOUNT FOR LARGEST SHARE OF GAS ENGINES MARKET FROM 2024 TO 2029
- FIGURE 10 ABOVE 15 MW SEGMENT TO LEAD GAS ENGINES MARKET, BY POWER OUTPUT, FROM 2024 TO 2029
- FIGURE 11 MECHANICAL DRIVE APPLICATION TO DOMINATE GAS ENGINES MARKET FROM 2024 TO 2029
- FIGURE 12 UTILITIES TO BE LARGEST END-USE INDUSTRY FROM 2024 TO 2029
- FIGURE 13 ASIA PACIFIC DOMINATED GAS ENGINES MARKET IN 2023
4 PREMIUM INSIGHTS
- 4.1 ATTRACTIVE OPPORTUNITIES IN GAS ENGINES MARKET
- FIGURE 14 EMISSION REGULATIONS AND ENVIRONMENTAL CONCERNS OVER CONVENTIONAL ENERGY TO DRIVE GAS ENGINES MARKET
- 4.2 ASIA PACIFIC: GAS ENGINES MARKET, BY END-USE INDUSTRY AND COUNTRY
- FIGURE 15 MARINE END-USE INDUSTRY AND CHINA HELD LARGEST SHARE OF GAS ENGINES MARKET IN ASIA PACIFIC IN 2023
- 4.3 GAS ENGINES MARKET, BY FUEL TYPE
- FIGURE 16 NATURAL GAS TO ACCOUNT FOR MAJOR SHARE BY 2029
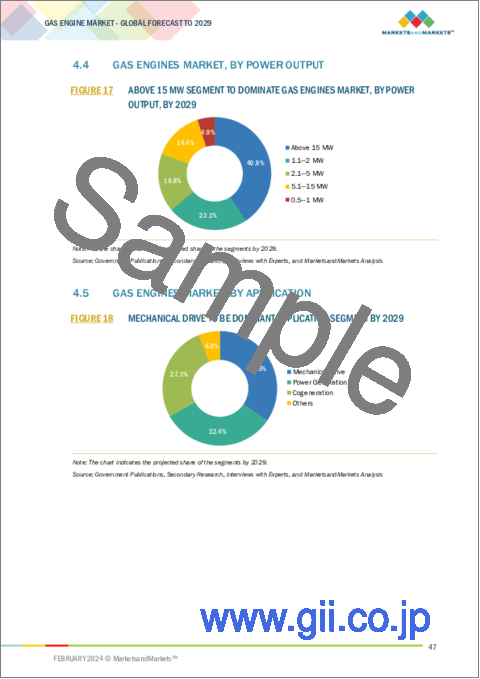
- 4.4 GAS ENGINES MARKET, BY POWER OUTPUT
- FIGURE 17 ABOVE 15 MW SEGMENT TO DOMINATE GAS ENGINES MARKET, BY POWER OUTPUT, BY 2029
- 4.5 GAS ENGINES MARKET, BY APPLICATION
- FIGURE 18 MECHANICAL DRIVE TO BE DOMINANT APPLICATION SEGMENT BY 2029
- 4.6 GAS ENGINES MARKET, BY END-USE INDUSTRY
- FIGURE 19 UTILITIES END-USE INDUSTRY TO COMMAND MARKET BY 2029
- 4.7 GAS ENGINES MARKET, BY REGION
- FIGURE 20 EUROPEAN MARKET TO REGISTER HIGHEST CAGR DURING FORECAST PERIOD
5 MARKET OVERVIEW
- 5.1 INTRODUCTION
- 5.2 MARKET DYNAMICS
- FIGURE 21 GAS ENGINES MARKET: DRIVERS, RESTRAINTS, OPPORTUNITIES, AND CHALLENGES
- 5.2.1 DRIVERS
- 5.2.1.1 Trend toward clean and efficient power generation
- FIGURE 22 NATURAL GAS CONSUMPTION, 2012-2022
- TABLE 2 CO2 EMISSION LEVELS (PER MILLION BTU OF ENERGY)
- 5.2.1.2 Stringent emission regulations
- FIGURE 23 GLOBAL CARBON DIOXIDE EMISSIONS, 2017-2022
- 5.2.1.3 Advancements in gas engine technology
- FIGURE 24 MINIMUM AVERAGE EFFICIENCY OF CHP SYSTEMS, BY POWER SOURCE
- 5.2.1.4 Integration of renewable energy sources
- 5.2.2 RESTRAINTS
- 5.2.2.1 Policy and regulatory uncertainty
- 5.2.2.2 Fluctuating gas prices
- 5.2.3 OPPORTUNITIES
- 5.2.3.1 Evolving landscape of coal, gas, and nuclear energy
- 5.2.3.2 Adoption of natural gas as transition fuel
- 5.2.3.3 Leveraging potential of biogas and landfill gas
- 5.2.4 CHALLENGES
- 5.2.4.1 Infrastructural shortcomings
- 5.2.4.2 Ensuring long-term sustainability
- 5.3 TRENDS/DISRUPTIONS IMPACTING CUSTOMER BUSINESS
- 5.3.1 REVENUE SHIFT AND NEW REVENUE POCKETS FOR GAS ENGINE PROVIDERS
- FIGURE 25 REVENUE SHIFT FOR GAS ENGINE PROVIDERS
- 5.4 MARKET MAP
- FIGURE 26 GAS ENGINES MARKET MAP
- TABLE 3 GAS ENGINES MARKET: ROLE IN ECOSYSTEM
- 5.5 VALUE CHAIN ANALYSIS
- FIGURE 27 VALUE CHAIN ANALYSIS: GAS ENGINES MARKET
- 5.5.1 RAW MATERIAL PROVIDERS/SUPPLIERS
- 5.5.2 COMPONENT MANUFACTURERS
- 5.5.3 GAS ENGINE MANUFACTURERS/ASSEMBLERS
- 5.5.4 DISTRIBUTORS
- 5.5.5 END USERS
- 5.5.6 POST-SALE SERVICES
- 5.6 PRICING ANALYSIS
- 5.6.1 AVERAGE SELLING PRICE TREND OF KEY PLAYERS, BY POWER OUTPUT
- TABLE 4 AVERAGE SELLING PRICE OF GAS ENGINES, 2022
- 5.6.2 AVERAGE SELLING PRICE TREND, BY REGION
- TABLE 5 AVERAGE SELLING PRICE OF GAS ENGINES, 2023-2029
- FIGURE 28 AVERAGE SELLING PRICE OF GAS ENGINES, BY REGION
- 5.7 INVESTMENT AND FUNDING SCENARIO
- FIGURE 29 INVESTMENT AND FUNDING SCENARIO, BY COMPANY
- 5.8 TRADE ANALYSIS
- 5.8.1 TRADE ANALYSIS RELATED TO ENGINES AND MOTORS
- 5.8.1.1 Import scenario
- TABLE 6 IMPORT SCENARIO FOR HS CODE 841280, BY COUNTRY, 2020-2022 (USD THOUSAND)
- FIGURE 30 IMPORT DATA FOR HS CODE 841280-ENGINES & MOTORS, BY COUNTRY, 2020-2022 (USD THOUSAND)
- 5.8.1.2 Export scenario
- TABLE 7 EXPORT SCENARIO FOR HS CODE 841280, BY COUNTRY, 2020-2022 (USD THOUSAND)
- FIGURE 31 EXPORT DATA FOR HS CODE 841280-ENGINES & MOTORS, BY COUNTRY, 2020-2022 (USD THOUSAND)
- 5.8.1 TRADE ANALYSIS RELATED TO ENGINES AND MOTORS
- 5.9 TARIFFS, CODES, AND REGULATIONS
- 5.9.1 TARIFFS RELATED TO GAS ENGINES
- TABLE 8 IMPORT TARIFFS FOR HS 841280 ENGINES AND MOTORS NES IN 2022
- 5.9.2 REGULATORY BODIES, GOVERNMENT AGENCIES, AND OTHER ORGANIZATIONS
- TABLE 9 NORTH AMERICA: REGULATORY BODIES, GOVERNMENT AGENCIES, AND OTHER ORGANIZATIONS
- TABLE 10 EUROPE: REGULATORY BODIES, GOVERNMENT AGENCIES, AND OTHER ORGANIZATIONS
- TABLE 11 ASIA PACIFIC: REGULATORY BODIES, GOVERNMENT AGENCIES, AND OTHER ORGANIZATIONS
- TABLE 12 GLOBAL: REGULATORY BODIES, GOVERNMENT AGENCIES, AND OTHER ORGANIZATIONS
- 5.10 PATENT ANALYSIS
- FIGURE 32 PATENT ANALYSIS
- TABLE 14 GAS ENGINES: PATENT ANALYSIS, MARCH 2020-SEPTEMBER 2023
- 5.11 KEY CONFERENCES AND EVENTS, 2024-2025
- TABLE 15 GAS ENGINES MARKET: KEY CONFERENCES AND EVENTS
- 5.12 PORTER'S FIVE FORCES ANALYSIS
- FIGURE 33 PORTER'S FIVE FORCES ANALYSIS FOR GAS ENGINES MARKET
- TABLE 16 GAS ENGINES MARKET: PORTER'S FIVE FORCES ANALYSIS
- 5.12.1 THREAT OF SUBSTITUTES
- 5.12.2 BARGAINING POWER OF SUPPLIERS
- 5.12.3 BARGAINING POWER OF BUYERS
- 5.12.4 THREAT OF NEW ENTRANTS
- 5.12.5 INTENSITY OF COMPETITIVE RIVALRY
- 5.13 CASE STUDY ANALYSIS
- 5.13.1 SIEMENS ENERGY SOLVES UK NATIONAL GRID'S PEAK POWER CHALLENGE WITH CLEANER TECHNOLOGY
- 5.13.1.1 Problem statement
- 5.13.1.2 Solution
- 5.13.2 CLARK UNIVERSITY INCREASES COST SAVINGS WITH RELIABLE COGENERATION SOLUTION
- 5.13.2.1 Problem statement
- 5.13.2.2 Solution
- 5.13.3 JENBACHER J420 ENGINE HARNESSES HYDROGEN ENERGY
- 5.13.3.1 Problem statement
- 5.13.3.2 Solution
- 5.13.1 SIEMENS ENERGY SOLVES UK NATIONAL GRID'S PEAK POWER CHALLENGE WITH CLEANER TECHNOLOGY
- 5.14 TECHNOLOGY ANALYSIS
- 5.14.1 KEY TECHNOLOGY
- 5.14.1.1 Direct Fuel Injection
- 5.14.2 COMPLEMENTARY TECHNOLOGY
- 5.14.2.1 Integration of combined heat and power systems
- 5.14.1 KEY TECHNOLOGY
- 5.15 KEY STAKEHOLDERS AND BUYING CRITERIA
- 5.15.1 STAKEHOLDERS IN BUYING PROCESS
- FIGURE 34 INFLUENCE OF STAKEHOLDERS ON BUYING PROCESS, BY END-USE INDUSTRY
- TABLE 17 INFLUENCE OF STAKEHOLDERS ON BUYING PROCESS, BY END-USE INDUSTRY
- 5.15.2 BUYING CRITERIA
- FIGURE 35 KEY BUYING CRITERIA, BY END-USE INDUSTRY
- TABLE 18 KEY BUYING CRITERIA, BY END-USE INDUSTRY
6 GAS ENGINES MARKET, BY FUEL TYPE
- 6.1 INTRODUCTION
- FIGURE 36 GAS ENGINES MARKET, BY FUEL TYPE, 2023
- TABLE 19 GAS ENGINES MARKET, BY FUEL TYPE, 2020-2023 (USD MILLION)
- TABLE 20 GAS ENGINES MARKET, BY FUEL TYPE, 2024-2029 (USD MILLION)
- 6.2 NATURAL GAS
- 6.2.1 USE AS PRIMARY FUEL IN POWER GENERATION TO BOOST GROWTH
- TABLE 21 NATURAL GAS: GAS ENGINES MARKET, BY REGION, 2020-2023 (USD MILLION)
- TABLE 22 NATURAL GAS: GAS ENGINES MARKET, BY REGION, 2024-2029 (USD MILLION)
- 6.3 SPECIAL GAS
- 6.3.1 USE IN COGENERATION AND TRIGENERATION - KEY DRIVER
- TABLE 23 SPECIAL GAS: GAS ENGINES MARKET, BY REGION, 2020-2023 (USD MILLION)
- TABLE 24 SPECIAL GAS: GAS ENGINES MARKET, BY REGION, 2024-2029 (USD MILLION)
- 6.4 OTHERS
- TABLE 25 OTHER GASES: GAS ENGINES MARKET, BY REGION, 2020-2023 (USD MILLION)
- TABLE 26 OTHER GASES: GAS ENGINES MARKET, BY REGION, 2024-2029 (USD MILLION)
7 GAS ENGINES MARKET, BY POWER OUTPUT
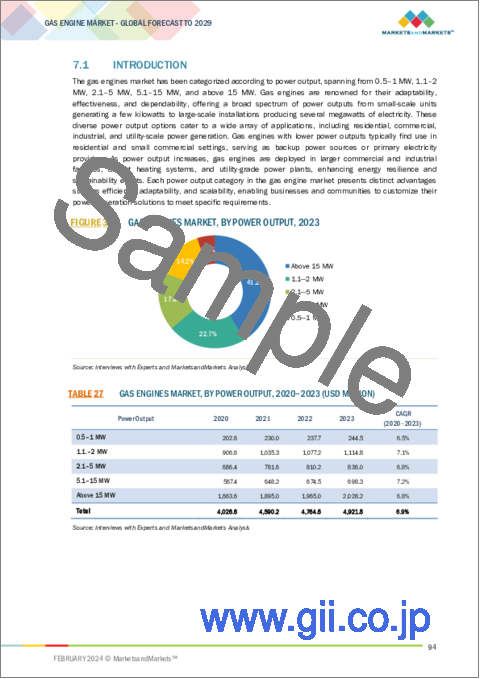
- 7.1 INTRODUCTION
- FIGURE 37 GAS ENGINES MARKET, BY POWER OUTPUT, 2023
- TABLE 27 GAS ENGINES MARKET, BY POWER OUTPUT, 2020-2023 (USD MILLION)
- TABLE 28 GAS ENGINES MARKET, BY POWER OUTPUT, 2024-2029 (USD MILLION)
- TABLE 29 GAS ENGINES MARKET, BY POWER OUTPUT, 2020-2023 (UNITS)
- TABLE 30 GAS ENGINES MARKET, BY POWER OUTPUT, 2024-2029 (UNITS)
- 7.2 0.5-1 MW
- 7.2.1 USED WIDELY IN COMMERCIAL AND INDUSTRIAL SETTINGS
- TABLE 31 0.5-1 MW: GAS ENGINES MARKET, BY REGION, 2020-2023 (USD MILLION)
- TABLE 32 0.5-1 MW: GAS ENGINES MARKET, BY REGION, 2024-2029 (USD MILLION)
- TABLE 33 0.5-1 MW: GAS ENGINES MARKET, BY REGION, 2020-2023 (UNITS)
- TABLE 34 0.5-1 MW: GAS ENGINES MARKET, BY REGION, 2024-2029 (UNITS)
- 7.3 1.1-2 MW
- 7.3.1 CONTRIBUTE TO ENERGY EFFICIENCY AND GRID STABILITY
- TABLE 35 1.1-2 MW: GAS ENGINES MARKET, BY REGION, 2020-2023 (USD MILLION)
- TABLE 36 1.1-2 MW: GAS ENGINES MARKET, BY REGION, 2024-2029 (USD MILLION)
- TABLE 37 1.1-2 MW: GAS ENGINES MARKET, BY REGION, 2020-2023 (UNITS)
- TABLE 38 1.1-2 MW: GAS ENGINES MARKET, BY REGION, 2024-2029 (UNITS)
- 7.4 2.1-5 MW
- 7.4.1 PROVIDE RELIABLE, EFFICIENT, AND FLEXIBLE POWER GENERATION SOLUTIONS
- TABLE 39 2.1-5 MW: GAS ENGINES MARKET, BY REGION, 2020-2023 (USD MILLION)
- TABLE 40 2.1-5 MW: GAS ENGINES MARKET, BY REGION, 2024-2029 (USD MILLION)
- TABLE 41 2.1-5 MW: GAS ENGINES MARKET, BY REGION, 2020-2023 (UNITS)
- TABLE 42 2.1-5 MW: GAS ENGINES MARKET, BY REGION, 2024-2029 (UNITS)
- 7.5 5.1-15 MW
- 7.5.1 EMPOWER LARGE-SCALE ENERGY SOLUTIONS
- TABLE 43 5.1-15 MW: GAS ENGINES MARKET, BY REGION, 2020-2023 (USD MILLION)
- TABLE 44 5.1-15 MW: GAS ENGINES MARKET, BY REGION, 2024-2029 (USD MILLION)
- TABLE 45 5.1-15 MW: GAS ENGINES MARKET, BY REGION, 2020-2023 (UNITS)
- TABLE 46 5.1-15 MW: GAS ENGINES MARKET, BY REGION, 2024-2029 (UNITS)
- 7.6 ABOVE 15 MW
- 7.6.1 MAXIMIZE EFFICIENCY AND MINIMIZE ENVIRONMENTAL IMPACT
- TABLE 47 ABOVE 15 MW: GAS ENGINES MARKET, BY REGION, 2020-2023 (USD MILLION)
- TABLE 48 ABOVE 15 MW: GAS ENGINES MARKET, BY REGION, 2024-2029 (USD MILLION)
- TABLE 49 ABOVE 15 MW: GAS ENGINES MARKET, BY REGION, 2020-2023 (UNITS)
- TABLE 50 ABOVE 15 MW: GAS ENGINES MARKET, BY REGION, 2024-2029 (UNITS)
8 GAS ENGINES MARKET, BY APPLICATION
- 8.1 INTRODUCTION
- FIGURE 38 GAS ENGINES MARKET, BY APPLICATION, 2023
- TABLE 51 GAS ENGINES MARKET, BY APPLICATION, 2020-2023 (USD MILLION)
- TABLE 52 GAS ENGINES MARKET, BY APPLICATION, 2024-2029 (USD MILLION)
- 8.2 POWER GENERATION
- 8.2.1 HELPS IN CONTINUOUS BASELOAD SUPPLY TO BACKUP POWER DURING EMERGENCIES
- TABLE 53 POWER GENERATION: GAS ENGINES MARKET, BY REGION, 2020-2023 (USD MILLION)
- TABLE 54 POWER GENERATION: GAS ENGINES MARKET, BY REGION, 2024-2029 (USD MILLION)
- 8.3 COGENERATION
- 8.3.1 CATERS TO DIVERSE RANGE OF EFFICIENT AND SUSTAINABLE ENERGY SOLUTIONS
- TABLE 55 COGENERATION: GAS ENGINES MARKET, BY REGION, 2020-2023 (USD MILLION)
- TABLE 56 COGENERATION: GAS ENGINES MARKET, BY REGION, 2024-2029 (USD MILLION)
- 8.4 MECHANICAL DRIVE
- 8.4.1 SERVES DIVERSE INDUSTRIES, CONTRIBUTING TO EFFICIENT AND RELIABLE OPERATION
- TABLE 57 MECHANICAL DRIVE: GAS ENGINES MARKET, BY REGION, 2020-2023 (USD MILLION)
- TABLE 58 MECHANICAL DRIVE: GAS ENGINES MARKET, BY REGION, 2024-2029 (USD MILLION)
- 8.5 OTHERS
- TABLE 59 OTHER APPLICATIONS: GAS ENGINES MARKET, BY REGION, 2020-2023 (USD MILLION)
- TABLE 60 OTHER APPLICATIONS: GAS ENGINES MARKET, BY REGION, 2024-2029 (USD MILLION)
9 GAS ENGINES MARKET, BY END-USE INDUSTRY
- 9.1 INTRODUCTION
- FIGURE 39 GAS ENGINES MARKET, BY END-USE INDUSTRY, 2023
- TABLE 61 GAS ENGINES MARKET, BY END-USE INDUSTRY, 2020-2023 (USD MILLION)
- TABLE 62 GAS ENGINES MARKET, BY END-USE INDUSTRY, 2024-2029 (USD MILLION)
- 9.2 UTILITIES
- 9.2.1 DEMAND FOR GAS ENGINES IN POWER PLANTS, INDUSTRIAL FACILITIES, COMMERCIAL BUILDINGS
- TABLE 63 UTILITIES: GAS ENGINES MARKET, BY REGION, 2020-2023 (USD MILLION)
- TABLE 64 UTILITIES: GAS ENGINES MARKET, BY REGION, 2024-2029 (USD MILLION)
- 9.3 MANUFACTURING
- 9.3.1 DEMAND IN MANUFACTURING FOR EMISSION REDUCTION AND POWER GENERATION
- TABLE 65 MANUFACTURING: GAS ENGINES MARKET, BY REGION, 2020-2023 (USD MILLION)
- TABLE 66 MANUFACTURING: GAS ENGINES MARKET, BY REGION, 2024-2029 (USD MILLION)
- 9.4 MARINE
- 9.4.1 DEMAND IN MARINE SEGMENT FOR HYBRID PROPULSION SYSTEM AND EMERGENCY BACKUP POWER
- TABLE 67 MARINE: GAS ENGINES MARKET, BY REGION, 2020-2023 (USD MILLION)
- TABLE 68 MARINE: GAS ENGINES MARKET, BY REGION, 2024-2029 (USD MILLION)
- 9.5 OIL & GAS
- 9.5.1 DEMAND IN OIL & GAS SEGMENT TO MEET FUEL EFFICIENCY REQUIREMENTS
- TABLE 69 OIL & GAS: GAS ENGINES MARKET, BY REGION, 2020-2023 (USD MILLION)
- TABLE 70 OIL & GAS: GAS ENGINES MARKET, BY REGION, 2024-2029 (USD MILLION)
- 9.6 OTHERS
- TABLE 71 OTHER END-USE INDUSTRIES: GAS ENGINES MARKET, BY REGION, 2020-2023 (USD MILLION)
- TABLE 72 OTHER END-USE INDUSTRIES: GAS ENGINES MARKET, BY REGION, 2024-2029 (USD MILLION)
10 GAS ENGINES MARKET, BY REGION
- 10.1 INTRODUCTION
- FIGURE 40 GAS ENGINES MARKET SHARE, BY REGION, 2023 (%)
- FIGURE 41 GAS ENGINES MARKET IN EUROPE TO RECORD HIGHEST CAGR DURING FORECAST PERIOD
- TABLE 73 GAS ENGINES MARKET, BY REGION, 2020-2023 (USD MILLION)
- TABLE 74 GAS ENGINES MARKET, BY REGION, 2024-2029 (USD MILLION)
- 10.2 ASIA PACIFIC
- FIGURE 42 ASIA PACIFIC: GAS ENGINES MARKET SNAPSHOT
- 10.2.1 BY FUEL TYPE
- TABLE 75 ASIA PACIFIC: GAS ENGINES MARKET, BY FUEL TYPE, 2020-2023 (USD MILLION)
- TABLE 76 ASIA PACIFIC: GAS ENGINES MARKET, BY FUEL TYPE, 2024-2029 (USD MILLION)
- 10.2.2 BY POWER OUTPUT
- TABLE 77 ASIA PACIFIC: GAS ENGINES MARKET, BY POWER OUTPUT, 2020-2023 (USD MILLION)
- TABLE 78 ASIA PACIFIC: GAS ENGINES MARKET, BY POWER OUTPUT, 2024-2029 (USD MILLION)
- TABLE 79 ASIA PACIFIC: GAS ENGINES MARKET, BY POWER OUTPUT, 2020-2023 (UNITS)
- TABLE 80 ASIA PACIFIC: GAS ENGINES MARKET, BY POWER OUTPUT, 2024-2029 (UNITS)
- 10.2.3 BY APPLICATION
- TABLE 81 ASIA PACIFIC: GAS ENGINES MARKET, BY APPLICATION, 2020-2023 (USD MILLION)
- TABLE 82 ASIA PACIFIC: GAS ENGINES MARKET, BY APPLICATION, 2024-2029 (USD MILLION)
- 10.2.4 BY END-USE INDUSTRY
- TABLE 83 ASIA PACIFIC: GAS ENGINES MARKET, BY END-USE INDUSTRY, 2020-2023 (USD MILLION)
- TABLE 84 ASIA PACIFIC: GAS ENGINES MARKET, BY END-USE INDUSTRY, 2024-2029 (USD MILLION)
- 10.2.5 BY COUNTRY
- TABLE 85 ASIA PACIFIC: GAS ENGINES MARKET, BY COUNTRY, 2020-2023 (USD MILLION)
- TABLE 86 ASIA PACIFIC: GAS ENGINES MARKET, BY COUNTRY, 2024-2029 (USD MILLION)
- 10.2.5.1 China
- 10.2.5.1.1 Largest country-level market in region
- 10.2.5.1 China
- TABLE 87 CHINA: GAS ENGINES MARKET, BY FUEL TYPE, 2020-2023 (USD MILLION)
- TABLE 88 CHINA: GAS ENGINES MARKET, BY FUEL TYPE, 2024-2029 (USD MILLION)
- TABLE 89 CHINA: GAS ENGINES MARKET, BY POWER OUTPUT, 2020-2023 (USD MILLION)
- TABLE 90 CHINA: GAS ENGINES MARKET, BY POWER OUTPUT, 2024-2029 (USD MILLION)
- 10.2.5.2 India
- 10.2.5.2.1 Government initiatives to drive market growth
- 10.2.5.2 India
- TABLE 91 INDIA: GAS ENGINES MARKET, BY FUEL TYPE, 2020-2023 (USD MILLION)
- TABLE 92 INDIA: GAS ENGINES MARKET, BY FUEL TYPE, 2024-2029 (USD MILLION)
- TABLE 93 INDIA: GAS ENGINES MARKET, BY POWER OUTPUT, 2020-2023 (USD MILLION)
- TABLE 94 INDIA: GAS ENGINES MARKET, BY POWER OUTPUT, 2024-2029 (USD MILLION)
- 10.2.5.3 Japan
- 10.2.5.3.1 Mature market driven by stringent environmental regulations
- 10.2.5.3 Japan
- TABLE 95 JAPAN: GAS ENGINES MARKET, BY FUEL TYPE, 2020-2023 (USD MILLION)
- TABLE 96 JAPAN: GAS ENGINES MARKET, BY FUEL TYPE, 2024-2029 (USD MILLION)
- TABLE 97 JAPAN: GAS ENGINES MARKET, BY POWER OUTPUT, 2020-2023 (USD MILLION)
- TABLE 98 JAPAN: GAS ENGINES MARKET, BY POWER OUTPUT, 2024-2029 (USD MILLION)
- 10.2.5.4 Rest of Asia Pacific
- TABLE 99 REST OF ASIA PACIFIC: GAS ENGINES MARKET, BY FUEL TYPE, 2020-2023 (USD MILLION)
- TABLE 100 REST OF ASIA PACIFIC: GAS ENGINES MARKET, BY FUEL TYPE, 2024-2029 (USD MILLION)
- TABLE 101 REST OF ASIA PACIFIC: GAS ENGINES MARKET, BY POWER OUTPUT, 2020-2023 (USD MILLION)
- TABLE 102 REST OF ASIA PACIFIC: GAS ENGINES MARKET, BY POWER OUTPUT, 2024-2029 (USD MILLION)
- 10.3 EUROPE
- FIGURE 43 EUROPEAN GAS ENGINES MARKET SNAPSHOT
- 10.3.1 BY FUEL TYPE
- TABLE 103 EUROPE: GAS ENGINES MARKET, BY FUEL TYPE, 2020-2023 (USD MILLION)
- TABLE 104 EUROPE: GAS ENGINES MARKET, BY FUEL TYPE, 2024-2029 (USD MILLION)
- 10.3.2 BY POWER OUTPUT
- TABLE 105 EUROPE: GAS ENGINES MARKET, BY POWER OUTPUT, 2020-2023 (USD MILLION)
- TABLE 106 EUROPE: GAS ENGINES MARKET, BY POWER OUTPUT, 2024-2029 (USD MILLION)
- TABLE 107 EUROPE: GAS ENGINES MARKET, BY POWER OUTPUT, 2020-2023 (UNITS)
- TABLE 108 EUROPE: GAS ENGINES MARKET, BY POWER OUTPUT, 2024-2029 (UNITS)
- 10.3.3 BY APPLICATION
- TABLE 109 EUROPE: GAS ENGINES MARKET, BY APPLICATION, 2020-2023 (USD MILLION)
- TABLE 110 EUROPE: GAS ENGINES MARKET, BY APPLICATION, 2024-2029 (USD MILLION)
- 10.3.4 BY END-USE INDUSTRY
- TABLE 111 EUROPE: GAS ENGINES MARKET, BY END-USE INDUSTRY, 2020-2023 (USD MILLION)
- TABLE 112 EUROPE: GAS ENGINES MARKET, BY END-USE INDUSTRY, 2024-2029 (USD MILLION)
- 10.3.5 BY COUNTRY
- TABLE 113 EUROPE: GAS ENGINES MARKET, BY COUNTRY, 2020-2023 (USD MILLION)
- TABLE 114 EUROPE: GAS ENGINES MARKET, BY COUNTRY, 2024-2029 (USD MILLION)
- 10.3.5.1 Germany
- 10.3.5.1.1 Role of gas engines in Germany's energy mix: Balancing security, efficiency, and renewables
- 10.3.5.1 Germany
- TABLE 115 GERMANY: GAS ENGINES MARKET, BY FUEL TYPE, 2020-2023 (USD MILLION)
- TABLE 116 GERMANY: GAS ENGINES MARKET, BY FUEL TYPE, 2024-2029 (USD MILLION)
- TABLE 117 GERMANY: GAS ENGINES MARKET, BY POWER OUTPUT, 2020-2023 (USD MILLION)
- TABLE 118 GERMANY: GAS ENGINES MARKET, BY POWER OUTPUT, 2024-2029 (USD MILLION)
- 10.3.5.2 UK
- 10.3.5.2.1 Financial incentives for clean energy boost market
- 10.3.5.2 UK
- TABLE 119 UK: GAS ENGINES MARKET, BY FUEL TYPE, 2020-2023 (USD MILLION)
- TABLE 120 UK: GAS ENGINES MARKET, BY FUEL TYPE, 2024-2029 (USD MILLION)
- TABLE 121 UK: GAS ENGINES MARKET, BY POWER OUTPUT, 2020-2023 (USD MILLION)
- TABLE 122 UK: GAS ENGINES MARKET, BY POWER OUTPUT, 2024-2029 (USD MILLION)
- 10.3.5.3 Russia
- 10.3.5.3.1 Rising demand for cogeneration power to fuel market
- 10.3.5.3 Russia
- TABLE 123 RUSSIA: GAS ENGINES MARKET, BY FUEL TYPE, 2020-2023 (USD MILLION)
- TABLE 124 RUSSIA: GAS ENGINES MARKET, BY FUEL TYPE, 2024-2029 (USD MILLION)
- TABLE 125 RUSSIA: GAS ENGINES MARKET, BY POWER OUTPUT, 2020-2023 (USD MILLION)
- TABLE 126 RUSSIA: GAS ENGINES MARKET, BY POWER OUTPUT, 2024-2029 (USD MILLION)
- 10.3.5.4 Italy
- 10.3.5.4.1 Increasing demand for higher overall energy efficiency to drive market
- 10.3.5.4 Italy
- TABLE 127 ITALY: GAS ENGINES MARKET, BY FUEL TYPE, 2020-2023 (USD MILLION)
- TABLE 128 ITALY: GAS ENGINES MARKET, BY FUEL TYPE, 2024-2029 (USD MILLION)
- TABLE 129 ITALY: GAS ENGINES MARKET, BY POWER OUTPUT, 2020-2023 (USD MILLION)
- TABLE 130 ITALY: GAS ENGINES MARKET, BY POWER OUTPUT, 2024-2029 (USD MILLION)
- 10.3.5.5 France
- 10.3.5.5.1 Increasing demand for gas-fired power plants to support electricity grid
- 10.3.5.5 France
- TABLE 131 FRANCE: GAS ENGINES MARKET, BY FUEL TYPE, 2020-2023 (USD MILLION)
- TABLE 132 FRANCE: GAS ENGINES MARKET, BY FUEL TYPE, 2024-2029 (USD MILLION)
- TABLE 133 FRANCE: GAS ENGINES MARKET, BY POWER OUTPUT, 2020-2023 (USD MILLION)
- TABLE 134 FRANCE: GAS ENGINES MARKET, BY POWER OUTPUT, 2024-2029 (USD MILLION)
- 10.3.5.6 Rest of Europe
- TABLE 135 REST OF EUROPE: GAS ENGINES MARKET, BY FUEL TYPE, 2020-2023 (USD MILLION)
- TABLE 136 REST OF EUROPE: GAS ENGINES MARKET, BY FUEL TYPE, 2024-2029 (USD MILLION)
- TABLE 137 REST OF EUROPE: GAS ENGINES MARKET, BY POWER OUTPUT, 2020-2023 (USD MILLION)
- TABLE 138 REST OF EUROPE: GAS ENGINES MARKET, BY POWER OUTPUT, 2024-2029 (USD MILLION)
- 10.4 NORTH AMERICA
- 10.4.1 BY FUEL TYPE
- TABLE 139 NORTH AMERICA: GAS ENGINES MARKET, BY FUEL TYPE, 2020-2023 (USD MILLION)
- TABLE 140 NORTH AMERICA: GAS ENGINES MARKET, BY FUEL TYPE, 2024-2029 (USD MILLION)
- 10.4.2 BY POWER OUTPUT
- TABLE 141 NORTH AMERICA: GAS ENGINES MARKET, BY POWER OUTPUT, 2020-2023 (USD MILLION)
- TABLE 142 NORTH AMERICA: GAS ENGINES MARKET, BY POWER OUTPUT, 2024-2029 (USD MILLION)
- TABLE 143 NORTH AMERICA: GAS ENGINES MARKET, BY POWER OUTPUT, 2020-2023 (UNITS)
- TABLE 144 NORTH AMERICA: GAS ENGINES MARKET, BY POWER OUTPUT, 2024-2029 (UNITS)
- 10.4.3 BY APPLICATION
- TABLE 145 NORTH AMERICA: GAS ENGINES MARKET, BY APPLICATION, 2020-2023 (USD MILLION)
- TABLE 146 NORTH AMERICA: GAS ENGINES MARKET, BY APPLICATION, 2024-2029 (USD MILLION)
- 10.4.4 BY END-USE INDUSTRY
- TABLE 147 NORTH AMERICA: GAS ENGINES MARKET, BY END-USE INDUSTRY, 2020-2023 (USD MILLION)
- TABLE 148 NORTH AMERICA: GAS ENGINES MARKET, BY END-USE INDUSTRY, 2024-2029 (USD MILLION)
- 10.4.5 BY COUNTRY
- TABLE 149 NORTH AMERICA: GAS ENGINES MARKET, BY COUNTRY, 2020-2023 (USD MILLION)
- TABLE 150 NORTH AMERICA: GAS ENGINES MARKET, BY COUNTRY, 2024-2029 (USD MILLION)
- 10.4.5.1 US
- 10.4.5.1.1 Government policies for replacement of coal-fired power plants with gas-fired plants to drive market
- 10.4.5.1 US
- TABLE 151 US: GAS ENGINES MARKET, BY FUEL TYPE, 2020-2023 (USD MILLION)
- TABLE 152 US: GAS ENGINES MARKET, BY FUEL TYPE, 2024-2029 (USD MILLION)
- TABLE 153 US: GAS ENGINES MARKET, BY POWER OUTPUT, 2020-2023 (USD MILLION)
- TABLE 154 US: GAS ENGINES MARKET, BY POWER OUTPUT, 2024-2029 (USD MILLION)
- 10.4.5.2 Canada
- 10.4.5.2.1 Increasing cogeneration applications to propel market
- 10.4.5.2 Canada
- TABLE 155 CANADA: GAS ENGINES MARKET, BY FUEL TYPE, 2020-2023 (USD MILLION)
- TABLE 156 CANADA: GAS ENGINES MARKET, BY FUEL TYPE, 2024-2029 (USD MILLION)
- TABLE 157 CANADA: GAS ENGINES MARKET, BY POWER OUTPUT, 2020-2023 (USD MILLION)
- TABLE 158 CANADA: GAS ENGINES MARKET, BY POWER OUTPUT, 2024-2029 (USD MILLION)
- 10.4.5.3 Mexico
- 10.4.5.3.1 Energy transition for improved efficiency to drive market growth
- 10.4.5.3 Mexico
- TABLE 159 MEXICO: GAS ENGINES MARKET, BY FUEL TYPE, 2020-2023 (USD MILLION)
- TABLE 160 MEXICO: GAS ENGINES MARKET, BY FUEL TYPE, 2024-2029 (USD MILLION)
- TABLE 161 MEXICO: GAS ENGINES MARKET, BY POWER OUTPUT, 2020-2023 (USD MILLION)
- TABLE 162 MEXICO: GAS ENGINES MARKET, BY POWER OUTPUT, 2024-2029 (USD MILLION)
- 10.5 SOUTH AMERICA
- 10.5.1 BY FUEL TYPE
- TABLE 163 SOUTH AMERICA: GAS ENGINES MARKET, BY FUEL TYPE, 2020-2023 (USD MILLION)
- TABLE 164 SOUTH AMERICA: GAS ENGINES MARKET, BY FUEL TYPE, 2024-2029 (USD MILLION)
- 10.5.2 BY POWER OUTPUT
- TABLE 165 SOUTH AMERICA: GAS ENGINES MARKET, BY POWER OUTPUT, 2020-2023 (USD MILLION)
- TABLE 166 SOUTH AMERICA: GAS ENGINES MARKET, BY POWER OUTPUT, 2024-2029 (USD MILLION)
- TABLE 167 SOUTH AMERICA: GAS ENGINES MARKET, BY POWER OUTPUT, 2020-2023 (UNITS)
- TABLE 168 SOUTH AMERICA: GAS ENGINES MARKET, BY POWER OUTPUT, 2024-2029 (UNITS)
- 10.5.3 BY APPLICATION
- TABLE 169 SOUTH AMERICA: GAS ENGINES MARKET, BY APPLICATION, 2020-2023 (USD MILLION)
- TABLE 170 SOUTH AMERICA: GAS ENGINES MARKET, BY APPLICATION, 2024-2029 (USD MILLION)
- 10.5.4 BY END-USE INDUSTRY
- TABLE 171 SOUTH AMERICA: GAS ENGINES MARKET, BY END-USE INDUSTRY, 2020-2023 (USD MILLION)
- TABLE 172 SOUTH AMERICA: GAS ENGINES MARKET, BY END-USE INDUSTRY, 2024-2029 (USD MILLION)
- 10.5.5 BY COUNTRY
- TABLE 173 SOUTH AMERICA: GAS ENGINES MARKET, BY COUNTRY, 2020-2023 (USD MILLION)
- TABLE 174 SOUTH AMERICA: GAS ENGINES MARKET, BY COUNTRY, 2024-2029 (USD MILLION)
- 10.5.5.1 Brazil
- 10.5.5.1.1 Driving forces and dynamics: Abundant reserves, growing demand, and government initiatives
- 10.5.5.1 Brazil
- TABLE 175 BRAZIL: GAS ENGINES MARKET, BY FUEL TYPE, 2020-2023 (USD MILLION)
- TABLE 176 BRAZIL: GAS ENGINES MARKET, BY FUEL TYPE, 2024-2029 (USD MILLION)
- TABLE 177 BRAZIL: GAS ENGINES MARKET, BY POWER OUTPUT, 2020-2023 (USD MILLION)
- TABLE 178 BRAZIL: GAS ENGINES MARKET, BY POWER OUTPUT, 2024-2029 (USD MILLION)
- 10.5.5.2 Argentina
- 10.5.5.2.1 Abundant reserves, ambitious goals, and regulatory evolution boost market
- 10.5.5.2 Argentina
- TABLE 179 ARGENTINA: GAS ENGINES MARKET, BY FUEL TYPE, 2020-2023 (USD MILLION)
- TABLE 180 ARGENTINA: GAS ENGINES MARKET, BY FUEL TYPE, 2024-2029 (USD MILLION)
- TABLE 181 ARGENTINA: GAS ENGINES MARKET, BY POWER OUTPUT, 2020-2023 (USD MILLION)
- TABLE 182 ARGENTINA: GAS ENGINES MARKET, BY POWER OUTPUT, 2024-2029 (USD MILLION)
- 10.5.5.3 Rest of South America
- TABLE 183 REST OF SOUTH AMERICA: GAS ENGINES MARKET, BY FUEL TYPE, 2020-2023 (USD MILLION)
- TABLE 184 REST OF SOUTH AMERICA: GAS ENGINES MARKET, BY FUEL TYPE, 2024-2029 (USD MILLION)
- TABLE 185 REST OF SOUTH AMERICA: GAS ENGINES MARKET, BY POWER OUTPUT, 2020-2023 (USD MILLION)
- TABLE 186 REST OF SOUTH AMERICA: GAS ENGINES MARKET, BY POWER OUTPUT, 2024-2029 (USD MILLION)
- 10.6 MIDDLE EAST & AFRICA
- 10.6.1 BY FUEL TYPE
- TABLE 187 MIDDLE EAST & AFRICA: GAS ENGINES MARKET, BY FUEL TYPE, 2020-2023 (USD MILLION)
- TABLE 188 MIDDLE EAST & AFRICA: GAS ENGINES MARKET, BY FUEL TYPE, 2024-2029 (USD MILLION)
- 10.6.2 BY POWER OUTPUT
- TABLE 189 MIDDLE EAST & AFRICA: GAS ENGINES MARKET, BY POWER OUTPUT, 2020-2023 (USD MILLION)
- TABLE 190 MIDDLE EAST & AFRICA: GAS ENGINES MARKET, BY POWER OUTPUT, 2024-2029 (USD MILLION)
- TABLE 191 MIDDLE EAST & AFRICA: GAS ENGINES MARKET, BY POWER OUTPUT, 2020-2023 (UNITS)
- TABLE 192 MIDDLE EAST & AFRICA: GAS ENGINES MARKET, BY POWER OUTPUT, 2024-2029 (UNITS)
- 10.6.3 BY APPLICATION
- TABLE 193 MIDDLE EAST & AFRICA: GAS ENGINES MARKET, BY APPLICATION, 2020-2023 (USD MILLION)
- TABLE 194 MIDDLE EAST & AFRICA: GAS ENGINES MARKET, BY APPLICATION, 2024-2029 (USD MILLION)
- 10.6.4 BY END-USE INDUSTRY
- TABLE 195 MIDDLE EAST & AFRICA: GAS ENGINES MARKET, BY END-USE INDUSTRY, 2020-2023 (USD MILLION)
- 10.6.5 BY END-USE INDUSTRY
- TABLE 196 MIDDLE EAST & AFRICA: GAS ENGINES MARKET, BY END-USE INDUSTRY, 2024-2029 (USD MILLION)
- 10.6.6 BY COUNTRY
- TABLE 197 MIDDLE EAST & AFRICA: GAS ENGINES MARKET, BY COUNTRY, 2024-2029 (USD MILLION)
- 10.6.6.1 GCC Countries
- 10.6.6.1.1 Saudi Arabia
- 10.6.6.1.1.1 Expansion in mining and manufacturing sectors propels market growth
- 10.6.6.1.1 Saudi Arabia
- 10.6.6.1 GCC Countries
- TABLE 198 SAUDI ARABIA: GAS ENGINES MARKET, BY FUEL TYPE, 2020-2023 (USD MILLION)
- TABLE 199 SAUDI ARABIA: GAS ENGINES MARKET, BY FUEL TYPE, 2024-2029 (USD MILLION)
- TABLE 200 SAUDI ARABIA: GAS ENGINES MARKET, BY POWER OUTPUT, 2020-2023 (USD MILLION)
- TABLE 201 SAUDI ARABIA: GAS ENGINES MARKET, BY POWER OUTPUT, 2024-2029 (USD MILLION)
- 10.6.6.1.2 UAE
- 10.6.6.1.2.1 Abundant resources and initiatives strategically boost market
- 10.6.6.1.2 UAE
- TABLE 202 UAE: GAS ENGINES MARKET, BY FUEL TYPE, 2020-2023 (USD MILLION)
- TABLE 203 UAE: GAS ENGINES MARKET, BY FUEL TYPE, 2024-2029 (USD MILLION)
- TABLE 204 UAE: GAS ENGINES MARKET, BY POWER OUTPUT, 2020-2023 (USD MILLION)
- TABLE 205 UAE: GAS ENGINES MARKET, BY POWER OUTPUT, 2024-2029 (USD MILLION)
- 10.6.6.1.3 Rest of GCC
- TABLE 206 REST OF GCC: GAS ENGINES MARKET, BY FUEL TYPE, 2024-2029 (USD MILLION)
- TABLE 207 REST OF GCC: GAS ENGINES MARKET, BY POWER OUTPUT, 2024-2029 (USD MILLION)
- 10.6.6.2 Egypt
- 10.6.6.2.1 Increasing gas production and diversified power generation to fuel market
- 10.6.6.2 Egypt
- TABLE 208 EGYPT: GAS ENGINES MARKET, BY FUEL TYPE, 2020-2023 (USD MILLION)
- TABLE 209 EGYPT: GAS ENGINES MARKET, BY FUEL TYPE, 2024-2029 (USD MILLION)
- TABLE 210 EGYPT: GAS ENGINES MARKET, BY POWER OUTPUT, 2020-2023 (USD MILLION)
- TABLE 211 EGYPT: GAS ENGINES MARKET, BY POWER OUTPUT, 2024-2029 (USD MILLION)
- 10.6.6.3 Nigeria
- 10.6.6.3.1 Increasing demand for reliable power due to frequent grid outages
- 10.6.6.3 Nigeria
- TABLE 212 NIGERIA: GAS ENGINES MARKET, BY FUEL TYPE, 2020-2023 (USD MILLION)
- TABLE 213 NIGERIA: GAS ENGINES MARKET, BY FUEL TYPE, 2024-2029 (USD MILLION)
- TABLE 214 NIGERIA: GAS ENGINES MARKET, BY POWER OUTPUT, 2020-2023 (USD MILLION)
- TABLE 215 NIGERIA: GAS ENGINES MARKET, BY POWER OUTPUT, 2024-2029 (USD MILLION)
- 10.6.6.4 Rest of Middle East & Africa
- TABLE 216 REST OF MIDDLE EAST & AFRICA: GAS ENGINES MARKET, BY FUEL TYPE, 2020-2023 (USD MILLION)
- TABLE 217 REST OF MIDDLE EAST & AFRICA: GAS ENGINES MARKET, BY FUEL TYPE, 2024-2029 (USD MILLION)
- TABLE 218 REST OF MIDDLE EAST & AFRICA: GAS ENGINES MARKET, BY POWER OUTPUT, 2020-2023 (USD MILLION)
- TABLE 219 REST OF MIDDLE EAST & AFRICA: GAS ENGINES MARKET, BY POWER OUTPUT, 2024-2029 (USD MILLION)
11 COMPETITIVE LANDSCAPE
- 11.1 KEY PLAYER STRATEGIES
- TABLE 220 OVERVIEW OF KEY STRATEGIES ADOPTED BY TOP PLAYERS, 2020-2023
- 11.2 MARKET SHARE ANALYSIS OF TOP FIVE PLAYERS
- TABLE 221 GAS ENGINES MARKET: DEGREE OF COMPETITION
- FIGURE 44 GAS ENGINES MARKET SHARE ANALYSIS, 2023
- 11.3 REVENUE ANALYSIS OF TOP FIVE MARKET PLAYERS
- FIGURE 45 TOP PLAYERS IN GAS ENGINES MARKET FROM 2018 TO 2022
- 11.4 COMPANY EVALUATION MATRIX
- 11.4.1 STARS
- 11.4.2 PERVASIVE PLAYERS
- 11.4.3 EMERGING LEADERS
- 11.4.4 PARTICIPANTS
- FIGURE 46 COMPANY EVALUATION MATRIX: GAS ENGINES MARKET, 2023
- 11.5 BRAND/PRODUCT COMPARISON
- 11.6 GAS ENGINES MARKET: COMPANY FOOTPRINT
- TABLE 222 BY FUEL TYPE: COMPANY FOOTPRINT
- TABLE 223 BY END-USE INDUSTRY: COMPANY FOOTPRINT
- TABLE 224 BY APPLICATION: COMPANY FOOTPRINT
- TABLE 225 POWER RATING: COMPANY FOOTPRINT
- TABLE 226 REGION: COMPANY FOOTPRINT
- TABLE 227 COMPANY FOOTPRINT
- 11.7 START-UP/SME EVALUATION MATRIX, 2023
- 11.7.1 PROGRESSIVE COMPANIES
- 11.7.2 RESPONSIVE COMPANIES
- 11.7.3 DYNAMIC COMPANIES
- 11.7.4 STARTING BLOCKS
- FIGURE 47 GAS ENGINES MARKET: START-UP/SME EVALUATION QUADRANT, 2023
- 11.7.5 COMPETITIVE BENCHMARKING
- 11.7.5.1 Detailed list of key start-ups
- TABLE 228 DETAILED LIST OF KEY START-UPS
- 11.7.5.2 Competitive benchmarking of key start-ups
- TABLE 229 COMPETITIVE BENCHMARKING OF KEY START-UPS
- 11.8 VALUATION AND FINANCIAL METRICS OF KEY GAS ENGINES MARKET PLAYERS
- FIGURE 48 EV/EBITDA OF KEY VENDORS
- FIGURE 49 COMPANY VALUATION OF KEY VENDORS
- 11.9 COMPETITIVE SCENARIO
- TABLE 230 GAS ENGINES MARKET: PRODUCT LAUNCHES, 2020-2023
- TABLE 231 GAS ENGINES MARKET: DEALS, 2020-2023
- TABLE 232 GAS ENGINES MARKET: EXPANSION, 2020-2023
12 COMPANY PROFILES
- 12.1 KEY PLAYERS
- (Business Overview, Products/Solutions/Services offered, Recent Developments, MnM View)**
- 12.1.1 CATERPILLAR
- TABLE 233 CATERPILLAR: COMPANY OVERVIEW
- FIGURE 50 CATERPILLAR: COMPANY SNAPSHOT (2023)
- TABLE 234 CATERPILLAR: PRODUCTS OFFERED
- TABLE 235 CATERPILLAR: PRODUCT LAUNCHES
- TABLE 236 CATERPILLAR: DEALS
- TABLE 237 CATERPILLAR: OTHER DEVELOPMENTS
- 12.1.2 WARTSILA
- TABLE 238 WARTSILA: BUSINESS OVERVIEW
- FIGURE 51 WARTSILA: COMPANY SNAPSHOT (2023)
- TABLE 239 WARTSILA: PRODUCTS OFFERED
- TABLE 240 WARTSILA: PRODUCT LAUNCHES
- TABLE 241 WARTSILA: DEALS
- 12.1.3 ROLLS-ROYCE HOLDINGS
- TABLE 242 ROLLS-ROYCE HOLDINGS: BUSINESS OVERVIEW
- FIGURE 52 ROLLS-ROYCE HOLDINGS: COMPANY SNAPSHOT (2023)
- TABLE 243 ROLLS-ROYCE HOLDINGS: PRODUCTS OFFERED
- TABLE 244 ROLLS-ROYCE HOLDINGS: PRODUCT LAUNCHES
- TABLE 245 ROLLS-ROYCE HOLDINGS: DEALS
- TABLE 246 ROLLS-ROYCE HOLDINGS: OTHER DEVELOPMENTS
- 12.1.4 CUMMINS
- TABLE 247 CUMMINS: BUSINESS OVERVIEW
- FIGURE 53 CUMMINS: COMPANY SNAPSHOT (2023)
- TABLE 248 CUMMINS: PRODUCTS OFFERED
- TABLE 249 CUMMINS: PRODUCT LAUNCHES
- TABLE 250 CUMMINS: DEALS
- 12.1.5 VOLKSWAGEN (MAN ENERGY SOLUTIONS)
- TABLE 251 VOLKSWAGEN (MAN ENERGY SOLUTIONS): BUSINESS OVERVIEW
- FIGURE 54 VOLKSWAGEN (MAN ENERGY SOLUTIONS): COMPANY SNAPSHOT (2023)
- TABLE 252 VOLKSWAGEN (MAN ENERGY SOLUTIONS): PRODUCTS OFFERED
- TABLE 253 VOLKSWAGEN (MAN ENERGY SOLUTIONS): PRODUCT LAUNCHES
- TABLE 254 VOLKSWAGEN (MAN ENERGY SOLUTIONS): DEALS
- 12.1.6 SIEMENS ENERGY
- TABLE 255 SIEMENS ENERGY: BUSINESS OVERVIEW
- FIGURE 55 SIEMENS ENERGY: COMPANY SNAPSHOT (2023)
- TABLE 256 SIEMENS ENERGY: PRODUCTS OFFERED
- TABLE 257 SIEMENS ENERGY: DEALS
- 12.1.7 MITSUBISHI HEAVY INDUSTRIES, LTD.
- TABLE 258 MITSUBISHI HEAVY INDUSTRIES, LTD.: BUSINESS OVERVIEW
- FIGURE 56 MITSUBISHI HEAVY INDUSTRIES, LTD.: COMPANY SNAPSHOT (2023)
- TABLE 259 MITSUBISHI HEAVY INDUSTRIES, LTD.: PRODUCTS OFFERED
- TABLE 260 MITSUBISHI HEAVY INDUSTRIES, LTD.: DEALS
- 12.1.8 INNIO
- TABLE 261 INNIO: BUSINESS OVERVIEW
- TABLE 262 INNIO: PRODUCTS OFFERED
- TABLE 263 INNIO: PRODUCT LAUNCHES
- TABLE 264 INNIO: DEALS
- 12.1.9 KAWASAKI HEAVY INDUSTRIES, LTD.
- TABLE 265 KAWASAKI HEAVY INDUSTRIES, LTD.: BUSINESS OVERVIEW
- FIGURE 57 KAWASAKI HEAVY INDUSTRIES, LTD.: COMPANY SNAPSHOT (2023)
- TABLE 266 KAWASAKI HEAVY INDUSTRIES, LTD.: PRODUCTS OFFERED
- TABLE 267 KAWASAKI HEAVY INDUSTRIES, LTD.: PRODUCT LAUNCHES
- TABLE 268 KAWASAKI HEAVY INDUSTRIES, LTD.: DEALS
- 12.1.10 NINGBO C.S.I. POWER & MACHINERY GROUP CO., LTD.
- TABLE 269 NINGBO C.S.I. POWER & MACHINERY GROUP CO., LTD.: BUSINESS OVERVIEW
- TABLE 270 NINGBO C.S.I. POWER & MACHINERY GROUP CO., LTD: PRODUCTS OFFERED
- 12.1.11 IHI POWER SYSTEMS
- TABLE 271 IHI POWER SYSTEMS: BUSINESS OVERVIEW
- TABLE 272 IHI POWER SYSTEMS: PRODUCTS OFFERED
- 12.1.12 JFE ENGINEERING CORPORATION
- TABLE 273 JFE ENGINEERING CORPORATION: BUSINESS OVERVIEW
- TABLE 274 JFE ENGINEERING CORPORATION: PRODUCTS OFFERED
- 12.1.13 LIEBHERR
- TABLE 275 LIEBHERR: BUSINESS OVERVIEW
- TABLE 276 LIEBHERR: PRODUCTS OFFERED
- 12.1.14 HYUNDAI HEAVY INDUSTRIES CO., LTD.
- TABLE 277 HYUNDAI HEAVY INDUSTRIES CO., LTD.: BUSINESS OVERVIEW
- FIGURE 58 HYUNDAI HEAVY INDUSTRIES, LTD.: COMPANY SNAPSHOT (2022)
- TABLE 278 HYUNDAI HEAVY INDUSTRIES CO., LTD.: PRODUCTS OFFERED
- TABLE 279 HYUNDAI HEAVY INDUSTRIES CO., LTD.: PRODUCT LAUNCHES
- 12.1.15 JINAN LVNENG POWER MACHINERY EQUIPMENT CO., LTD
- TABLE 280 JINAN LVNENG POWER MACHINERY EQUIPMENT CO., LTD.: BUSINESS OVERVIEW
- TABLE 281 JINAN LVNENG POWER MACHINERY EQUIPMENT CO., LTD: PRODUCTS OFFERED
- 12.2 OTHER PLAYERS
- 12.2.1 R SCHMITT ENERTEC
- TABLE 282 R SCHMITT ENERTEC: BUSINESS OVERVIEW
- TABLE 283 R SCHMITT ENERTEC: PRODUCTS OFFERED
- 12.2.2 CNPC JICHAI POWER COMPLEX
- TABLE 284 CNPC JICHAI POWER COMPLEX: BUSINESS OVERVIEW
- TABLE 285 CNPC JICHAI POWER COMPLEX: PRODUCTS OFFERED
- 12.2.3 FAIRBANKS MORSE
- TABLE 286 FAIRBANKS MORSE: BUSINESS OVERVIEW
- TABLE 287 FAIRBANKS MORSE: PRODUCTS OFFERED
- 12.2.4 GOOGOL ENGINE TECH
- TABLE 288 GOOGOL ENGINE TECH: BUSINESS OVERVIEW
- TABLE 289 GOOGOL ENGINE TECH: PRODUCTS OFFERED
- 12.2.5 BAUDOUIN
- TABLE 290 BAUDOUIN: BUSINESS OVERVIEW
- TABLE 291 BAUDOUIN: PRODUCTS OFFERED
- 12.2.6 DOOSAN
- 12.2.7 YANMAR
- 12.2.8 KOHLER CO.
- 12.2.9 DEUTZ AG
- 12.2.10 ACHATES POWER INC.
- *Details on Business Overview, Products/Solutions/Services offered, Recent Developments, MnM View might not be captured in case of unlisted companies.
13 APPENDIX
- 13.1 INSIGHTS FROM INDUSTRY EXPERTS
- 13.2 DISCUSSION GUIDE
- 13.3 KNOWLEDGESTORE: MARKETSANDMARKETS' SUBSCRIPTION PORTAL
- 13.4 CUSTOMIZATION OPTIONS
- 13.5 RELATED REPORTS
- 13.6 AUTHOR DETAILS

