|
|
市場調査レポート
商品コード
1901398
メンブレンバイオリアクターの世界市場:メンブレンタイプ別、システム構成別、容量別、用途別、地域別 - 予測(~2030年)Membrane Bioreactor Market by Membrane Type, System Configuration, Capacity, Application, And Region - Global Forecast to 2030 |
||||||
|
|||||||
カスタマイズ可能
|
|||||||

| メンブレンバイオリアクターの世界市場:メンブレンタイプ別、システム構成別、容量別、用途別、地域別 - 予測(~2030年) |
|
出版日: 2025年11月27日
発行: MarketsandMarkets
ページ情報: 英文 260 Pages
納期: 即納可能
|

概要
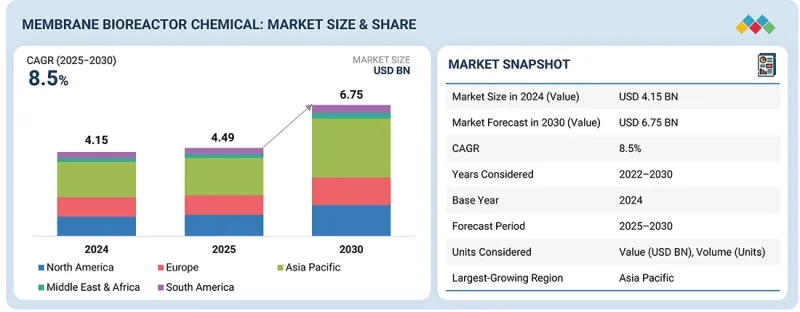
世界のメンブレンバイオリアクターの市場規模は、2025年の44億9,000万米ドルから2030年までに67億5,000万米ドルに達すると予測され、予測期間にCAGRで8.5%の成長が見込まれます。
| 調査範囲 | |
|---|---|
| 調査対象期間 | 2022年~2030年 |
| 基準年 | 2024年 |
| 予測期間 | 2025年~2030年 |
| 単位 | 100万米ドル、台 |
| セグメント | 膜タイプ、システム構成、容量、用途、地域 |
| 対象地域 | 欧州、北米、アジア太平洋、中東・アフリカ、南米 |
中空糸膜は、廃水処理用途における数多くの利点から、メンブレンバイオリアクター市場において2番目に成長が速いタイプとなっています。これらの膜は高い表面積対体積比を提供し、ろ過効率を高め、コンパクトなシステム設計を可能にするため、スペースに制約のある環境に最適です。また、その設計は効果的なバイオマスの保持を促進し、透過液の品質向上をもたらすため、メンブレンバイオリアクターシステム全体の性能向上に寄与します。中空糸膜は汚れ(ファウリング)の発生率が低く、長期的にメンテナンスの必要性と運用コストを削減します。
中空糸膜技術における継続的な進歩、特に耐久性と耐薬品性に優れた材料の開発が、その採用をさらに促進しています。産業において効率的で費用対効果が高く持続可能な廃水処理ソリューションへの需要が高まる中、中空糸膜の魅力は増し続けており、メンブレンバイオリアクター市場における重要な存在としての地位を確立しています。
「システム構成別では、浸漬型メンブレンバイオリアクターシステムが予測期間に金額ベースで第2位の成長率を示す市場となります。」
浸漬型メンブレンバイオリアクターシステムは、膜ろ過と生物学的処理プロセスを効率的に統合していることから、メンブレンバイオリアクター市場において成長率が2番目に高いセグメントとなっています。この設計により、膜を曝気槽内に直接沈めることが可能となり、バイオマスの保持性が向上し、微生物と廃水との接触が促進されます。浸漬構成は処理施設に必要な設置面積を大幅に削減するため、スペースに制約のある都市環境に特に適しています。さらに、浸漬型メンブレンバイオリアクターシステムは、水中膜が空気にさらされる機会が少なく逆洗を必要としないため、汚損率が低く運用コストの削減が期待できます。効果的かつ省スペースな廃水処理ソリューションへの需要が高まる中、浸漬型メンブレンバイオリアクターシステムは、都市廃水処理から産業プロセスまでさまざまな用途で採用が進んでおり、市場成長がさらに促進されています。
「用途別では、産業廃水処理が予測期間に金額ベースで第2位の市場規模を占める見込みです。」
メンブレンバイオリアクター市場において産業廃水処理が第2位の用途である要因は、製薬、食品・飲料、テキスタイルなどの業界で発生する排水の体積と複雑性の増加にあります。これらの部門は環境規制遵守のために厳格な水質基準を満たす必要があり、汚染物質を効果的に除去し高品質な排水を供給できるメンブレンバイオリアクターなどの先進の処理ソリューションへの需要が促進されています。メンブレンバイオリアクター技術は、従来の処理方法と比較してコンパクトな設計、設置面積の縮小、運用コストの低減といった利点も提供します。これにより、廃水管理における持続可能性と効率性の向上を目指す業界にとって魅力的な選択肢となっています。さらに、水の再使用と資源回収への関心の高まりが、産業用途におけるメンブレンバイオリアクターシステムの採用を促進しており、結果として、その大きな市場シェアが強化されています。
地域別では、北米が2023年にメンブレンバイオリアクター市場において金額ベースで第2位の規模を占めています。
複数の要因により、北米がメンブレンバイオリアクターの第2位の市場となっています。同地域は堅固な産業・公共インフラを有し、製薬、化学、食品・飲料、自動車製造といった重要な部門が先進の廃水処理ソリューションの需要を促進しています。特に米国環境保護庁(EPA)による厳格な環境規制は廃水排出基準を高く設定しており、メンブレンバイオリアクター技術が規制遵守に向けた効果的な選択肢となっています。さらに、水不足への懸念の高まりと持続可能な水管理手法の必要性から、水の再使用を支えるメンブレンバイオリアクターシステムへの投資が増加しています。同地域における継続的な技術の進歩と研究開発の取り組みも、メンブレンバイオリアクターの効率性と有効性を高めており、北米は世界のメンブレンバイオリアクター市場における主要国としての地位を強化しています。
当レポートでは、世界のメンブレンバイオリアクター市場について調査分析し、主な促進要因と抑制要因、製品開発とイノベーション、競合情勢に関する知見を提供しています。
よくあるご質問
目次
第1章 イントロダクション
第2章 調査手法
第3章 エグゼクティブサマリー
第4章 重要な知見
- メンブレンバイオリアクター市場の企業にとって魅力的な機会
- メンブレンバイオリアクター市場:膜タイプ別
- メンブレンバイオリアクター市場:システム構成別
- メンブレンバイオリアクター市場:用途別
- メンブレンバイオリアクター市場:国別
第5章 市場の概要
- 市場力学
- 促進要因
- 抑制要因
- 機会
- 課題
- アンメットニーズとホワイトスペース
- MBR市場におけるアンメットニーズ
- ホワイトスペースの機会
- 相互接続された市場と部門横断的な機会
- 相互接続された市場
- 部門横断的な機会
- 新たなビジネスモデルとエコシステムの変化
- 新たなビジネスモデル
- エコシステムの変化
- Tier 1/2/3企業の戦略的動き
第6章 業界動向
- ポーターのファイブフォース分析
- マクロ経済指標
- バリューチェーン分析
- 原材料サプライヤー
- メーカー
- 販売業者
- 最終消費者
- エコシステム分析
- 価格設定の分析
- 平均販売価格:主要企業別(2024年)
- 平均販売価格:地域別(2022年~2024年)
- 貿易分析
- 輸入シナリオ(HSコード841989)
- 輸出シナリオ(HSコード841989)
- 主な会議とイベント(2026年)
- カスタマービジネスに影響を与える動向/混乱
- 投資と資金調達のシナリオ
- ケーススタディ分析
- メンブレンバイオリアクター市場に対する2025年の米国関税の影響
- 主な関税率
- 価格の影響の分析
- 国/地域への影響
- 最終用途産業への影響
第7章 技術、特許、デジタル、AIの採用による戦略的破壊
- 主な新技術
- MBR/廃水処理プラントのAI対応デジタルツイン(DT)
- バイオチャー支援MBR
- 補完技術
- 技術/製品ロードマップ
- 短期|基盤構築と早期商業化(2025年~2027年)
- 中期|拡張と標準化(2027年~2030年)
- 長期|大規模な商業化と破壊的変化(2030年~2035年以降)
- 特許分析
- 調査手法
- 文書の種類
- 考察
- 特許の法的地位
- 管轄分析
- 主な出願者
- 過去10年間の特許保有者上位10社
- 将来の用途
- 産業再使用・無排水(ZLD)
- 高毒性・微量汚染物質の除去
- 極限環境処理
- 飲用水再使用
- 分散型・パッケージドシステム
- MBR市場に対するAI/生成AIの影響
- 主なユースケースと市場の将来性
- MBR処理のベストプラクティス
- MBR市場におけるAI導入のケーススタディ
- 相互接続された隣接エコシステムと市場企業への影響
- MBR市場における生成AI採用に対するクライアントの準備状況
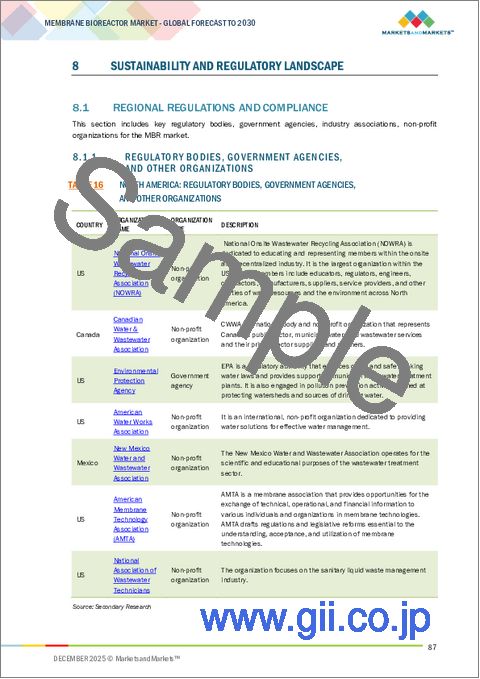
第8章 持続可能性と規制情勢
- 地域の規制とコンプライアンス
- 規制機関、政府機関、その他の組織
- 業界標準
- 持続可能性への取り組み
- 持続可能性への影響と規制政策の取り組み
- 認証、ラベル、環境基準
第9章 顧客情勢と購買行動
- 意思決定プロセス
- 主なステークホルダーと購入基準
- 採用障壁と内部課題
- さまざまな最終用途産業におけるアンメットニーズ
- 市場の収益性
- 潜在的な収益
- コスト力学
- 主な最終用途産業における利益の機会
第10章 メンブレンバイオリアクター市場:システム構成別
- 浸漬型MBR
- 槽外型MBR
第11章 メンブレンバイオリアクター市場:膜タイプ別
- 中空糸
- フラットシート
- マルチチューブラー
第12章 メンブレンバイオリアクター市場:容量別
- 小
- 中
- 大
第13章 メンブレンバイオリアクター市場:用途別
- 都市下水処理
- 産業廃水処理
- 食品・飲料
- 石油・ガス
- パルプ・紙
- 医薬品
- その他の産業廃水処理用途
第14章 メンブレンバイオリアクター市場:地域別
- 北米
- 米国
- カナダ
- メキシコ
- 欧州
- ドイツ
- 英国
- フランス
- イタリア
- スペイン
- ロシア
- トルコ
- その他の欧州
- アジア太平洋
- 中国
- 日本
- インド
- 韓国
- オーストラリア
- その他のアジア太平洋
- 中東・アフリカ
- GCC諸国
- エジプト
- 南アフリカ
- その他の中東・アフリカ
- 南米
- ブラジル
- アルゼンチン
- その他の南米
第15章 競合情勢
- 概要
- 主要参入企業の戦略/強み
- 収益分析(2022年~2024年)
- 市場シェア分析(2024年)
- 企業の評価と財務指標(2024年)
- ブランド/製品の比較分析
- 企業の評価マトリクス:主要企業(2024年)
- 企業の評価マトリクス:スタートアップ/中小企業(2024年)
- 競合シナリオ
第16章 企業プロファイル
- 主要企業
- VEOLIA
- KUBOTA CORPORATION.
- XYLEM
- TORAY INDUSTRIES, INC.
- MANN+HUMMEL
- MITSUBISHI CHEMICAL CORPORATION
- KOVALUS SEPARATION SOLUTIONS
- DUPONT
- ALFA LAVAL
- PENTAIR
- CITIC ENVIRONMENTAL TECHNOLOGIES CO., LTD.
- AQUATECH
- MEMBION GMBH
- その他の企業
- B&P WATER TECHNOLOGIES S.R.L.
- BERGHOF MEMBRANE TECHNOLOGY GMBH
- HUBER SE
- LENNTECH B.V.
- TRIQUA INTERNATIONAL
- WEHRLE-WERK AG
- EUROPE MEMBRANE
- SIGMADAF
- AQUAMATCH
- HITACHI, LTD.
- CLEAR AQUA TECHNOLOGIES P. LTD.
- HYDROTECH
- HINADA

