|
|
市場調査レポート
商品コード
1442283
宇宙太陽光発電の世界市場:ビームタイプ (レーザー光送電・マイクロ波送電)・エンドユーザー (政府&防衛・商業)・用途別、地域別 - 予測(~2040年)Space-Based Solar Power Market by Beam Type (Laser Beam Power Transmission, Microwave Power Transmission), End Users (Government and Defense, Commercial), Application (Terrestrial, Space) and Region - Global Forecast to 2040 |
||||||
|
|||||||
カスタマイズ可能
|
|||||||

| 宇宙太陽光発電の世界市場:ビームタイプ (レーザー光送電・マイクロ波送電)・エンドユーザー (政府&防衛・商業)・用途別、地域別 - 予測(~2040年) |
|
出版日: 2024年02月27日
発行: MarketsandMarkets
ページ情報: 英文 123 Pages
納期: 即納可能
|

全表示
- 概要
- 目次
世界の宇宙太陽光発電の市場規模は、2030年の47億米ドルから、予測期間中に3.3%のCAGRで推移し、2040年には68億米ドルの規模に成長すると予測されています。
グリーンエネルギーに対する需要の高まりが宇宙太陽光発電の主要な推進因子です。宇宙太陽光発電は、地上の制約に縛られることなく、継続的かつ豊富なクリーンエネルギー源を提供するためです。宇宙太陽光発電は、温室効果ガスを排出することなく持続的にこの需要を満たす可能性があり、再生可能エネルギーへの世界的な移行に不可欠な存在です。
| 調査範囲 | |
|---|---|
| 調査対象年 | 2030-2040年 |
| 基準年 | 2030年 |
| 予測期間 | 2030-2040年 |
| 単位 | 金額 (米ドル) |
| セグメント別 | ビームタイプ・エンドユーザー・用途・地域別 |
| 対象地域 | 北米・欧州・アジア太平洋・その他の地域 |
エンドユーザー別では、商業部門が2030年に2番目に高いシェアを占める見通しです。特に遠隔操作やオフグリッド施設のための信頼性と回復力のあるエネルギー源へのニーズが、無停電発電機能を提供する宇宙太陽光発電への商業的関心を促進しています。民間企業と宇宙産業のステークホルダーとの提携や協力関係により、商業的ニーズに適合した宇宙太陽光発電システムの開発と展開が促進され、市場の成長と普及が促進される見通しです。
当レポートでは、世界の宇宙太陽光発電の市場を調査し、市場概要、市場影響因子および市場機会の分析、技術・特許の動向、法規制環境、ケーススタディ、市場規模の推移・予測、各種区分・地域別の詳細分析、競合情勢、主要企業のプロファイルなどをまとめています。
目次
第1章 イントロダクション
第2章 調査手法
第3章 エグゼクティブサマリー
第4章 重要考察
第5章 市場概要
- 市場力学
- 促進要因
- 抑制要因
- 機会
- 課題
- バリューチェーン分析
- 顧客のビジネスに影響を与える動向/ディスラプション
- エコシステム分析
- 規制状況
- 貿易データ分析
- 技術ロードマップ
- 技術分析
- 主な会議とイベント
- 使用事例の分析
- 特許分析
第6章 産業動向
- 技術動向
- メガトレンドの影響
- インフラの概要
第7章 宇宙太陽光発電市場:ビームタイプ別
- マイクロ波送電
- レーザー光送電
第8章 宇宙太陽光発電市場:用途別
- 地上
- 宇宙
第9章 宇宙太陽光発電市場:エンドユーザー別
- 政府・防衛
- 商業
第10章 宇宙太陽光発電市場:地域別
- 地域不況の影響分析
- 北米
- 欧州
- アジア太平洋
第11章 競合情勢
- 主要企業の戦略
- 市場ランキング分析
- 企業評価マトリックス
- 競合シナリオ
第12章 企業プロファイル
- 主要企業
- AIRBUS
- NORTHROP GRUMMAN
- OHB SE
- THALES ALENIA SPACE
- BOEING
- EMROD
- その他の企業
- AIRBORNE
- SPACETECH GMBH
- VIRTUS SOLIS
- AZUR SPACE SOLAR POWER GMBH
- CESI S.P.A.
- CELESTIA ENERGY
- SIRIN ORBITAL SYSTEMS AG
- OVERVIEW ENERGY
- SPACE SOLAR
- SOLAR SPACE TECHNOLOGIES
- METASAT UK
- PHOTONICITY PTE. LTD.
- SATELLITE APPLICATIONS CATAPULT LIMITED
- SOLAREN CORPORATION
- POWERLIGHT TECHNOLOGIES
- FRALOCK LLC
第13章 付録
The Space-Based Solar Power market is estimated to grow from USD 6.8 billion by 2040, from USD 4.7 billion in 2030, at a CAGR of 3.3% from 2030 to 2040. The increasing demand for green energy is a primary driver for Space-Based Solar Power as it offers a continuous and abundant source of clean energy, untethered by terrestrial limitations. Space-Based Solar Power's potential to meet this demand sustainably, without greenhouse gas emissions, positions it as a vital contributor to the global transition towards renewable energy solutions.
| Scope of the Report | |
|---|---|
| Years Considered for the Study | 2030-2040 |
| Base Year | 2030 |
| Forecast Period | 2030-2040 |
| Units Considered | Value (USD Million) |
| Segments | By Beam Type, End Users, Application and Region |
| Regions covered | North America, Europe, Asia Pacific, and the Rest of the World |
"Laser Beam Power Transmission segment by beam type is expected to hold the second highest market share in 2030."
Based on Beam Type, the Space-Based Solar Power market is categorized into laser beam power transmission and microwave power transmission. The laser beam power transmission segment having second highest share of 10.0%. The laser beam power transmission, beam type segment in the Space-Based Solar Power market is driven by advancements in laser technology, enabling efficient and focused energy transmission from space to Earth based receivers. Improved laser efficiency, beam control systems, and safety measures contribute to the growth of this segment, enhancing the feasibility and commercial viability of laser-based Space-Based Solar Power systems. Overall, both laser beam power transmission and microwave power transmission segments are crucial for the sustainable growth of the Space-Based Solar Power market.
"Commercial segment by end users is estimated to hold the second highest market share in 2030."
Based on End Users, the market is further divided into Government and Defense and Commercial end users. The need for reliable and resilient energy sources, particularly for remote operations and off-grid facilities, will drive commercial interest in Space-Based Solar Power, which offers uninterrupted power generation capabilities. Partnerships and collaborations between commercial enterprises and space industry stakeholders will facilitate the development and deployment of Space-Based Solar Power systems adapted to commercial needs, driving market growth and adoption.
"Europe is expected to hold the second highest market share in 2030."
The European Union's ambitious renewable energy targets and commitment to decarbonization under the European Green Deal will incentivize investment in innovative clean energy solutions like Space-Based Solar Power. In addition, Europe's established space industry, advanced technological expertise, and strong research and development capabilities position it as a key player in Space-Based Solar Power innovation and deployment. Also, the region's dense population centers and limited land availability make space-based solutions increasingly attractive for meeting energy needs sustainably. supportive regulatory frameworks and incentives at both national and EU levels will provide further impetus for the development and commercialization of Space-Based Solar Power projects in the region.
Strategic partnerships between European Space Agencies (ESA), Airbus and EMROD will facilitate collaborative efforts to advance Space-Based Solar Power technologies and infrastructure. Joint initiatives often lead to the development of innovative Space-Based Solar Power solutions tailored to specific models.
The break-up of the profile of primary participants in the Space-Based Solar Power market:
- By Company Type: Tier 1 - 49%, Tier 2 - 37%, and Tier 3 - 14%
- By Designation: C Level - 55%, Director Level - 27%, Others - 18%
- By Region: North America - 32%, Europe - 32%, Asia Pacific - 16%, Middle East - 10%, Latin America - 7%, Africa- 3%
Airbus (Netherlands), Northrop Grumman (US), OHB SE (Germany), Thales Alenia Space (France), Boeing (US), EMROD (New Zealand). These key players offer connectivity applicable to various sectors and have well-equipped and strong distribution networks across North America, Europe, and Asia Pacific.
Research Coverage:
In terms of applications, the Space-Based Solar Power market is divided into terrestrial and space applications.
The beam type segment of the Space-Based Solar Power market is divided into laser beam power transmission and microwave power transmission.
The end users-based segmentation includes government and defense, and commercial.
This report segments the Space-Based Solar Power market across three key regions: North America, Europe, Asia Pacific. The report's scope includes in-depth information on significant factors, such as drivers, restraints, challenges, and opportunities that influence the growth of the Space-Based Solar Power market.
A comprehensive analysis of major industry players has been conducted to provide insights into their business profiles, solutions, and services. This analysis also covers key aspects like agreements, collaborations, new product launches, contracts, expansions, acquisitions, and partnerships associated with the Space-Based Solar Power market.
Reasons to buy this report:
This report serves as a valuable resource for market leaders and newcomers in the Space-Based Solar Power market, offering data that closely approximates revenue figures for both the overall market and its subsegments. It equips stakeholders with a comprehensive understanding of the competitive landscape, facilitating informed decisions to enhance their market positioning and formulating effective go-to-market strategies for Simulation. The report imparts valuable insights into the market dynamics, offering information on crucial factors such as drivers, restraints, challenges, and opportunities, enabling stakeholders to gauge the market's pulse.
The report provides insights on the following pointers:
- Analysis of the key driver (Increasing global requirement for energy consumption, technological evolution of green energy generation), restraint (high initial investment cost, space debris and maintenance concerns, political and regulatory landscape) opportunities (a country's strategic independence, government initiatives for green energy ecosystem) and challenges (technological challenges involved in power transfer, competition with other renewable sources, expensive geo/leo launch cost, space based assembly ) there are several factors that could contribute to an increase in the Space-Based Solar Power market.
- Market Penetration: Comprehensive information on Space-Based Solar Power systems offered by the top players in the market
- Product Development/Innovation: Detailed insights on upcoming technologies, research & development activities, and new product & service launches in the Space-Based Solar Power market
- Market Development: Comprehensive information about lucrative markets - the report analyses the Space-Based Solar Power market across varied regions.
- Market Diversification: Exhaustive information about new products & services, untapped geographies, recent developments, and investments in the Space-Based Solar Power market
- Competitive Assessment: In-depth assessment of market shares, growth strategies, and service offerings of leading players in the Space-Based Solar Power market
TABLE OF CONTENTS
1 INTRODUCTION
- 1.1 STUDY OBJECTIVES
- 1.2 MARKET DEFINITION
- 1.3 STUDY SCOPE
- 1.3.1 MARKETS COVERED
- FIGURE 1 SPACE-BASED SOLAR POWER MARKET SEGMENTATION
- 1.3.2 REGIONS COVERED
- 1.3.3 YEARS CONSIDERED
- 1.4 INCLUSIONS AND EXCLUSIONS
- TABLE 1 INCLUSIONS AND EXCLUSIONS
- 1.5 CURRENCY CONSIDERED
- TABLE 2 USD EXCHANGE RATES
- 1.6 STAKEHOLDERS
2 RESEARCH METHODOLOGY
- 2.1 INTRODUCTION
- FIGURE 2 REPORT PROCESS FLOW
- FIGURE 3 RESEARCH DESIGN
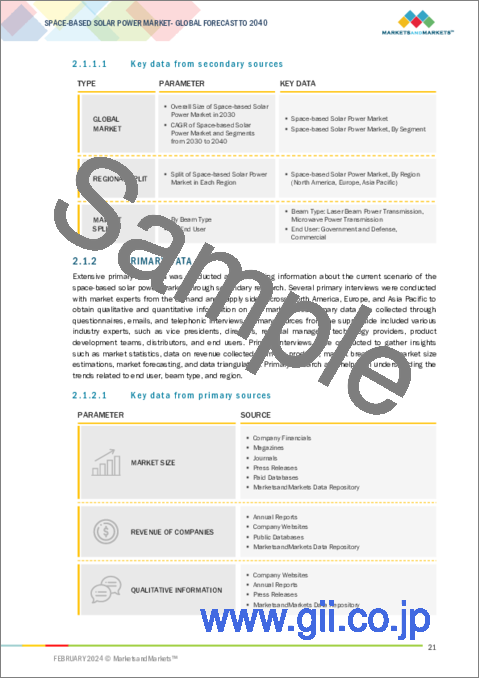
- 2.1.1 SECONDARY DATA
- 2.1.1.1 Key data from secondary sources
- 2.1.2 PRIMARY DATA
- 2.1.2.1 Key data from primary sources
- FIGURE 4 BREAKDOWN OF PRIMARY INTERVIEWS: BY COMPANY TYPE, DESIGNATION, AND REGION
- 2.2 RECESSION IMPACT ANALYSIS
- 2.2.1 DEMAND-SIDE INDICATORS
- 2.2.2 SUPPLY-SIDE INDICATORS
- 2.3 FACTOR ANALYSIS
- 2.3.1 INTRODUCTION
- 2.3.2 DEMAND-SIDE ANALYSIS
- 2.3.3 SUPPLY-SIDE ANALYSIS
- 2.4 MARKET SIZE ESTIMATION AND METHODOLOGY
- 2.4.1 BOTTOM-UP APPROACH
- FIGURE 5 MARKET SIZE ESTIMATION METHODOLOGY: BOTTOM-UP APPROACH
- 2.4.2 TOP-DOWN APPROACH
- FIGURE 6 MARKET SIZE ESTIMATION METHODOLOGY: TOP-DOWN APPROACH
- 2.5 DATA TRIANGULATION
- FIGURE 7 DATA TRIANGULATION
- 2.6 RESEARCH ASSUMPTIONS
- 2.6.1 GROWTH RATE ASSUMPTIONS
- 2.6.2 PARAMETRIC ASSUMPTIONS FOR MARKET FORECAST
- 2.7 RESEARCH LIMITATIONS
- 2.8 RISK ASSESSMENT
3 EXECUTIVE SUMMARY
- FIGURE 8 GOVERNMENT AND DEFENSE SEGMENT TO WITNESS LARGEST MARKET SHARE DURING FORECAST PERIOD
- FIGURE 9 LASER BEAM POWER TRANSMISSION SEGMENT TO REGISTER HIGHEST CAGR DURING FORECAST PERIOD
- FIGURE 10 ASIA PACIFIC TO ACCOUNT FOR LARGEST MARKET SHARE IN 2030
4 PREMIUM INSIGHTS
- 4.1 ATTRACTIVE OPPORTUNITIES FOR PLAYERS IN SPACE-BASED SOLAR POWER MARKET
- FIGURE 11 INCREASING FOCUS ON DEVELOPMENT OF MICROWAVE TRANSMISSION TECHNOLOGY TO DRIVE MARKET
- 4.2 SPACE-BASED SOLAR POWER MARKET, BY BEAM TYPE
- FIGURE 12 MICROWAVE POWER TRANSMISSION SEGMENT TO HAVE LARGEST MARKET SHARE IN 2030
- 4.3 SPACE-BASED SOLAR POWER MARKET, BY END USER
- FIGURE 13 GOVERNMENT AND DEFENSE SEGMENT TO LEAD DURING FORECAST PERIOD
5 MARKET OVERVIEW
- 5.1 INTRODUCTION
- 5.2 MARKET DYNAMICS
- FIGURE 14 SPACE-BASED SOLAR POWER MARKET: DRIVERS, RESTRAINTS, OPPORTUNITIES, AND CHALLENGES
- 5.2.1 DRIVERS
- 5.2.1.1 Rising energy consumption worldwide
- FIGURE 15 REGIONAL ENERGY CONSUMPTION, 2018-2022
- 5.2.1.2 Growing adoption of green energy
- 5.2.1.3 Increasing development of favorable infrastructure
- 5.2.2 RESTRAINTS
- 5.2.2.1 High initial investment cost
- 5.2.2.2 Space debris and maintenance concerns
- FIGURE 16 SPACE JUNK IN 2023
- 5.2.2.3 Limited availability of orbital slots
- 5.2.3 OPPORTUNITIES
- 5.2.3.1 Growing shift toward self-sufficient energy generation
- 5.2.4 CHALLENGES
- 5.2.4.1 Technological challenges involved in power transfer
- 5.2.4.2 Political and regulatory obstacles
- 5.2.4.3 Competition with other renewable sources
- 5.2.4.4 Expensive launch cost of geostationary and low earth orbit satellites
- 5.2.4.5 Complex space-based assembly
- 5.3 VALUE CHAIN ANALYSIS
- FIGURE 17 VALUE CHAIN ANALYSIS
- 5.4 TRENDS/DISRUPTIONS IMPACTING CUSTOMER BUSINESS
- FIGURE 18 REVENUE SHIFT AND NEW REVENUE POCKETS FOR PLAYERS IN SPACE-BASED SOLAR POWER MARKET
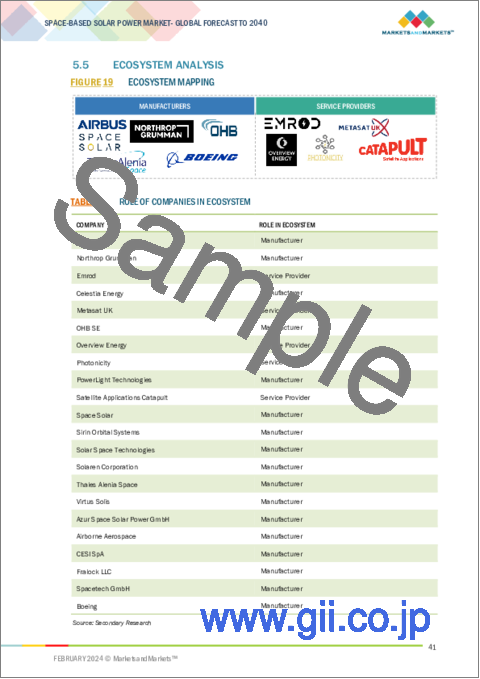
- 5.5 ECOSYSTEM ANALYSIS
- FIGURE 19 ECOSYSTEM MAPPING
- TABLE 3 ROLE OF COMPANIES IN ECOSYSTEM
- 5.6 REGULATORY LANDSCAPE
- TABLE 4 NORTH AMERICA: REGULATORY BODIES, GOVERNMENT AGENCIES, AND OTHER AGENCIES
- TABLE 5 EUROPE: REGULATORY BODIES, GOVERNMENT AGENCIES, AND OTHER AGENCIES
- TABLE 6 ASIA PACIFIC: REGULATORY BODIES, GOVERNMENT AGENCIES, AND OTHER AGENCIES
- 5.7 TRADE DATA ANALYSIS
- FIGURE 20 TOP 10 COUNTRY-WISE IMPORTS, 2018-2022
- TABLE 7 COUNTRY-WISE IMPORTS, 2018-2022 (USD THOUSAND)
- FIGURE 21 TOP 10 COUNTRY-WISE EXPORTS, 2018-2022
- TABLE 8 COUNTRY-WISE EXPORTS, 2018-2022 (USD THOUSAND)
- 5.8 TECHNOLOGY ROADMAP
- FIGURE 22 TECHNOLOGY ROADMAP, 2020-2050
- FIGURE 23 TECHNOLOGY TRENDS
- 5.9 TECHNOLOGY ANALYSIS
- 5.9.1 KEY TECHNOLOGIES
- 5.9.1.1 Photovoltaic and perovskite solar cells
- 5.9.1.2 Wireless power transmission
- 5.9.2 SUPPORTING TECHNOLOGIES
- 5.9.2.1 Power distribution network
- 5.9.1 KEY TECHNOLOGIES
- 5.10 KEY CONFERENCES AND EVENTS
- TABLE 9 KEY CONFERENCES AND EVENTS, 2024-2025
- 5.11 USE CASE ANALYSIS
- 5.11.1 LOW-COST LAUNCH CAPABILITIES
- 5.11.2 SATELLITE CONSTELLATION FOR SOLAR POWER
- 5.11.3 SPACE-BASED SOLAR POWER PROTOTYPE
- 5.12 PATENT ANALYSIS
- FIGURE 24 PATENT ANALYSIS
- TABLE 10 INNOVATIONS AND PATENT REGISTRATIONS, 2019-2023
6 INDUSTRY TRENDS
- 6.1 INTRODUCTION
- 6.2 TECHNOLOGY TRENDS
- 6.2.1 ULTRALIGHTWEIGHT CARBON FIBER COMPOSITES
- 6.2.2 ADVANCED RECTENNA DESIGN
- 6.2.3 MULTI-JUNCTION SOLAR CELLS
- 6.2.4 SOLAR ENERGY STORAGE SOLUTIONS
- 6.3 IMPACT OF MEGATRENDS
- 6.3.1 3D PRINTING
- 6.3.2 SPACE-BASED RESOURCE UTILIZATION
- 6.3.3 IN-SPACE MANUFACTURING
- 6.4 INFRASTRUCTURE OVERVIEW
- 6.4.1 SATELLITE SUBSYSTEMS
- 6.4.1.1 Solar panel arrays
- 6.4.1.2 Power amplification
- 6.4.1.3 Power transmission
- 6.4.2 GROUND STATION SUBSYSTEMS
- 6.4.2.1 Power conversion
- 6.4.2.2 Power storage
- 6.4.2.3 Mission control systems
- 6.4.1 SATELLITE SUBSYSTEMS
7 SPACE-BASED SOLAR POWER MARKET, BY BEAM TYPE
- 7.1 INTRODUCTION
- FIGURE 25 SPACE-BASED SOLAR POWER MARKET, BY BEAM TYPE, 2030-2040 (USD MILLION)
- TABLE 11 SPACE-BASED SOLAR POWER MARKET, BY BEAM TYPE, 2030-2040 (USD MILLION)
- 7.2 MICROWAVE POWER TRANSMISSION
- 7.2.1 HIGH-SCALE TRANSMISSION AND SCALABILITY TO DRIVE MARKET
- 7.3 LASER BEAM POWER TRANSMISSION
- 7.3.1 LOW INITIAL INVESTMENT TO DRIVE MARKET
8 SPACE-BASED SOLAR POWER MARKET, BY APPLICATION
- 8.1 INTRODUCTION
- 8.2 TERRESTRIAL
- 8.2.1 GROWING DEMAND FOR CLEAN ENERGY SOLUTIONS TO DRIVE MARKET
- 8.3 SPACE
- 8.3.1 INCREASING NEED FOR COST-EFFECTIVE SPACE POWER SOLUTIONS TO DRIVE MARKET
9 SPACE-BASED SOLAR POWER MARKET, BY END USER
- 9.1 INTRODUCTION
- FIGURE 26 SPACE-BASED SOLAR POWER MARKET, BY END USER, 2030-2040 (USD MILLION)
- TABLE 12 SPACE-BASED SOLAR POWER MARKET, BY END USER, 2030-2040 (USD MILLION)
- 9.2 GOVERNMENT AND DEFENSE
- 9.2.1 RISING MILITARIZATION OF SPACE-BASED SOLAR POWER TO DRIVE MARKET
- 9.3 COMMERCIAL
- 9.3.1 MINING, TOURISM, AND AGRICULTURE APPLICATIONS TO DRIVE MARKET
10 SPACE-BASED SOLAR POWER MARKET, BY REGION
- 10.1 INTRODUCTION
- FIGURE 27 SPACE-BASED SOLAR POWER MARKET, BY REGION, 2030-2040
- 10.2 REGIONAL RECESSION IMPACT ANALYSIS
- TABLE 13 SPACE-BASED SOLAR POWER MARKET, BY REGION, 2030-2040 (USD MILLION)
- 10.3 NORTH AMERICA
- 10.3.1 NORTH AMERICA: PESTLE ANALYSIS
- 10.3.2 NORTH AMERICA: RECESSION IMPACT ANALYSIS
- FIGURE 28 NORTH AMERICA: SPACE-BASED SOLAR POWER MARKET SNAPSHOT
- TABLE 14 NORTH AMERICA: SPACE-BASED SOLAR POWER MARKET, BY BEAM TYPE, 2030-2040 (USD MILLION)
- TABLE 15 NORTH AMERICA: SPACE-BASED SOLAR POWER MARKET, BY END USER, 2030-2040 (USD MILLION)
- 10.3.3 US
- 10.3.3.1 Diversified investments in space-based solar power projects to drive market
- 10.4 EUROPE
- 10.4.1 EUROPE: PESTLE ANALYSIS
- 10.4.2 EUROPE: RECESSION IMPACT ANALYSIS
- FIGURE 29 EUROPE: SPACE-BASED SOLAR POWER MARKET SNAPSHOT
- TABLE 16 EUROPE: SPACE-BASED SOLAR POWER MARKET, BY BEAM TYPE, 2030-2040 (USD MILLION)
- TABLE 17 EUROPE: SPACE-BASED SOLAR POWER MARKET, BY END USER, 2030-2040 (USD MILLION)
- 10.4.3 UK
- 10.4.3.1 Space Energy Initiative to drive market
- 10.5 ASIA PACIFIC
- 10.5.1 ASIA PACIFIC: PESTLE ANALYSIS
- 10.5.2 ASIA PACIFIC: RECESSION IMPACT ANALYSIS
- FIGURE 30 ASIA PACIFIC: SPACE-BASED SOLAR POWER MARKET SNAPSHOT
- TABLE 18 ASIA PACIFIC: SPACE-BASED SOLAR POWER MARKET, BY BEAM TYPE, 2030-2040 (USD MILLION)
- TABLE 19 ASIA PACIFIC: SPACE-BASED SOLAR POWER MARKET, BY END USER, 2030-2040 (USD MILLION)
- 10.5.3 CHINA
- 10.5.3.1 Increasing government initiatives and funding to drive market
- 10.5.4 JAPAN
- 10.5.4.1 Growing initiatives from Japan Aerospace Exploration Agency to drive market
11 COMPETITIVE LANDSCAPE
- 11.1 INTRODUCTION
- 11.2 STRATEGIES OF KEY PLAYERS
- TABLE 20 STRATEGIES OF KEY PLAYERS
- 11.3 MARKET RANKING ANALYSIS
- FIGURE 31 MARKET RANKING ANALYSIS, 2022
- 11.4 COMPANY EVALUATION MATRIX
- 11.4.1 STARS
- 11.4.2 EMERGING LEADERS
- 11.4.3 PERVASIVE PLAYERS
- 11.4.4 PARTICIPANTS
- FIGURE 32 SPACE-BASED SOLAR POWER MARKET: COMPANY EVALUATION MATRIX, 2022
- 11.4.5 COMPANY FOOTPRINT
- TABLE 21 SPACE-BASED SOLAR POWER MARKET: COMPANY FOOTPRINT
- TABLE 22 SPACE-BASED SOLAR POWER MARKET: BEAM TYPE FOOTPRINT
- TABLE 23 SPACE-BASED SOLAR POWER MARKET: END USER FOOTPRINT
- TABLE 24 SPACE-BASED SOLAR POWER MARKET: REGION FOOTPRINT
- 11.5 COMPETITIVE SCENARIO
- 11.5.1 PRODUCT LAUNCHES
- TABLE 25 SPACE-BASED SOLAR POWER MARKET: PRODUCT LAUNCHES, JUNE 2023
- 11.5.2 DEALS
- TABLE 26 SPACE-BASED SOLAR POWER MARKET: DEALS, OCTOBER 2022-OCTOBER 2023
12 COMPANY PROFILES
- (Business overview, Products/Services/Solutions offered, Recent Developments, MNM view)**
- 12.1 INTRODUCTION
- 12.2 KEY PLAYERS
- 12.2.1 AIRBUS
- TABLE 27 AIRBUS: COMPANY OVERVIEW
- FIGURE 33 AIRBUS: COMPANY SNAPSHOT
- TABLE 28 AIRBUS: PRODUCTS/SOLUTIONS/SERVICES OFFERED
- TABLE 29 AIRBUS: PRODUCT LAUNCHES
- TABLE 30 AIRBUS: OTHER DEVELOPMENTS
- 12.2.2 NORTHROP GRUMMAN
- TABLE 31 NORTHROP GRUMMAN: COMPANY OVERVIEW
- FIGURE 34 NORTHROP GRUMMAN: COMPANY SNAPSHOT
- TABLE 32 NORTHROP GRUMMAN: PRODUCTS/SOLUTIONS/SERVICES OFFERED
- TABLE 33 NORTHROP GRUMMAN: OTHER DEVELOPMENTS
- 12.2.3 OHB SE
- TABLE 34 OHB SE: COMPANY OVERVIEW
- FIGURE 35 OHB SE: COMPANY SNAPSHOT
- TABLE 35 OHB SE: PRODUCTS/SOLUTIONS/SERVICES OFFERED
- 12.2.4 THALES ALENIA SPACE
- TABLE 36 THALES ALENIA SPACE: COMPANY OVERVIEW
- FIGURE 36 THALES ALENIA SPACE: COMPANY SNAPSHOT
- TABLE 37 THALES ALENIA SPACE: PRODUCTS/SOLUTIONS/SERVICES OFFERED
- TABLE 38 THALES ALENIA SPACE: DEALS
- TABLE 39 THALES ALENIA SPACE: OTHER DEVELOPMENTS
- 12.2.5 BOEING
- TABLE 40 BOEING: COMPANY OVERVIEW
- FIGURE 37 BOEING: COMPANY SNAPSHOT
- TABLE 41 BOEING: PRODUCTS/SOLUTIONS/SERVICES OFFERED
- 12.2.6 EMROD
- TABLE 42 EMROD: COMPANY OVERVIEW
- TABLE 43 EMROD: PRODUCTS/SOLUTIONS/SERVICES OFFERED
- TABLE 44 EMROD: DEALS
- TABLE 45 EMROD: OTHER DEVELOPMENTS
- 12.3 OTHER PLAYERS
- 12.3.1 AIRBORNE
- TABLE 46 AIRBORNE: COMPANY OVERVIEW
- 12.3.2 SPACETECH GMBH
- TABLE 47 SPACETECH GMBH: COMPANY OVERVIEW
- 12.3.3 VIRTUS SOLIS
- TABLE 48 VIRTUS SOLIS: COMPANY OVERVIEW
- 12.3.4 AZUR SPACE SOLAR POWER GMBH
- TABLE 49 AZUR SPACE SOLAR POWER GMBH: COMPANY OVERVIEW
- 12.3.5 CESI S.P.A.
- TABLE 50 CESI S.P.A.: COMPANY OVERVIEW
- 12.3.6 CELESTIA ENERGY
- TABLE 51 CELESTIA ENERGY: COMPANY OVERVIEW
- 12.3.7 SIRIN ORBITAL SYSTEMS AG
- TABLE 52 SIRIN ORBITAL SYSTEMS AG: COMPANY OVERVIEW
- 12.3.8 OVERVIEW ENERGY
- TABLE 53 OVERVIEW ENERGY: COMPANY OVERVIEW
- 12.3.9 SPACE SOLAR
- TABLE 54 SPACE SOLAR: COMPANY OVERVIEW
- 12.3.10 SOLAR SPACE TECHNOLOGIES
- TABLE 55 SOLAR SPACE TECHNOLOGIES: COMPANY OVERVIEW
- 12.3.11 METASAT UK
- TABLE 56 METASAT UK: COMPANY OVERVIEW
- 12.3.12 PHOTONICITY PTE. LTD.
- TABLE 57 PHOTONICITY PTE. LTD.: COMPANY OVERVIEW
- 12.3.13 SATELLITE APPLICATIONS CATAPULT LIMITED
- TABLE 58 SATELLITE APPLICATIONS CATAPULT LIMITED: COMPANY OVERVIEW
- 12.3.14 SOLAREN CORPORATION
- TABLE 59 SOLAREN CORPORATION: COMPANY OVERVIEW
- 12.3.15 POWERLIGHT TECHNOLOGIES
- TABLE 60 POWERLIGHT TECHNOLOGIES: COMPANY OVERVIEW
- 12.3.16 FRALOCK LLC
- TABLE 61 FRALOCK LLC: COMPANY OVERVIEW
- *Details on Business overview, Products/Services/Solutions offered, Recent Developments, MNM view might not be captured in case of unlisted companies.
13 APPENDIX
- 13.1 DISCUSSION GUIDE
- 13.2 KNOWLEDGESTORE: MARKETSANDMARKETS' SUBSCRIPTION PORTAL
- 13.3 CUSTOMIZATION OPTIONS
- 13.4 RELATED REPORTS
- 13.5 AUTHOR DETAILS

