|
|
市場調査レポート
商品コード
1394558
石油・ガスポンプの世界市場:タイプ別、ポンプタイプ別、用途別、地域別-2028年までの予測Oil and Gas Pumps Market by Type (Submersible, Non-submersible), Pump Type (Centrifugal, Positive Displacement (Screw, Reciprocating, Progressive Cavity), Cryogenic), Application (Upstream, Midstream, Downstream) and Region - Global Forecast to 2028 |
||||||
|
|
|||||||
カスタマイズ可能
|
|||||||

| 石油・ガスポンプの世界市場:タイプ別、ポンプタイプ別、用途別、地域別-2028年までの予測 |
|
出版日: 2023年12月05日
発行: MarketsandMarkets
ページ情報: 英文 200 Pages
納期: 即納可能
|

全表示
- 概要
- 目次
| 調査範囲 | |
|---|---|
| 調査対象年 | 2021年~2028年 |
| 基準年 | 2022年 |
| 予測期間 | 2023年~2028年 |
| 検討単位 | 金額(100万米ドル/10億米ドル) |
| セグメント別 | 石油・ガスポンプ市場:タイプ別、ポンプタイプ別、用途別、地域別 |
| 対象地域 | アジア太平洋、北米、欧州、南米、中東・アフリカ |
世界の石油・ガスポンプの市場規模は、2023年の87億米ドルから2028年には109億米ドルに成長すると予測されており、予測期間中のCAGRは4.7%をになると予測されています。
探査活動の拡大、特に非在来型ソースでは、特殊なポンプ技術が必要とされ、石油・ガスポンプ市場の成長を促進しています。
予測期間中、水中ポンプ分野が最速分野となる見込みです。水中ポンプは、流体の供給源が地下深くにあったり、ポンプを設置するスペースが限られていたりするような場面で好まれます。電気モーターに直結した高効率のポンプは、エネルギーの浪費を最小限に抑えます。これらのポンプは大流量に対応するため、大規模な石油・ガス生産に最適です。
ポンプタイプ別では、容積式ポンプ分野は、予測期間中2番目に大きな市場シェアを占めると予想されています。容積式ポンプは、各サイクルで一定量の流体を捕捉・置換することで機能し、システム圧力の変動に影響されない安定した流量を確保します。一部のポンプとは異なり、回転または往復運動機構を採用して流体を特定の用途に送ります。これらのポンプは、高い圧力レベルを維持しながら、低流量で高粘度の液体を搬送するのに適しています。
アジア太平洋では、世界の確認埋蔵量の9.0%未満であるにもかかわらず、既存の油田の再開発と修復に大きな焦点が当てられています。石油需要の伸びは、人口増加、工業化、深海・超深海掘削を可能にする技術の進歩によってもたらされると予想されます。アジア太平洋地域のエネルギー消費の増加とインフラ整備の進展は、アジア太平洋地域の石油・ガス市場の拡大にさらに貢献しています。
当レポートでは、世界の石油・ガスポンプ市場について調査し、タイプ別、ポンプタイプ別、用途別、地域別動向、および市場に参入する企業のプロファイルなどをまとめています。
目次
第1章 イントロダクション
第2章 調査手法
第3章 エグゼクティブサマリー
第4章 重要考察
第5章 市場概要
- イントロダクション
- 市場力学
- 顧客のビジネスに影響を与える動向/混乱
- サプライチェーン分析
- エコシステム分析
- 技術分析
- 主要な会議とイベント
- 特許分析
- 規制状況
- 価格分析
- ケーススタディ分析
- ポーターのファイブフォース分析
- 主要な利害関係者と購入基準
第6章 石油・ガスポンプ市場、タイプ別
- イントロダクション
- 水中ポンプ
- 非水中ポンプ
第7章 石油・ガスポンプ市場、ポンプタイプ別
- イントロダクション
- 遠心ポンプ
- 容積式ポンプ
- 極低温ポンプ
第8章 石油・ガスポンプ市場、用途別
- イントロダクション
- 上流
- 中流
- 下流
第9章 石油・ガスポンプ市場、地域別
- イントロダクション
- アジア太平洋
- 北米
- 欧州
- 中東・アフリカ
- 南米
第10章 競合情勢
- 概要
- 主要企業が採用した戦略、2019~2023年
- 市場シェア分析、2022年
- 市場評価の枠組み
- 主要企業の部門別収益分析、2018~2022年
- 競争シナリオと動向
- 主要企業の評価マトリックス、2022年
- スタートアップ/中小企業(SMES)の評価マトリックス、2022年
第11章 企業プロファイル
- 主要企業
- ATLAS COPCO AB
- FLOWSERVE CORPORATION
- SULZER LTD
- KSB SE & CO. KGAA
- NIKKISO CO., LTD.
- HYDROMASHSERVICE
- GARDNER DENVER
- XYLEM
- SEEPEX GMBH
- LEISTRITZ PUMPEN GMBH
- ITT GOULDS PUMPS
- WILO SE
- SCHMITT KREISELPUMPEN
- TSURUMI MANUFACTURING CO., LTD.
- EBARA CORPORATION
- その他の企業
- TRILLIUM FLOW TECHNOLOGIES
- HALLIBURTON
- BAKER HUGHES COMPANY
- GORMAN-RUPP PUMPS
- DESIGNED & ENGINEERED PUMPS
第12章 付録
Report Description
| Scope of the Report | |
|---|---|
| Years Considered for the Study | 2021-2028 |
| Base Year | 2022 |
| Forecast Period | 2023-2028 |
| Units Considered | Value (USD Million/Billion) |
| Segments | Oil and Gas Pumps Market by Type, Pump Type, Application, and Region. |
| Regions covered | Asia Pacific, North America, Europe, South America, and Middle East & Africa. |
The global oil and gas pumps market is estimated to grow from USD 8.7 billion in 2023 to USD 10.9 Billion by 2028; it is expected to record a CAGR of 4.7% during the forecast period. Expansion in exploration activities, especially in unconventional sources, necessitates specialized pumping technologies, fostering growth in the oil and gas pumps market.
"Submersible pumps: The fastest segment of the oil and gas pumps market, by type "
Based on type, the oil and gas pumps market has been segmented into submersible and non-submersible pumps. The submersible pumps segment is expected to be the fastest segment during the forecast period. Submersible pumps are preffered in scenarios where fluid sources are deep underground or space for pump installation is restricted. Their high efficiency, directly linked to electric motors, minimizes energy wastage. These pumps accommodate high flow rates, making them ideal for large-scale oil and gas production.
"Positive displacement pumps segment is expected to be the second largest segment during the forecast period based on pump type."
By Pump type, the oil and gas pumps market has been split into three types: Centrifugal Pumps, Positive Displacement Pumps, and Cryogenic Pumps. The positive displacement pumps segment is expected to hold the second largest market share during the forecast period. Positive displacement pumps function by capturing and displacing a consistent volume of fluid with each cycle, ensuring a steady flow rate unaffected by system pressure variations. Unlike some pumps, they employ rotating or reciprocating mechanisms to deliver fluid to specific applications. These pumps are favored for conveying high-viscosity liquids at lower flow rates while maintaining high pressure levels.
"By Application , Downstream segment is expected to be the second fastest growing segment during the forecast period."
Based on the Application, the oil and gas pumps market is segmented into upstream, midstream, and downstream. The downstream segment is expected to be the second fastest growing segment of the oil and gas pumps market during the forecast period. Downstream activities in the oil and gas industry encompass operations that occur post-midstream, after crude oil transportation but before final product sales. This phase involves refining crude oil into various by-products like gasoline, natural gas liquids, and diesel, managed by refining companies. Companies engaged in downstream activities handle the refining, marketing, distribution, and sale of oil's end products.
"Asia Pacific is expected to be the fastest region in the oil and gas pumps market."
Asia Pacific is expected to be the fastest region in the oil and gas pumps market during the forecast period. In the Asia Pacific region, despite having less than 9.0% of global proven reserves, there's significant focus on redeveloping and rehabilitating existing oilfields. Anticipated growth in oil demand is driven by population growth, industrialization, and advancements in technology enabling deepwater and ultra-deepwater drilling. The region's increasing energy consumption and ongoing infrastructural development further contribute to the expansion of the oil and gas market in Asia Pacific.
Breakdown of Primaries:
In-depth interviews have been conducted with various key industry participants, subject-matter experts, C-level executives of key market players, and industry consultants, among other experts, to obtain and verify critical qualitative and quantitative information and assess future market prospects. The distribution of primary interviews is as follows:
By Company Type: Tier 1- 65%, Tier 2- 24%, and Tier 3- 11%
By Designation: C-Level- 30%, Director Level- 25%, and Others- 45%
By Region: North America- 20%, Europe- 25%, Asia Pacific- 30%, South & Central America- 10% Middle East & Africa- 15%,
Note: Others include sales managers, engineers, and regional managers.
Note: The tiers of the companies are defined on the basis of their total revenues as of 2022. Tier 1: > USD 1 billion, Tier 2: From USD 500 million to USD 1 billion, and Tier 3: < USD 500 million
The oil and gas pumps market is dominated by a few major players that have a wide regional presence. The leading players in the oil and gas pumps market are Atlas Copco AB (Sweden); Flowserve Corporation (US); Sulzer Ltd (Switzerland); KSB SE & Co. KGaA (Germany); Nikkiso Co., Ltd. (Japan). The major strategy adopted by the players includes new product launches, partnerships, acquisitions, and investments & expansions.
Research Coverage:
The report defines, describes, and forecasts the global oil and gas pumps market by , storage form, technology, application, and end-user. It also offers a detailed qualitative and quantitative analysis of the market. The report comprehensively reviews the major market drivers, restraints, opportunities, and challenges. It also covers various important aspects of the market. These include an analysis of the competitive landscape, market dynamics, market estimates in terms of value, and future trends in the oil and gas pumps market.
Key Benefits of Buying the Report
- Contionously growing global demand, and Government and private sector investments in oil and gas infrastructure are few of the key factors driving the oil and gas pumps market. Factors such as high initial cost and regulatory and increasing environmental regulations restrain the growth of the market. The growing energy transition towards renewable energy sources and rapid urbanization are expected to present lucrative opportunities for the players operating in the oil and gas pumps market. The high competition from batteries and low energy density as compared to other fuels poses a major challenge for the players, especially for emerging players operating in the oil and gas pumps market.
- Product Development/ Innovation: The oil and gas pumps market is witnessing significant product development and innovation, driven by the growing demand for environmentally friendly, safe and sustainable products. Companies are investing in developing advanced oil & gas pumps technologies for various applications.
- Market Development: Atlas Copco acquired LEWA GmbH, a German manufacturer of diaphragm metering pumps, process pumps, and complete metering systems, including its subsidiaries, and Geveke B.V, an expert in pump systems, compressors, and associated services, including its subsidiaries, to strengthen its industrial pumps business.
- Market Diversification: KSB SE & Co. KGaA expanded its MeeaCKtype series by adding 19 new sizes. The new seal chamber design enables the installation of gland packings, mechanical seals that comply with EN 12756, and a large variety of cartridge type mechanical seals. This expansion ensures a higher degree of reliability and impraves overall system availability.
- Competitive Assessment: In-depth assessment of market shares, growth strategies, and service offerings of leading players, like include Atlas Copco AB (Sweden); Flowserve Corporation (US); Sulzer Ltd (Switzerland), KSB SE & Co. KGaA (Germany); Nikkiso Co., Ltd. (Japan)among others in the oil and gas pumps market.
TABLE OF CONTENTS
1 INTRODUCTION
- 1.1 STUDY OBJECTIVES
- 1.2 MARKET DEFINITION
- 1.3 INCLUSIONS AND EXCLUSIONS
- 1.4 MARKET SCOPE
- 1.4.1 OIL AND GAS PUMPS MARKET SEGMENTATION
- 1.4.2 REGIONAL SCOPE
- 1.4.3 YEARS CONSIDERED
- 1.5 CURRENCY CONSIDERED
- 1.6 LIMITATIONS
- 1.7 STAKEHOLDERS
- 1.8 SUMMARY OF CHANGES
- 1.8.1 IMPACT OF RECESSION
2 RESEARCH METHODOLOGY
- 2.1 RESEARCH DATA
- FIGURE 1 OIL AND GAS PUMPS MARKET: RESEARCH DESIGN
- 2.2 MARKET BREAKDOWN AND DATA TRIANGULATION
- FIGURE 2 DATA TRIANGULATION
- 2.2.1 SECONDARY DATA
- 2.2.1.1 List of major secondary sources
- 2.2.1.2 Key data from secondary sources
- 2.2.2 PRIMARY DATA
- 2.2.2.1 List of primary interview participants
- 2.2.2.2 Key data from primary sources
- 2.2.2.3 Breakdown of primaries
- FIGURE 3 BREAKDOWN OF PRIMARIES: BY COMPANY TYPE, DESIGNATION, AND REGION
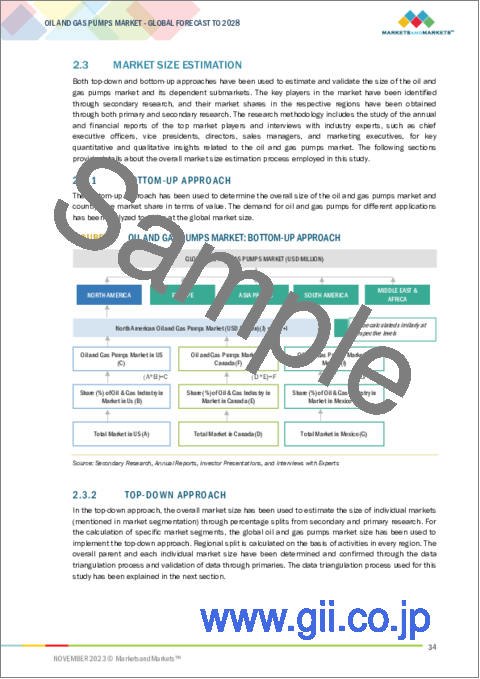
- 2.3 MARKET SIZE ESTIMATION
- 2.3.1 BOTTOM-UP APPROACH
- FIGURE 4 OIL AND GAS PUMPS MARKET: BOTTOM-UP APPROACH
- 2.3.2 TOP-DOWN APPROACH
- FIGURE 5 OIL AND GAS PUMPS MARKET: TOP-DOWN APPROACH
- 2.4 DEMAND-SIDE ANALYSIS
- 2.4.1 DEMAND-SIDE METRICS
- FIGURE 6 METRICS CONSIDERED TO ANALYZE AND ASSESS DEMAND FOR OIL AND GAS PUMPS
- 2.4.1.1 Assumptions for demand-side analysis
- 2.4.2 SUPPLY-SIDE ANALYSIS
- FIGURE 7 KEY METRICS CONSIDERED FOR ASSESSING SUPPLY OF OIL AND GAS PUMPS
- FIGURE 8 OIL AND GAS PUMPS MARKET: SUPPLY-SIDE ANALYSIS
- 2.4.2.1 Calculations for supply side
- 2.4.2.2 Assumptions for supply-side analysis
- 2.4.3 FORECAST
- 2.4.3.1 Risk assessment
- 2.4.3.2 Recession impact
3 EXECUTIVE SUMMARY
- TABLE 1 OIL AND GAS PUMPS MARKET SNAPSHOT
- FIGURE 9 NON-SUBMERSIBLE PUMPS TO CAPTURE LARGER MARKET SHARE IN 2028
- FIGURE 10 CENTRIFUGAL PUMPS TO LEAD OIL AND GAS PUMPS MARKET THROUGHOUT FORECAST PERIOD
- FIGURE 11 MIDSTREAM APPLICATIONS TO COMMAND OIL AND GAS PUMPS MARKET FROM 2023 TO 2028
- FIGURE 12 NORTH AMERICA DOMINATED OIL AND GAS PUMPS MARKET IN 2022
4 PREMIUM INSIGHTS
- 4.1 ATTRACTIVE OPPORTUNITIES IN OIL AND GAS PUMPS MARKET
- FIGURE 13 CONSTANT TECHNOLOGICAL DEVELOPMENTS IN DEEPWATER AND ULTRA-DEEPWATER OPERATIONS TO CREATE OPPORTUNITIES FOR PLAYERS IN OIL AND GAS PUMPS MARKET
- 4.2 OIL AND GAS PUMPS MARKET, BY TYPE
- FIGURE 14 NON-SUBMERSIBLE PUMPS SEGMENT DOMINATED OIL AND GAS PUMPS MARKET IN 2022
- 4.3 OIL AND GAS PUMPS MARKET, BY PUMP TYPE
- FIGURE 15 CENTRIFUGAL PUMPS LED OIL AND GAS PUMPS MARKET IN 2022
- 4.4 OIL AND GAS PUMPS MARKET, BY APPLICATION
- FIGURE 16 MIDSTREAM APPLICATIONS COMMANDED OIL AND GAS PUMPS MARKET IN 2022
- FIGURE 17 ASIA PACIFIC TO BE FASTEST-GROWING MARKET DURING FORECAST PERIOD
- 4.5 OIL AND GAS PUMPS MARKET IN NORTH AMERICA, BY APPLICATION AND COUNTRY
- FIGURE 18 MIDSTREAM SEGMENT AND US ACCOUNTED FOR LARGEST SHARE OF NORTH AMERICAN MARKET IN 2022
5 MARKET OVERVIEW
- 5.1 INTRODUCTION
- 5.2 MARKET DYNAMICS
- FIGURE 19 OIL AND GAS PUMPS MARKET: DRIVERS, RESTRAINTS, OPPORTUNITIES, AND CHALLENGES
- 5.2.1 DRIVERS
- 5.2.1.1 Continuous shale development activities
- FIGURE 20 TOP COUNTRIES WITH TECHNICALLY RECOVERABLE SHALE OIL RESOURCES
- FIGURE 21 TOP COUNTRIES WITH TECHNICALLY RECOVERABLE SHALE GAS RESOURCES
- 5.2.1.2 Rapid expansion of gas terminals
- 5.2.1.3 Increased global demand for oil
- FIGURE 22 GLOBAL OIL DEMAND, 2019-2028
- TABLE 2 GLOBAL OIL DEMAND (OECD VS. NON-OECD), 2021-2028
- 5.2.2 RESTRAINTS
- 5.2.2.1 Increasing focus on use of renewable energy
- 5.2.3 OPPORTUNITIES
- 5.2.3.1 Discovery of new oilfields
- 5.2.3.2 Ongoing pipeline infrastructure development projects in Asia Pacific and Middle East
- 5.2.4 CHALLENGES
- 5.2.4.1 High competition and volatile crude oil prices
- 5.2.4.2 Difficulties in reducing delivery/lead time
- 5.3 TRENDS/DISRUPTIONS IMPACTING CUSTOMER BUSINESS
- FIGURE 23 TRENDS AND DISRUPTIONS IMPACTING CUSTOMERS OF OIL AND GAS PUMP PROVIDERS
- 5.4 SUPPLY CHAIN ANALYSIS
- FIGURE 24 OIL AND GAS PUMPS MARKET: SUPPLY CHAIN ANALYSIS
- 5.4.1 RAW MATERIAL/COMPONENT PROVIDERS
- 5.4.2 PUMPS MANUFACTURERS
- 5.4.3 END USERS
- 5.5 ECOSYSTEM ANALYSIS
- FIGURE 25 OIL AND GAS PUMP ECOSYSTEM
- 5.6 TECHNOLOGY ANALYSIS
- 5.6.1 VARIABLE SPEED DRIVES (VSDS)
- 5.6.2 SUBMERSIBLE PUMPS
- 5.6.3 INTELLIGENT PUMPS
- 5.6.4 ROBOTICS AND AUTOMATION
- 5.7 KEY CONFERENCES AND EVENTS
- TABLE 3 LIST OF CONFERENCES AND EVENTS IN OIL AND GAS PUMPS MARKET, 2023-2024
- 5.8 PATENT ANALYSIS
- FIGURE 26 INNOVATIONS AND PATENT REGISTRATIONS PERTAINING TO OIL AND GAS PUMPS, 2012-2022
- 5.8.1 LIST OF MAJOR PATENTS
- 5.9 REGULATORY LANDSCAPE
- 5.9.1 REGULATORY BODIES, GOVERNMENT AGENCIES, AND OTHER ORGANIZATIONS
- TABLE 4 NORTH AMERICA: LIST OF REGULATORY BODIES, GOVERNMENT AGENCIES, AND OTHER ORGANIZATIONS
- TABLE 5 EUROPE: LIST OF REGULATORY BODIES, GOVERNMENT AGENCIES, AND OTHER ORGANIZATIONS
- TABLE 6 ASIA PACIFIC: LIST OF REGULATORY BODIES, GOVERNMENT AGENCIES, AND OTHER ORGANIZATIONS
- TABLE 7 SOUTH AMERICA: LIST OF REGULATORY BODIES, GOVERNMENT AGENCIES, AND OTHER ORGANIZATIONS
- TABLE 8 MIDDLE EAST & AFRICA: LIST OF REGULATORY BODIES, GOVERNMENT AGENCIES, AND OTHER ORGANIZATIONS
- 5.9.2 REGULATORY FRAMEWORK
- TABLE 9 REGULATIONS
- 5.10 PRICING ANALYSIS
- 5.10.1 INDICATIVE PRICING TREND OF PUMPS, BY REGION
- TABLE 10 INDICATIVE PRICE RANGE OF PUMPS, BY REGION, 2022-2028
- 5.10.2 INDICATIVE PRICING TREND OF PUMPS, BY PUMP TYPE
- TABLE 11 INDICATIVE PRICE RANGE OF PUMPS, BY PUMP TYPE, 2022-2028
- 5.11 CASE STUDY ANALYSIS
- 5.11.1 CHEVRON OPTIMIZES PUMP SYSTEM PERFORMANCE WITH INTEGRATION OF VARIABLE SPEED DRIVES
- 5.11.2 BP MINIMIZES DOWNTIME WITH INSTALLATION OF INTELLIGENT PUMP MONITORING SYSTEMS
- 5.11.3 EXXONMOBIL REDUCES ENVIRONMENTAL IMPACT BY UTILIZING SOLAR-POWERED PUMPS
- 5.12 EXPORT/IMPORT SCENARIOS, BY HS CODE
- 5.12.1 HS CODE 8413
- 5.12.1.1 Export scenario
- TABLE 12 EXPORT SCENARIO FOR HS CODE 8413-COMPLIANT PRODUCTS, BY COUNTRY, 2020-2022 (USD)
- FIGURE 27 EXPORT SCENARIO FOR HS CODE 8413-COMPLIANT PRODUCTS FOR TOP 5 COUNTRIES, 2020-2022 (USD)
- 5.12.1.2 Import scenario
- TABLE 13 IMPORT SCENARIO FOR HS CODE 8413-COMPLIANT PRODUCTS, BY COUNTRY, 2020-2022 (USD)
- FIGURE 28 IMPORT SCENARIO FOR HS CODE 8413-COMPLIANT PRODUCTS FOR TOP 5 COUNTRIES, 2020-2022 (USD)
- 5.12.1 HS CODE 8413
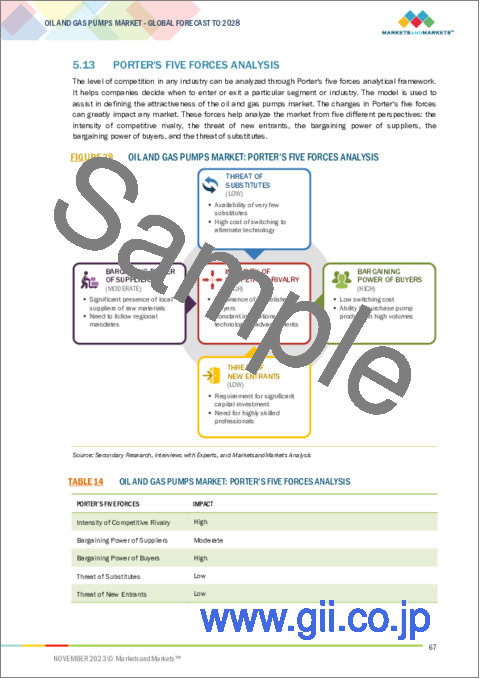
- 5.13 PORTER'S FIVE FORCES ANALYSIS
- FIGURE 29 OIL AND GAS PUMPS MARKET: PORTER'S FIVE FORCES ANALYSIS
- TABLE 14 OIL AND GAS PUMPS MARKET: PORTER'S FIVE FORCES ANALYSIS
- 5.13.1 THREAT OF NEW ENTRANTS
- 5.13.2 BARGAINING POWER OF BUYERS
- 5.13.3 BARGAINING POWER OF SUPPLIERS
- 5.13.4 THREAT OF SUBSTITUTES
- 5.13.5 INTENSITY OF COMPETITIVE RIVALRY
- 5.14 KEY STAKEHOLDERS AND BUYING CRITERIA
- 5.14.1 KEY STAKEHOLDERS IN BUYING PROCESS
- FIGURE 30 INFLUENCE OF STAKEHOLDERS ON BUYING PROCESS OF PUMP TYPE
- TABLE 15 INFLUENCE OF STAKEHOLDERS ON BUYING PROCESS OF PUMP TYPES (%)
- 5.14.2 BUYING CRITERIA
- FIGURE 31 KEY BUYING CRITERIA FOR OIL AND GAS PUMP TYPES
- TABLE 16 KEY BUYING CRITERIA FOR OIL AND GAS PUMP TYPES
6 OIL AND GAS PUMPS MARKET, BY TYPE
- 6.1 INTRODUCTION
- FIGURE 32 OIL AND GAS PUMPS MARKET SHARE, BY TYPE, 2022
- TABLE 17 OIL AND GAS PUMPS MARKET, BY TYPE, 2021-2028 (USD MILLION)
- 6.2 SUBMERSIBLE PUMPS
- 6.2.1 INCREASING OFFSHORE OIL AND GAS ACTIVITIES TO ACCELERATE SEGMENTAL GROWTH
- TABLE 18 SUBMERSIBLE PUMPS: OIL AND GAS PUMPS MARKET, BY REGION, 2021-2028 (USD MILLION)
- 6.3 NON-SUBMERSIBLE PUMPS
- 6.3.1 GROWING INVESTMENTS IN MIDSTREAM INFRASTRUCTURE DEVELOPMENT TO FUEL SEGMENTAL GROWTH
- TABLE 19 NON-SUBMERSIBLE PUMPS: OIL AND GAS PUMPS MARKET, BY REGION, 2021-2028 (USD MILLION)
7 OIL AND GAS PUMPS MARKET, BY PUMP TYPE
- 7.1 INTRODUCTION
- FIGURE 33 OIL AND GAS PUMPS MARKET SHARE, BY PUMP TYPE, 2022
- TABLE 20 OIL AND GAS PUMPS MARKET, BY PUMP TYPE, 2021-2028 (USD MILLION)
- 7.2 CENTRIFUGAL PUMPS
- 7.2.1 INCREASING INVESTMENTS IN OIL AND GAS SECTOR IN EMERGING ECONOMIES TO FUEL MARKET GROWTH
- TABLE 21 CENTRIFUGAL PUMPS: OIL AND GAS PUMPS MARKET, BY REGION, 2021-2028 (USD MILLION)
- 7.3 POSITIVE DISPLACEMENT PUMPS
- 7.3.1 GROWING FOCUS ON UPSTREAM ACTIVITIES TO BOOST DEMAND
- 7.3.2 SCREW PUMPS
- 7.3.2.1 Implementation of advanced control systems and remote monitoring solutions to boost demand
- 7.3.3 RECIPROCATING PUMPS
- 7.3.3.1 Utilization in most abrasive and corrosive applications to accelerate demand
- 7.3.3.2 Diaphragm pumps
- 7.3.3.2.1 Ability to handle many aggressive chemicals to increase adoption
- 7.3.3.3 Multi-plunger pumps
- 7.3.3.3.1 Capability to handle solid and viscous-containing media to fuel demand
- 7.3.3.4 Piston pumps
- 7.3.3.4.1 Deployment in water injection, water jet cutting, fluid transfer, and other industrial applications to foster market growth
- 7.3.4 ROTARY AND GEAR PUMPS
- 7.3.4.1 Adoption in exploration, production, and refining processes in oil & gas sector for seamless flow of fluids to drive market
- 7.3.5 PROGRESSING CAVITY PUMPS
- 7.3.5.1 Implementation of PCPs in crude oil production, water injection, and wastewater disposal to boost demand
- TABLE 22 POSITIVE DISPLACEMENT PUMPS: OIL AND GAS PUMPS MARKET, BY PUMP TYPE, 2021-2028 (USD MILLION)
- TABLE 23 RECIPROCATING PUMPS: OIL AND GAS PUMPS MARKET, BY PUMP TYPE, 2021-2028 (USD MILLION)
- TABLE 24 POSITIVE DISPLACEMENT PUMPS: OIL AND GAS PUMPS MARKET, BY REGION, 2021-2028 (USD MILLION)
- 7.4 CRYOGENIC PUMPS
- 7.4.1 ABILITY TO OPERATE IN EXTREMELY LOW-TEMPERATURE ENVIRONMENTS TO SURGE DEMAND
- TABLE 25 CRYOGENIC PUMPS: OIL AND GAS PUMPS MARKET, BY REGION, 2021-2028 (USD MILLION)
8 OIL AND GAS PUMPS MARKET, BY APPLICATION
- 8.1 INTRODUCTION
- FIGURE 34 OIL AND GAS PUMPS MARKET SHARE, BY APPLICATION, 2022
- TABLE 26 OIL AND GAS PUMPS MARKET, BY APPLICATION, 2021-2028 (USD MILLION)
- 8.2 UPSTREAM
- 8.2.1 INCREASING OIL AND GAS EXPLORATION AND PRODUCTION ACTIVITIES TO DRIVE SEGMENTAL GROWTH
- 8.2.2 ARTIFICIAL LIFT PUMPS (ONSHORE)
- 8.2.2.1 Need to optimize production from mature fields to fuel market growth
- 8.2.3 PRODUCED WATER HANDLING SYSTEMS (ONSHORE)
- 8.2.3.1 Growing adoption of water reuse technologies to boost demand
- 8.2.4 SOLID CONTROL EQUIPMENT (ONSHORE)
- 8.2.4.1 Requirement to remove solids and contaminants during drilling activities to accelerate demand
- 8.2.5 SEAWATER LIFT PUMPS
- 8.2.5.1 Implementation of advanced monitoring and automation technologies to increase adoption
- 8.2.6 WATER AND CO2 INJECTION SYSTEMS
- 8.2.6.1 Pressing need to capture and store carbon and prevent its release into atmosphere to drive market
- 8.2.7 SAFETY AND FIREFIGHTING SYSTEMS
- 8.2.7.1 Increasing focus on workplace safety to boost demand
- 8.2.8 GATHERING AND SEPARATION SYSTEMS
- 8.2.8.1 Increasing production of natural gas to propel market
- TABLE 27 UPSTREAM: OIL AND GAS PUMPS MARKET, BY APPLICATION, 2021-2028 (USD MILLION)
- TABLE 28 UPSTREAM: OIL AND GAS PUMPS MARKET, BY REGION, 2021-2028 (USD MILLION)
- 8.3 MIDSTREAM
- 8.3.1 INCREASING INVESTMENTS IN OIL AND GAS INFRASTRUCTURE DEVELOPMENT TO DRIVE MARKET
- 8.3.2 PIPELINE BOOSTING (ONSHORE)
- 8.3.2.1 Expansion of oil and gas pipeline networks to fuel demand
- 8.3.3 TERMINALS
- 8.3.3.1 Need to redistribute fluids during midstream activities to drive market
- 8.3.4 OTHERS
- TABLE 29 MIDSTREAM: OIL AND GAS PUMPS MARKET, BY APPLICATION, 2021-2028 (USD MILLION)
- TABLE 30 MIDSTREAM: OIL AND GAS PUMPS MARKET, BY REGION, 2021-2028 (USD MILLION)
- 8.4 DOWNSTREAM
- 8.4.1 RISING FOCUS ON ENHANCING REFINING CAPACITY TO DRIVE MARKET
- 8.4.2 PRIMARY PROCESSING SYSTEMS
- 8.4.2.1 Increasing demand for refined petroleum products to fuel segmental growth
- 8.4.3 SECONDARY PROCESSING SYSTEMS
- 8.4.3.1 Rising use of high-quality petroleum products to boost segmental growth
- 8.4.4 STORAGE AND TRANSFER SYSTEMS
- 8.4.4.1 Increasing focus on expanding storage capacity of refined petroleum products to fuel market growth
- TABLE 31 DOWNSTREAM: OIL AND GAS PUMPS MARKET, BY APPLICATION, 2021-2028 (USD MILLION)
- TABLE 32 DOWNSTREAM: OIL AND GAS PUMPS MARKET, BY REGION, 2021-2028 (USD MILLION)
9 OIL AND GAS PUMPS MARKET, BY REGION
- 9.1 INTRODUCTION
- FIGURE 35 OIL AND GAS PUMPS MARKET IN ASIA PACIFIC TO GROW AT HIGHEST CAGR DURING FORECAST PERIOD
- FIGURE 36 OIL AND GAS PUMPS MARKET SHARE, BY REGION, 2022
- TABLE 33 OIL AND GAS PUMPS MARKET, BY REGION, 2021-2028 (USD MILLION)
- TABLE 34 OIL AND GAS PUMPS MARKET, BY REGION, 2021-2028 (UNITS)
- 9.2 ASIA PACIFIC
- 9.2.1 RECESSION IMPACT: ASIA PACIFIC
- FIGURE 37 REGIONAL SNAPSHOT: ASIA PACIFIC
- 9.2.2 BY TYPE
- TABLE 35 ASIA PACIFIC: OIL AND GAS PUMPS MARKET, BY TYPE, 2021-2028 (USD MILLION)
- 9.2.3 BY PUMP TYPE
- TABLE 36 ASIA PACIFIC: OIL AND GAS PUMPS MARKET, BY PUMP TYPE, 2021-2028 (USD MILLION)
- 9.2.4 BY APPLICATION
- TABLE 37 ASIA PACIFIC: OIL AND GAS PUMPS MARKET, BY APPLICATION, 2021-2028 (USD MILLION)
- 9.2.5 BY COUNTRY
- TABLE 38 ASIA PACIFIC: OIL AND GAS PUMPS MARKET, BY COUNTRY, 2021-2028 (USD MILLION)
- 9.2.5.1 China
- 9.2.5.1.1 Rising focus on increasing oil and gas production to meet energy demand to drive market
- 9.2.5.1 China
- TABLE 39 CHINA: OIL AND GAS PUMPS MARKET, BY PUMP TYPE, 2021-2028 (USD MILLION)
- TABLE 40 CHINA: OIL AND GAS PUMPS MARKET, BY APPLICATION, 2021-2028 (USD MILLION)
- 9.2.5.2 Japan
- 9.2.5.2.1 Strong focus on reducing import of oil and natural gas to boost demand for oil and gas pumps
- 9.2.5.2 Japan
- TABLE 41 JAPAN: OIL AND GAS PUMPS MARKET, BY PUMP TYPE, 2021-2028 (USD MILLION)
- TABLE 42 JAPAN: OIL AND GAS PUMPS MARKET, BY APPLICATION, 2021-2028 (USD MILLION)
- 9.2.5.3 India
- 9.2.5.3.1 Government initiatives to expand natural gas pipeline network to accelerate market growth
- 9.2.5.3 India
- TABLE 43 INDIA: OIL AND GAS PUMPS MARKET, BY PUMP TYPE, 2021-2028 (USD MILLION)
- TABLE 44 INDIA: OIL AND GAS PUMPS MARKET, BY APPLICATION, 2021-2028 (USD MILLION)
- 9.2.5.4 South Korea
- 9.2.5.4.1 Efforts to increase energy production to boost demand for oil and gas pumps
- 9.2.5.4 South Korea
- TABLE 45 SOUTH KOREA: OIL AND GAS PUMPS MARKET, BY PUMP TYPE, 2021-2028 (USD MILLION)
- TABLE 46 SOUTH KOREA: OIL AND GAS PUMPS MARKET, BY APPLICATION, 2021-2028 (USD MILLION)
- 9.2.5.5 Australia
- 9.2.5.5.1 Development of natural gas reserves to drive market
- 9.2.5.5 Australia
- TABLE 47 AUSTRALIA: OIL AND GAS PUMPS MARKET, BY PUMP TYPE, 2021-2028 (USD MILLION)
- TABLE 48 AUSTRALIA: OIL AND GAS PUMPS MARKET, BY APPLICATION, 2021-2028 (USD MILLION)
- 9.2.5.6 Rest of Asia Pacific
- TABLE 49 REST OF ASIA PACIFIC: OIL AND GAS PUMPS MARKET, BY PUMP TYPE, 2021-2028 (USD MILLION)
- TABLE 50 REST OF ASIA PACIFIC: OIL AND GAS PUMPS MARKET, BY APPLICATION, 2021-2028 (USD MILLION)
- 9.3 NORTH AMERICA
- 9.3.1 RECESSION IMPACT: NORTH AMERICA
- FIGURE 38 REGIONAL SNAPSHOT: NORTH AMERICA
- 9.3.2 BY TYPE
- TABLE 51 NORTH AMERICA: OIL AND GAS PUMPS MARKET, BY TYPE, 2021-2028 (USD MILLION)
- 9.3.3 BY PUMP TYPE
- TABLE 52 NORTH AMERICA: OIL AND GAS PUMPS MARKET, BY PUMP TYPE, 2021-2028 (USD MILLION)
- 9.3.4 BY APPLICATION
- TABLE 53 NORTH AMERICA: OIL AND GAS PUMPS MARKET, BY APPLICATION, 2021-2028 (USD MILLION)
- 9.3.5 BY COUNTRY
- TABLE 54 NORTH AMERICA: OIL AND GAS PUMPS MARKET, BY COUNTRY, 2021-2028 (USD MILLION)
- 9.3.5.1 US
- 9.3.5.1.1 Rapid shale development activities to drive market
- 9.3.5.1 US
- TABLE 55 US: OIL AND GAS PUMPS MARKET, BY PUMP TYPE, 2021-2028 (USD MILLION)
- TABLE 56 US: OIL AND GAS PUMPS MARKET, BY APPLICATION, 2021-2028 (USD MILLION)
- 9.3.5.2 Canada
- 9.3.5.2.1 Installation of new pipeline projects to fuel demand
- 9.3.5.2 Canada
- TABLE 57 CANADA: OIL AND GAS PUMPS MARKET, BY PUMP TYPE, 2021-2028 (USD MILLION)
- TABLE 58 CANADA: OIL AND GAS PUMPS MARKET, BY APPLICATION, 2021-2028 (USD MILLION)
- 9.3.5.3 Mexico
- 9.3.5.3.1 Increasing offshore oil and gas activities to support market growth
- 9.3.5.3 Mexico
- TABLE 59 MEXICO: OIL AND GAS PUMPS MARKET, BY PUMP TYPE, 2021-2028 (USD MILLION)
- TABLE 60 MEXICO: OIL AND GAS PUMPS MARKET, BY APPLICATION, 2021-2028 (USD MILLION)
- 9.4 EUROPE
- 9.4.1 RECESSION IMPACT: EUROPE
- 9.4.2 BY TYPE
- TABLE 61 EUROPE: OIL AND GAS PUMPS MARKET, BY TYPE, 2021-2028 (USD MILLION)
- 9.4.3 BY PUMP TYPE
- TABLE 62 EUROPE: OIL AND GAS PUMPS MARKET, BY PUMP TYPE, 2021-2028 (USD MILLION)
- 9.4.4 BY APPLICATION
- TABLE 63 EUROPE: OIL AND GAS PUMPS MARKET, BY APPLICATION, 2021-2028 (USD MILLION)
- 9.4.5 BY COUNTRY
- TABLE 64 EUROPE: OIL AND GAS PUMPS MARKET SIZE, BY COUNTRY, 2021-2028 (USD MILLION)
- 9.4.5.1 Russia
- 9.4.5.1.1 Rising focus on building new oil and gas pipelines to support market growth
- 9.4.5.1 Russia
- TABLE 65 RUSSIA: OIL AND GAS PUMPS MARKET, BY PUMP TYPE, 2021-2028 (USD MILLION)
- TABLE 66 RUSSIA: OIL AND GAS PUMPS MARKET, BY APPLICATION, 2021-2028 (USD MILLION)
- 9.4.5.2 Germany
- 9.4.5.2.1 Ongoing midstream and downstream infrastructure development projects to boost demand
- 9.4.5.2 Germany
- TABLE 67 GERMANY: OIL AND GAS PUMPS MARKET, BY PUMP TYPE, 2021-2028 (USD MILLION)
- TABLE 68 GERMANY: OIL AND GAS PUMPS MARKET, BY APPLICATION, 2021-2028 (USD MILLION)
- 9.4.5.3 France
- 9.4.5.3.1 In-progress underwater gas pipeline projects to contribute to market growth
- 9.4.5.3 France
- TABLE 69 FRANCE: OIL AND GAS PUMPS MARKET, BY PUMP TYPE, 2021-2028 (USD MILLION)
- TABLE 70 FRANCE: OIL AND GAS PUMPS MARKET, BY APPLICATION, 2021-2028 (USD MILLION)
- 9.4.5.4 Italy
- 9.4.5.4.1 Significant focus on enhancing oil and gas production capacity to foster demand
- 9.4.5.4 Italy
- TABLE 71 ITALY: OIL AND GAS PUMPS MARKET, BY PUMP TYPE, 2021-2028 (USD MILLION)
- TABLE 72 ITALY: OIL AND GAS PUMPS MARKET, BY APPLICATION, 2021-2028 (USD MILLION)
- 9.4.5.5 UK
- 9.4.5.5.1 Shifting focus toward brownfield projects to accelerate demand
- 9.4.5.5 UK
- TABLE 73 UK: OIL AND GAS PUMPS MARKET, BY PUMP TYPE, 2021-2028 (USD MILLION)
- TABLE 74 UK: OIL AND GAS PUMPS MARKET, BY APPLICATION, 2021-2028 (USD MILLION)
- 9.4.5.6 Norway
- 9.4.5.6.1 Growing oil and gas exploration and production activities to fuel demand
- 9.4.5.6 Norway
- TABLE 75 NORWAY: OIL AND GAS PUMPS MARKET, BY PUMP TYPE, 2021-2028 (USD MILLION)
- TABLE 76 NORWAY: OIL AND GAS PUMPS MARKET, BY APPLICATION, 2021-2028 (USD MILLION)
- 9.4.5.7 Rest of Europe
- TABLE 77 REST OF EUROPE: OIL AND GAS PUMPS MARKET, BY PUMP TYPE, 2021-2028 (USD MILLION)
- TABLE 78 REST OF EUROPE: OIL AND GAS PUMPS MARKET, BY APPLICATION, 2021-2028 (USD MILLION)
- 9.5 MIDDLE EAST & AFRICA
- 9.5.1 RECESSION IMPACT: MIDDLE EAST & AFRICA
- 9.5.2 BY TYPE
- TABLE 79 MIDDLE EAST & AFRICA: OIL AND GAS PUMPS MARKET, BY TYPE, 2021-2028 (USD MILLION)
- 9.5.3 BY PUMP TYPE
- TABLE 80 MIDDLE EAST & AFRICA: OIL AND GAS PUMPS MARKET, BY PUMP TYPE, 2021-2028 (USD MILLION)
- 9.5.4 BY APPLICATION
- TABLE 81 MIDDLE EAST & AFRICA: OIL AND GAS PUMPS MARKET, BY APPLICATION, 2021-2028 (USD MILLION)
- 9.5.5 BY COUNTRY
- TABLE 82 MIDDLE EAST & AFRICA: OIL AND GAS PUMPS MARKET, BY COUNTRY, 2021-2028 (USD MILLION)
- TABLE 83 GCC COUNTRIES: OIL AND GAS PUMPS MARKET, BY COUNTRY, 2021-2028 (USD MILLION)
- 9.5.5.1 GCC countries
- 9.5.5.1.1 Saudi Arabia
- 9.5.5.1.1.1 Significant presence of proven oil reserves to boost demand
- 9.5.5.1.1 Saudi Arabia
- 9.5.5.1 GCC countries
- TABLE 84 SAUDI ARABIA: OIL AND GAS PUMPS MARKET, BY PUMP TYPE, 2021-2028 (USD MILLION)
- TABLE 85 SAUDI ARABIA: OIL AND GAS PUMPS MARKET, BY APPLICATION, 2021-2028 (USD MILLION)
- 9.5.5.1.2 UAE
- 9.5.5.1.2.1 Intension to become net gas exporter and provide long-term power source to fuel market growth
- 9.5.5.1.2 UAE
- TABLE 86 UAE: OIL AND GAS PUMPS MARKET, BY PUMP TYPE, 2021-2028 (USD MILLION)
- TABLE 87 UAE: OIL AND GAS PUMPS MARKET, BY APPLICATION, 2021-2028 (USD MILLION)
- 9.5.5.1.3 Kuwait
- 9.5.5.1.3.1 Government plan to increase oil and natural gas production in coming years to drive market
- 9.5.5.1.3 Kuwait
- TABLE 88 KUWAIT: OIL AND GAS PUMPS MARKET, BY PUMP TYPE, 2021-2028 (USD MILLION)
- TABLE 89 KUWAIT: OIL AND GAS PUMPS MARKET, BY APPLICATION, 2021-2028 (USD MILLION)
- 9.5.5.1.4 Qatar
- 9.5.5.1.4.1 Increasing production of LNG, crude oil, and petroleum products to contribute to market growth
- 9.5.5.1.4 Qatar
- TABLE 90 QATAR: OIL AND GAS PUMPS MARKET, BY PUMP TYPE, 2021-2028 (USD MILLION)
- TABLE 91 QATAR: OIL AND GAS PUMPS MARKET, BY APPLICATION, 2021-2028 (USD MILLION)
- 9.5.5.1.5 Rest of GCC countries
- TABLE 92 REST OF GCC COUNTRIES: OIL AND GAS PUMPS MARKET, BY PUMP TYPE, 2021-2028 (USD MILLION)
- TABLE 93 REST OF GCC COUNTRIES: OIL AND GAS PUMPS MARKET, BY APPLICATION, 2021-2028 (USD MILLION)
- 9.5.5.2 Angola
- 9.5.5.2.1 Abundance of untapped oil and gas reserves to propel demand
- 9.5.5.2 Angola
- TABLE 94 ANGOLA: OIL AND GAS PUMPS MARKET, BY PUMP TYPE, 2021-2028 (USD MILLION)
- TABLE 95 ANGOLA: OIL AND GAS PUMPS MARKET, BY APPLICATION, 2021-2028 (USD MILLION)
- 9.5.5.3 Nigeria
- 9.5.5.3.1 Presence of deepwater and ultra-deepwater reserves to fuel demand
- 9.5.5.3 Nigeria
- TABLE 96 NIGERIA: OIL AND GAS PUMPS MARKET, BY PUMP TYPE, 2021-2028 (USD MILLION)
- TABLE 97 NIGERIA: OIL AND GAS PUMPS MARKET, BY APPLICATION, 2021-2028 (USD MILLION)
- 9.5.5.4 Rest of Middle East & Africa
- TABLE 98 REST OF MIDDLE EAST & AFRICA: OIL AND GAS PUMPS MARKET, BY PUMP TYPE, 2021-2028 (USD MILLION)
- TABLE 99 REST OF MIDDLE EAST & AFRICA: OIL AND GAS PUMPS MARKET, BY APPLICATION, 2021-2028 (USD MILLION)
- 9.6 SOUTH AMERICA
- 9.6.1 RECESSION IMPACT: SOUTH AMERICA
- 9.6.2 BY TYPE
- TABLE 100 SOUTH AMERICA: OIL AND GAS PUMPS MARKET, BY TYPE, 2021-2028 (USD MILLION)
- 9.6.3 BY PUMP TYPE
- TABLE 101 SOUTH AMERICA: OIL AND GAS PUMPS MARKET, BY PUMP TYPE, 2021-2028 (USD MILLION)
- 9.6.4 BY APPLICATION
- TABLE 102 SOUTH AMERICA: OIL AND GAS PUMPS MARKET, BY APPLICATION, 2021-2028 (USD MILLION)
- 9.6.5 BY COUNTRY
- TABLE 103 SOUTH AMERICA: OIL AND GAS PUMPS MARKET, BY COUNTRY, 2021-2028 (USD MILLION)
- 9.6.5.1 Brazil
- 9.6.5.1.1 Increasing investments in exploration and production activities to drive market
- 9.6.5.1 Brazil
- TABLE 104 BRAZIL: OIL AND GAS PUMPS MARKET, BY PUMP TYPE, 2021-2028 (USD MILLION)
- TABLE 105 BRAZIL: OIL AND GAS PUMPS MARKET, BY APPLICATION, 2021-2028 (USD MILLION)
- 9.6.5.2 Argentina
- 9.6.5.2.1 Increasing focus on producing natural gas and reducing gas import to fuel demand
- 9.6.5.2 Argentina
- TABLE 106 ARGENTINA: OIL AND GAS PUMPS MARKET, BY PUMP TYPE, 2021-2028 (USD MILLION)
- TABLE 107 ARGENTINA: OIL AND GAS PUMPS MARKET, BY APPLICATION, 2021-2028 (USD MILLION)
- 9.6.5.3 Venezuela
- 9.6.5.3.1 Increasing oil and gas production to support market growth
- 9.6.5.3 Venezuela
- TABLE 108 VENEZUELA: OIL AND GAS PUMPS MARKET, BY PUMP TYPE, 2021-2028 (USD MILLION)
- TABLE 109 VENEZUELA: OIL AND GAS PUMPS MARKET, BY APPLICATION, 2021-2028 (USD MILLION)
- 9.6.5.4 Rest of South America
- TABLE 110 REST OF SOUTH AMERICA: OIL AND GAS PUMPS MARKET, BY PUMP TYPE, 2021-2028 (USD MILLION)
- TABLE 111 REST OF SOUTH AMERICA: OIL AND GAS PUMPS MARKET, BY APPLICATION, 2021-2028 (USD MILLION)
10 COMPETITIVE LANDSCAPE
- 10.1 OVERVIEW
- 10.2 STRATEGIES ADOPTED BY KEY PLAYERS, 2019-2023
- 10.3 MARKET SHARE ANALYSIS, 2022
- TABLE 112 OIL AND GAS PUMPS MARKET: DEGREE OF COMPETITION
- FIGURE 39 MARKET SHARE ANALYSIS OF TOP PLAYERS, 2022
- TABLE 113 KEY PLAYERS: BY PUMP TYPE
- 10.4 MARKET EVALUATION FRAMEWORK
- TABLE 114 MARKET EVALUATION FRAMEWORK, 2019-2023
- 10.5 SEGMENTAL REVENUE ANALYSIS OF KEY PLAYERS, 2018-2022
- FIGURE 40 SEGMENTAL REVENUE ANALYSIS, 2018-2022
- 10.6 COMPETITIVE SCENARIOS AND TRENDS
- 10.6.1 DEALS
- TABLE 115 OIL AND GAS PUMPS MARKET: DEALS, 2019-2023
- 10.6.2 OTHERS
- TABLE 116 OIL AND GAS PUMPS MARKET: OTHERS, 2019-2023
- 10.7 EVALUATION MATRIX OF KEY PLAYERS, 2022
- 10.7.1 STARS
- 10.7.2 EMERGING LEADERS
- 10.7.3 PERVASIVE PLAYERS
- 10.7.4 PARTICIPANTS
- FIGURE 41 OIL AND GAS PUMPS MARKET: EVALUATION MATRIX OF KEY COMPANIES, 2022
- 10.7.5 KEY COMPANY FOOTPRINT
- TABLE 117 TYPE FOOTPRINT (17 KEY COMPANIES)
- TABLE 118 PUMP TYPE FOOTPRINT (17 KEY COMPANIES)
- TABLE 119 APPLICATION FOOTPRINT (17 KEY COMPANIES)
- TABLE 120 REGION FOOTPRINT (17 KEY COMPANIES)
- TABLE 121 OVERALL FOOTPRINT (17 KEY COMPANIES)
- 10.8 EVALUATION MATRIX OF START-UPS/SMALL AND MEDIUM-SIZED ENTERPRISES (SMES), 2022
- 10.8.1 PROGRESSIVE COMPANIES
- 10.8.2 RESPONSIVE COMPANIES
- 10.8.3 DYNAMIC COMPANIES
- 10.8.4 STARTING BLOCKS
- FIGURE 42 OIL AND GAS PUMPS MARKET: EVALUATION MATRIX OF START-UPS/SMES, 2022
- 10.8.5 COMPETITIVE BENCHMARKING
- TABLE 122 OIL AND GAS PUMPS MARKET: LIST OF KEY START-UPS/SMES
- 10.8.6 START-UPS/SMES FOOTPRINT
- TABLE 123 TYPE FOOTPRINT: (5 START-UPS/SMES)
- TABLE 124 PUMP TYPE FOOTPRINT: (5 START-UPS/SMES)
- TABLE 125 APPLICATION FOOTPRINT: (5 START-UPS/SMES)
- TABLE 126 REGION FOOTPRINT: (5 START-UPS/SMES)
- TABLE 127 OVERALL FOOTPRINT (5 START-UPS/SMES)
11 COMPANY PROFILES
- 11.1 KEY COMPANIES
- (Business Overview, Products/Solutions/Services Offered, Recent Developments, MnM view (Key strengths/Right to win, Strategic choices made, Weakness/competitive threats)**
- 11.1.1 ATLAS COPCO AB
- TABLE 128 ATLAS COPCO AB: COMPANY OVERVIEW
- FIGURE 43 ATLAS COPCO AB: COMPANY SNAPSHOT
- TABLE 129 ATLAS COPCO AB: PRODUCTS/SERVICES/SOLUTIONS OFFERED
- TABLE 130 ATLAS COPCO AB: PRODUCT LAUNCHES
- TABLE 131 ATLAS COPCO AB: DEALS
- 11.1.2 FLOWSERVE CORPORATION
- TABLE 132 FLOWSERVE CORPORATION: COMPANY OVERVIEW
- FIGURE 44 FLOWSERVE CORPORATION: COMPANY SNAPSHOT
- TABLE 133 FLOWSERVE CORPORATION: PRODUCTS/SOLUTIONS/SERVICES OFFERED
- TABLE 134 FLOWSERVE CORPORATION: PRODUCT LAUNCHES
- 11.1.3 SULZER LTD
- TABLE 135 SULZER LTD: COMPANY OVERVIEW
- FIGURE 45 SULZER LTD: COMPANY SNAPSHOT
- TABLE 136 SULZER LTD: PRODUCTS/SOLUTIONS/SERVICES OFFERED
- 11.1.4 KSB SE & CO. KGAA
- TABLE 137 KSB SE & CO. KGAA: COMPANY OVERVIEW
- FIGURE 46 KSB SE & CO. KGAA: COMPANY SNAPSHOT
- TABLE 138 KSB SE & CO. KGAA: PRODUCTS/SOLUTIONS/SERVICES OFFERED
- TABLE 139 KSB SE & CO. KGAA: PRODUCT LAUNCHES
- TABLE 140 KSB SE & CO. KGAA: OTHERS
- 11.1.5 NIKKISO CO., LTD.
- TABLE 141 NIKKISO CO., LTD.: COMPANY OVERVIEW
- FIGURE 47 NIKKISO CO., LTD.: COMPANY SNAPSHOT
- TABLE 142 NIKKISO CO., LTD.: PRODUCTS/SOLUTIONS/SERVICES OFFERED
- 11.1.6 HYDROMASHSERVICE
- TABLE 143 HYDROMASHSERVICE: COMPANY OVERVIEW
- TABLE 144 HYDROMASHSERVICE: PRODUCTS/SOLUTIONS/SERVICES OFFERED
- 11.1.7 GARDNER DENVER
- TABLE 145 GARDNER DENVER: COMPANY OVERVIEW
- TABLE 146 GARDNER DENVER: PRODUCTS/SOLUTIONS/SERVICES OFFERED
- 11.1.8 XYLEM
- TABLE 147 XYLEM: COMPANY OVERVIEW
- FIGURE 48 XYLEM: COMPANY SNAPSHOT
- TABLE 148 XYLEM: PRODUCTS/SOLUTIONS/SERVICES OFFERED
- 11.1.9 SEEPEX GMBH
- TABLE 149 SEEPEX GMBH: COMPANY OVERVIEW
- TABLE 150 SEEPEX GMBH: PRODUCTS/SOLUTIONS/SERVICES OFFERED
- TABLE 151 SEEPEX GMBH: PRODUCT LAUNCHES
- 11.1.10 LEISTRITZ PUMPEN GMBH
- TABLE 152 LEISTRITZ PUMPEN GMBH: COMPANY OVERVIEW
- TABLE 153 LEISTRITZ PUMPEN GMBH: PRODUCTS/SERVICES/SOLUTIONS OFFERED
- 11.1.11 ITT GOULDS PUMPS
- TABLE 154 ITT GOULDS PUMPS: COMPANY OVERVIEW
- TABLE 155 ITT GOULDS PUMPS: PRODUCTS/SERVICES/SOLUTIONS OFFERED
- TABLE 156 ITT GOULDS PUMPS: DEALS
- 11.1.12 WILO SE
- TABLE 157 WILO SE: COMPANY OVERVIEW
- TABLE 158 WILO SE: PRODUCTS/SERVICES/SOLUTIONS OFFERED
- 11.1.13 SCHMITT KREISELPUMPEN
- TABLE 159 SCHMITT KREISELPUMPEN: COMPANY OVERVIEW
- TABLE 160 SCHMITT KREISELPUMPEN: PRODUCTS/SERVICES/SOLUTIONS OFFERED
- 11.1.14 TSURUMI MANUFACTURING CO., LTD.
- TABLE 161 TSURUMI MANUFACTURING CO., LTD.: COMPANY OVERVIEW
- FIGURE 49 TSURUMI MANUFACTURING CO., LTD.: COMPANY SNAPSHOT
- TABLE 162 TSURUMI MANUFACTURING CO., LTD.: PRODUCTS/SERVICES/SOLUTIONS OFFERED
- 11.1.15 EBARA CORPORATION
- TABLE 163 EBARA CORPORATION: COMPANY OVERVIEW
- FIGURE 50 EBARA CORPORATION: COMPANY SNAPSHOT
- TABLE 164 EBARA CORPORATION: PRODUCTS/SERVICES/SOLUTIONS OFFERED
- 11.2 OTHER PLAYERS
- 11.2.1 TRILLIUM FLOW TECHNOLOGIES
- 11.2.2 HALLIBURTON
- 11.2.3 BAKER HUGHES COMPANY
- 11.2.4 GORMAN-RUPP PUMPS
- 11.2.5 DESIGNED & ENGINEERED PUMPS
- *Details on Business Overview, Products/Solutions/Services Offered, Recent Developments, MnM view (Key strengths/Right to win, Strategic choices made, Weakness/competitive threats)** might not be captured in case of unlisted companies.
12 APPENDIX
- 12.1 INSIGHTS FROM INDUSTRY EXPERTS
- 12.2 DISCUSSION GUIDE
- 12.3 KNOWLEDGESTORE: MARKETSANDMARKETS' SUBSCRIPTION PORTAL
- 12.4 CUSTOMIZATION OPTIONS
- 12.5 RELATED REPORTS
- 12.6 AUTHOR DETAILS

