|
|
市場調査レポート
商品コード
1304610
複合材補修の世界市場:種類別 (構造、半構造、化粧品)・プロセス別 (ハンドレイアップ、真空注入、オートクレーブ)・最終用途産業別 (航空宇宙・防衛、風力エネルギー、自動車・輸送、船舶)・地域別の将来予測 (2028年まで)Composite Repair Market by Type (Structural, Semi-Structural, Cosmetic), Process (Hand Lay-Up, Vacuum Infusion, Autoclave), End-Use Industry (Aerospace & Defense, Wind Energy, Automotive & Transportation, Marine), and Region - Global Forecast to 2028 |
||||||
|
|
|||||||
|
● お客様のご希望に応じて、既存データの加工や未掲載情報(例:国別セグメント)の追加などの対応が可能です。 詳細はお問い合わせください。 |
|||||||


| 複合材補修の世界市場:種類別 (構造、半構造、化粧品)・プロセス別 (ハンドレイアップ、真空注入、オートクレーブ)・最終用途産業別 (航空宇宙・防衛、風力エネルギー、自動車・輸送、船舶)・地域別の将来予測 (2028年まで) |
|
出版日: 2023年07月05日
発行: MarketsandMarkets
ページ情報: 英文 185 Pages
納期: 即納可能
|
- 全表示
- 概要
- 目次
世界の複合材補修の市場規模は、2023年に186億米ドルと推定され、2023年から2028年にかけて13.0%のCAGRで成長し、2028年には342億米ドルに達すると予測されています。
風力エネルギー、自動車・輸送、航空宇宙・防衛産業における複合材補修需要の増加が、複合材補修市場の成長を促進すると予測される最も重要な要因の1つです。
"老朽構造物の修復投資の増加が、複合材補修市場を牽引"
米国では2020年までに国内インフラの修復に3兆3,000億米ドルを必要としています。橋の9本に1本は構造的に欠陥があり、60万7380本の橋の平均築年数は42年です。連邦道路局の試算によると、2028年までに現在の128億米ドルに加え、毎年205億米ドルを投資する必要があります。
米国成長法 (Grow America Act) は、老朽化した橋への投資を増やすと思われます。高速道路と橋は、4,791億米ドルの重要な補修工事を含め、8,082億米ドルの投資の必要性に直面しています。また、橋の11%は構造的に欠陥があると分類されています。2016会計年度には、インフラと交通システムの近代化のために6年間で4,780億米ドルの資金が提案されています。これには橋の補修と整備も含まれます。米国大統領の「Fix-it-First」イニシアチブのもと、294億米ドルの資金のうち25%が、構造的に欠陥のある州間橋の改善に向けられます。
欧州では、金属橋の約70%が50年以上、30%が100年以上経過しています。ドイツは橋梁・道路・鉄道・水路の建設と近代化に2,920億米ドルを費やす予定です。この資金のうち、70%は補修工事に充てられます。
"自己修復複合材料の導入による、複合材補修市場の抑制"
複合構造にさらなる機能性 (自己修復、センシング・モーフィング、雷保護、エネルギー貯蔵など) を持たせるための複合材料の調査が行われています。自己修復複合材料の例としては、中空繊維、ロストワックス法、シェフィールド固体ヒーリングなどがあります。
センシング:自己修復のためには、複合材料が自ら損傷を検知できる必要があります。そのために、光ファイバー/ブラッググレーティング、カーボン、ナノチューブ、グラフェン、強磁性マイクロワイヤー、アコースティックエミッションなど、多くのアプローチが開発されています。
モーフィング:モーフィングとは、形状を変えることができ、重量を増加させる補修技術を必要としない構造のことです。例えば、剛性を変化させて双安定構造を形成するトウステア複合材料、モーフィング波形構造、プレストレスト双安定複合材料などがあります。
雷保護:雷は航空機の複合材構造に損傷を与えます。物理的に損傷を与えることもあれば、誘導電圧や電流による間接的な影響を引き起こすこともあります。外杭の銅箔とメッシュ、カラー、ナット、ファスナーの絶縁キャップ、導電性塗料、ニッケルコート炭素繊維、シールド用アルミ箔ストリップなど、航空機を雷による損傷から守る方法はすでにいくつかあります。さらに、MASTコンソーシアム (英国国防総省のプログラム) が開発したSMA/炭素繊維一体織物プリフォームなど、新しい技術革新もいくつか行われています。このプログラムは、損傷耐性を向上させ、雷保護を提供します。カーボンナノチューブ (CNT) コーティングも、雷から構造を保護するための新機軸のひとつです。
これらの技術は研究段階にあるが、長期的にこれらの技術が実用化された後は、複合材補修技術は時代遅れになり、これらの方法に取って代わられる可能性があります。
"複合材補修の市場機会:最終用途産業における複合材使用の増加"
航空宇宙からパイプ・タンクまで、複合材料の使用増加は複合材料補修市場に巨大な機会をもたらすと思われます。航空宇宙産業では、燃費を向上させ、軽量部品を製造するため、市場に導入される新機種とともに複合材の使用が増加しています。例えば、Airbus A320やBoeing 777のような初期の航空機は、その総構造重量の10%~15%の複合材で構成されていましたが、A350、A350 XWB、A380、Boeing 787のような最近のモデルは、50%~53%の複合材が含まれています。
そのため、これらのモデルで複合材が使用されるようになり、修理の必要性は今後ますます高まると思われます。複合材補修市場は、長期予測期間において輸送機生産の成長に追随すると予想されます。
"複合材補修市場にとって、材料・試験の標準化の欠如が大きな課題となる"
複合材構造の構築に使用される材料・補修材料・補修プロセスに関しては、市場の標準化が不足しています。例えば、Boeing機とAirbus機とでは修理工程は全く異なります。これとは別に、修理工程は風力タービン、自動車、パイプ・タンクなど、業界によってさらに異なります。
また、複合材の補修に使用される標準的な材料も不足しています。そのため、修理業者は、Boeing機の修理にはプリプレグなどの高価な材料を、Airbus機の修理には別の材料を在庫しておかなければならないです。さらに、保存期間が限られているため、平均して90%の材料が無駄になってしまいます。このような制限のため、欧州では、材料・機器・修理技術・修理トレーニングの標準化を図るため、民間航空機複合材修理委員会 (CACRC) と呼ばれるグループが結成されました。
"アジア太平洋地域が金額面でも優位に立つ"
アジア太平洋地域は、2022年に複合材補修市場を金額ベースでリードし、2023年から2028年にかけて13.0%のCAGRを記録すると予測されています。同地域の市場成長は、風力エネルギー設置の増加と航空宇宙産業の成長によって牽引されています。アジア太平洋地域の複合材料需要は、新興経済諸国の性質により増加しています。この地域の政府は、航空機部品の製造とMRO産業の発展が、新興経済諸国にとって戦略的に重要であり、付加価値の高い製造活動の一部であると考えています。政府や他の様々な最終用途産業によるこうした行動は、この地域における複合材の消費を促進し、この地域における複合材補修の需要を増加させると思われます。
目次
第1章 イントロダクション
第2章 調査手法
第3章 エグゼクティブサマリー
第4章 重要考察
第5章 市場概要
- イントロダクション
- 市場力学
- 促進要因
- 抑制要因
- 機会
- 課題
- ポーターのファイブフォース分析
- 技術分析
- エコシステムマッピング
- バリューチェーン分析
- サプライチェーン分析
- 複合修理市場:楽観的、悲観的、現実的なシナリオ
- 特許分析
- ケーススタディ分析
- 顧客のビジネスに影響を与える動向と混乱
第6章 複合材補修市場:種類別
- イントロダクション
- 構造
- 半構造
- 表層
第7章 複合材補修市場:プロセス別
- イントロダクション
- ハンドレイアップ
- 真空注入
- オートクレーブ
- その他のプロセス
第8章 複合材補修市場:最終用途産業別
- イントロダクション
- 航空宇宙・防衛
- 風力エネルギー
- 自動車・輸送
- 船舶
- 建設
- パイプ・タンク
- その他の最終用途産業
第9章 複合材補修市場:地域別
- イントロダクション
- 北米
- 欧州
- アジア太平洋
- 中東・アフリカ
- ラテンアメリカ
第10章 競合情勢
- イントロダクション
- 市場シェア分析 (2022年)
- 市場ランキング分析
- 上位3社の収益分析
- 企業評価マトリックス
- スタートアップ/中小企業の評価マトリックス
- 市場評価の枠組み
第11章 企業プロファイル
- 主要企業
- LUFTHANSA TECHNIK AG
- AIR FRANCE-KLM E&M
- HAECO
- UPWIND SOLUTIONS, INC.
- TOTAL WIND GROUP
- TECHNICAL WIND SERVICES
- CITADEL TECHNOLOGIES
- MILLIKEN INFRASTRUCTURE
- T.D. WILLIAMSON
- WEST SYSTEM
- WR COMPOSITE
- CONCRETE REPAIRS LTD.
- WALKER TECHNICAL RESOURCES LTD.
- その他の企業
- FURMANITE CORPORATION
- COMPOSITE TECHNOLOGIES LTD.
- FGS COMPOSITES
- HAMBLE YACHT SERVICES
- CRAWFORD COMPOSITES LLC
- DELFT INFRA COMPOSITES
第12章 付録
The composite repair market is estimated to be USD 18.6 billion in 2023 and is projected to reach USD 34.2 billion by 2028, at a CAGR of 13.0% between 2023 and 2028. The increasing demand for composite repair in wind energy, automotive & transportation, aerospace & defense industry is one of the most significant factors projected to drive the growth of the composite repair market.
"Rising investment in the rehabilitation of old structures to drive the composite repair market"
According to the American Society of Civil Engineers 2018 Report Card, The U.S. requires USD 3.3 trillion to repair the country's infrastructure by 2020. It states that one out of nine bridges is structurally deficient and the average age of 607,380 bridges is 42 years. According to estimations of The Federal Highway Administration, the country needs to invest USD 20.5 billion annually, with addition to the current investment of USD 12.8 billion by 2028.
The Grow America Act will increase investment in aging bridges. According to the U.S. Department of Transportation, highways and bridges face a USD 808.2 billion backlog of investment needs, including USD 479.1 billion in critical repair work. Also, 11% of the bridges are classified as structurally deficient. The financial year 2016 proposes USD 478 billion funding for six years to modernize the infrastructure and transportation systems. This includes the repair and maintenance of bridges. Under the U.S. President's Fix-it-First initiative, 25% of the USD 29.4 billion funding will be directed to improve structurally deficient interstate bridges.
In Europe, approximately 70% of the metallic bridges are older than 50 years and 30% are older than 100 years. Germany will be spending USD 292 billion on the construction and modernization of bridges, roads, railways, and waterways. Out of this funding, 70% will go to repair work.
"Introduction of self-healing composites to restrain for composite repair market."
Research is being done on composites to provide additional functionalities to composite structures such as self-healing, sensing morphing, lightning protection, and energy storage. Examples of self-healing composites are hollow fibers, lost wax process, and Sheffield solid-state healing.
Sensing: For self-healing, composites need to be able to detect damage on their own. For this, many approaches are under development, such as fiber optic/Bragg gratings, carbon, nanotubes or graphene, Ferromagnetic microwires, and acoustic emission.
Morphing: Morphing refers to a structure that can change shape and does not require repair techniques that add weight. For example, tow-steered composites with variable stiffness to form bi-stable structures, morphing corrugated structures, and prestressed bistable composites.
Lightning protection: Lighting causes damage in the composite structures in aircraft. It can either physically damage them or cause indirect effects due to induced voltage and current. Few methods are already available to prevent aircraft from damage caused by lightning such as copper foils & meshes in the outer piles, insulation caps on collars, nuts and fasteners, conductive paints, nickel-coated carbon fibers, and aluminum foil strips for shielding, among others. In addition, few more new innovations are being carried out, such as an integral woven SMA/carbon fiber preform developed by MAST Consortium (U.K. MoD program). This program improves damage tolerance and provides lightning protection. Carbon nanotube (CNT) coating is also one of the new innovations to protect the structure from lightning.
Although these technologies are at the research stage, after the commercialization of these technologies in the long term, the composite repair technology may become outdated and could be replaced by these methods.
"Increasing use of composites in end-use industries to provide an opportunity for the composite repair market."
The increasing use of composites from aerospace to pipe & tank is going to provide huge opportunities for the composite repairs market. In order to increase fuel efficiency and to produce lightweight parts in the aerospace industry, the use of composites is increasing with the new models introduced in the market. For example, earlier aircraft such as Airbus A320 and Boeing 777 were made up of 10%-15% composites of their total structural weight; but the recent models such as A350, A350 XWB, A380, and Boeing 787 contain 50%-53% composites.
So, with the increasing usage of composites in these models, the requirement of repair will be increasing in the years to come. The composite repairs market is expected to follow the growth of transport aircraft production in the long-term forecast period.
"Lack of standardization on material; and testing to be a major challenge for composite repair market."
The market lacks in standardization when it comes to the material used for building the composite structure, the repair material, and the repair process. For example, the repair processes for Boeing and Airbus aircraft are totally different. Apart from this, the repair process further varies with industry to industry such as wind turbine, automotive, pipe & tank, and others.
The market also lacks in standard materials to be used in the composite repair. So, the repairers have to keep separate expensive materials, such as prepreg, in stock for Boeing aircraft repair, and a separate set of materials for Airbus aircraft repair. Moreover, due to the limited shelf life, on average 90% of the material are get wasted. Due to these limitations, a group called the Commercial Aircraft Composite Repair Committee (CACRC) was formed in Europe to adapt some standardization of materials, equipment, repair techniques, and repair training.
"Asia Pacific to be the dominating region in composite repair market in terms of both value"
Asia Pacific led the composite repair market, in terms of value, in 2022 and is projected to register a CAGR of 13.0% between 2023 and 2028. The growth of the region's market is driven by increasing wind energy installation and the growth of the aerospace industry in the region. The demand for composites in the Asia Pacific region is increasing due to the nature of developing economy. Increasing expenditure in the aerospace industry and constant investments from governments towards wind energy generation has led to this increased consumption of composites in the region. the governments in the region are considering aircraft part manufacturing and MRO industry development is strategically important for their growing economies in the region, as a part of value-added manufacturing activity. These actions by the governments and various other end-use industries is driving the consumption of composites in the region, which will increase the demand for composite repair in the region.
This study has been validated through primary interviews with industry experts globally. These primary sources have been divided into the following three categories:
- By Company Type- Tier 1- 60%, Tier 2- 20%, and Tier 3- 20%
- By Designation- C Level- 33%, Director Level- 33%, and Others- 34%
- By Region- North America- 20%, Europe- 25%, Asia Pacific (APAC) - 25%, Latin America-10%, Middle East & Africa (MEA)-20%
The report provides a comprehensive analysis of company profiles:
Prominent companies include Lufthansa Technik AG (Germany), Air France KLM E&M (France), and HAECO (U.S.), UpWind Solution (U.S.), Total Wind Group A/S (Denmark), and Technical Wind Services (Scotland), . Citadel Technologies (U.S.), Milliken Infrastructure (U.S.), and T.D. Williamson (U.S.), West Systems (U.S.) and WR Composites (U.K.), Fibrwraps (U.S.), and Concrete Repairs Ltd. (U.K.), among others.
Research Coverage
This report covers the global composite repair market and forecasts the market size until 2027. It includes the following market segmentation - by Type (Structural. Semi-Structural, Cosmetic), by Process (Hand Lay-Up, Vacuum Infusion, Autoclave, and Others), by End-Use Industry (Aerospace & Defense, Wind Energy, Automotive & Transportation, Marine, Construction, Pipes & tanks, and Others), and Region (North America, Europe, Asia Pacific, Middle East & Africa, Latin America). A detailed analysis of the key industry players has been done to provide insights into their business overview, solutions, services; key strategies; Contracts, partnerships, and agreements. New product & service launches, mergers and acquisitions, and recent developments associated with the composite repair market. Competitive analysis of upcoming startups in the composite repair market ecosystem is covered in this report.
Reasons to buy this report:
The report will help the market leaders/new entrants in this market with information on the closest approximations of the revenue numbers for the overall composite repair market and the subsegments. This report will help stakeholders understand the competitive landscape and gain more insights to position their businesses better and plan suitable go-to-market strategies. The report also helps stakeholders understand the pulse of the market and provides them with information on key market drivers, restraints, challenges, and opportunities.
The report provides insights on the following pointers:
- Analysis of key drivers (Rising investment in the rehabilitation of old structures, Cost savings associated with composite structure repair), restraints (Low penetration of composites in end-use industries in the least developed countries, Introduction of self-healing composites), opportunities (Increasing use of composites in end-use industries, New and advanced technologies introduced in the market, automation of composite repair), and challenges (Skilled labor shortage, lack of standardization on materials and testing, financial loss during composite repair) influencing the growth of the composite repair market
- Product Development/Innovation: Detailed insights on upcoming technologies, research & development activities, and new product & service launches in the composite repair market
- Market Development: Comprehensive information about lucrative markets - the report analyses the composite repair market across varied regions.
- Market Diversification: Exhaustive information about new products & services, untapped geographies, recent developments, and investments in the composite repair industry market
- Competitive Assessment: In-depth assessment of market shares, growth strategies, and service offerings of leading players like Lufthansa Technik AG (Germany), Air France KLM E&M (France), and HAECO (U.S.), UpWind Solution (U.S.), Total Wind Group A/S (Denmark), and Technical Wind Services (Scotland), Citadel Technologies (U.S.), Milliken Infrastructure (U.S.), and T.D. Williamson (U.S.), West Systems (U.S.) and WR Composites (U.K.), Fibrwraps (U.S.) and Concrete Repairs Ltd. (U.K.), among others in the composite repair market
TABLE OF CONTENTS
1 INTRODUCTION
- 1.1 STUDY OBJECTIVES
- 1.2 MARKET DEFINITION
- 1.2.1 INCLUSIONS AND EXCLUSIONS
- 1.3 MARKET SCOPE
- FIGURE 1 COMPOSITE REPAIR MARKET SEGMENTATION
- 1.3.1 REGIONS COVERED
- 1.3.2 YEARS CONSIDERED
- 1.4 CURRENCY CONSIDERED
- 1.5 UNIT CONSIDERED
- 1.6 LIMITATIONS
- 1.7 STAKEHOLDERS
- 1.8 SUMMARY OF CHANGES
- 1.8.1 IMPACT OF RECESSION
2 RESEARCH METHODOLOGY
- 2.1 RESEARCH APPROACH
- FIGURE 2 COMPOSITE REPAIR MARKET: RESEARCH DESIGN
- 2.2 RESEARCH DATA
- 2.2.1 SECONDARY DATA
- 2.2.1.1 Key data from secondary sources
- 2.2.2 PRIMARY DATA
- 2.2.2.1 Key data from primary sources
- 2.2.2.2 Primary interviews with top composite repair manufacturers
- 2.2.2.3 Breakdown of primary interviews
- 2.2.2.4 Key industry insights
- 2.2.1 SECONDARY DATA
- 2.3 BASE NUMBER CALCULATION
- 2.3.1 SUPPLY-SIDE APPROACH
- 2.3.2 DEMAND-SIDE APPROACH
- 2.4 FORECAST NUMBER CALCULATION
- 2.4.1 SUPPLY SIDE
- FIGURE 3 SUPPLY SIDE
- 2.4.2 DEMAND SIDE
- FIGURE 4 DEMAND SIDE
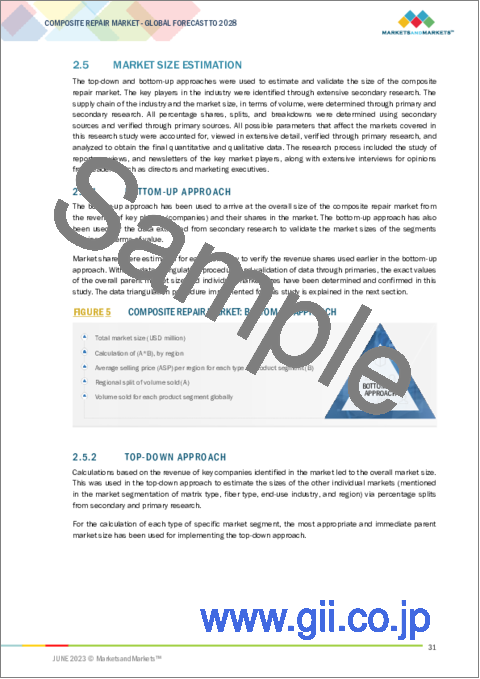
- 2.5 MARKET SIZE ESTIMATION
- 2.5.1 BOTTOM-UP APPROACH
- FIGURE 5 COMPOSITE REPAIR MARKET: BOTTOM-UP APPROACH
- 2.5.2 TOP-DOWN APPROACH
- FIGURE 6 COMPOSITE REPAIR MARKET: TOP-DOWN APPROACH
- 2.6 DATA TRIANGULATION
- FIGURE 7 COMPOSITE REPAIR MARKET: DATA TRIANGULATION
- 2.7 RESEARCH ASSUMPTIONS
- 2.8 GROWTH RATE ASSUMPTIONS
- 2.9 RESEARCH LIMITATIONS
- 2.10 RISK ASSESSMENT
- 2.11 IMPACT OF RECESSION
3 EXECUTIVE SUMMARY
- FIGURE 8 STRUCTURAL TYPE SEGMENT DOMINATED COMPOSITE REPAIR MARKET IN 2022
- FIGURE 9 HAND LAY-UP ACCOUNTED FOR LARGEST SHARE OF COMPOSITE REPAIR MARKET IN 2022
- FIGURE 10 AEROSPACE & DEFENSE GREW AT HIGHEST RATE IN 2022
- FIGURE 11 ASIA PACIFIC TO GROW AT FASTEST RATE DURING FORECAST PERIOD
- FIGURE 12 ASIA PACIFIC TO REGISTER HIGHEST GROWTH IN COMPOSITE REPAIR MARKET DURING FORECAST PERIOD
4 PREMIUM INSIGHTS
- 4.1 COMPOSITE REPAIR MARKET
- FIGURE 13 HIGH DEMAND FROM END USE INDUSTRIES TO DRIVE COMPOSITE REPAIR MARKET
- 4.2 COMPOSITE REPAIR MARKET, BY TYPE
- FIGURE 14 STRUCTURAL TYPE COMPOSITE REPAIR TO DOMINATE OVERALL MARKET
- 4.3 COMPOSITE REPAIR MARKET, BY PROCESS
- FIGURE 15 HAND LAY-UP PROCESS TO GROW AT FASTEST RATE DURING FORECAST PERIOD
- 4.4 COMPOSITE REPAIR MARKET, BY END USE INDUSTRY
- FIGURE 16 AEROSPACE & DEFENSE END USE INDUSTRY TO ACCOUNT FOR LARGEST MARKET SHARE IN 2023
- 4.5 COMPOSITE REPAIR MARKET GROWTH, BY KEY COUNTRY
- FIGURE 17 CHINA TO REGISTER HIGHEST CAGR DURING FORECAST PERIOD
5 MARKET OVERVIEW
- 5.1 INTRODUCTION
- 5.2 MARKET DYNAMICS
- FIGURE 18 COMPOSITE REPAIR MARKET: DRIVERS, RESTRAINTS, OPPORTUNITIES, AND CHALLENGES
- 5.2.1 DRIVERS
- 5.2.1.1 Increased investments in rehabilitation of old structures
- 5.2.1.2 Cost savings associated with composite structure repair
- 5.2.2 RESTRAINTS
- 5.2.2.1 Low penetration of composites in underdeveloped economies
- 5.2.2.2 Introduction of self-healing composites
- 5.2.3 OPPORTUNITIES
- 5.2.3.1 Growing use of composites in end use industries
- 5.2.3.2 Introduction of new and advanced technologies
- 5.2.3.3 Automation of composite repair
- 5.2.4 CHALLENGES
- 5.2.4.1 Skilled labor shortage
- 5.2.4.2 Lack of standardization of material and testing
- 5.2.4.3 Financial losses incurred during composite repair
- 5.3 PORTER'S FIVE FORCES ANALYSIS
- FIGURE 19 COMPOSITE REPAIR MARKET: PORTER'S FIVE FORCES ANALYSIS
- 5.3.1 BARGAINING POWER OF SUPPLIERS
- 5.3.2 BARGAINING POWER OF BUYERS
- 5.3.3 THREAT OF SUBSTITUTES
- 5.3.4 THREAT OF NEW ENTRANTS
- 5.3.5 INTENSITY OF COMPETITIVE RIVALRY
- TABLE 1 COMPOSITE REPAIR MARKET: PORTER'S FIVE FORCES ANALYSIS
- 5.4 TECHNOLOGY ANALYSIS
- 5.5 ECOSYSTEM MAPPING
- 5.6 VALUE CHAIN ANALYSIS
- FIGURE 20 COMPOSITE REPAIR MARKET: VALUE CHAIN ANALYSIS
- 5.6.1 RAW MATERIAL AND LABOR
- 5.6.2 REPAIR SERVICE PROVIDERS
- 5.6.3 END USE INDUSTRIES
- 5.7 SUPPLY CHAIN ANALYSIS
- TABLE 2 COMPOSITE REPAIR MARKET: SUPPLY CHAIN
- 5.8 COMPOSITE REPAIR MARKET: OPTIMISTIC, PESSIMISTIC, AND REALISTIC SCENARIOS
- TABLE 3 COMPOSITE REPAIR MARKET: CAGR (BY VALUE) IN OPTIMISTIC, PESSIMISTIC, AND REALISTIC SCENARIOS
- 5.8.1 OPTIMISTIC SCENARIO
- 5.8.2 PESSIMISTIC SCENARIO
- 5.8.3 REALISTIC SCENARIO
- 5.9 PATENT ANALYSIS
- 5.9.1 INTRODUCTION
- 5.9.2 METHODOLOGY
- 5.9.3 DOCUMENT TYPE
- FIGURE 21 GLOBAL PATENT ANALYSIS, BY DOCUMENT TYPE, 2011-2021
- FIGURE 22 PUBLICATION TRENDS, 2012-2022
- 5.9.4 INSIGHTS
- 5.9.5 LEGAL STATUS
- FIGURE 23 LEGAL STATUS
- 5.9.6 JURISDICTION ANALYSIS
- FIGURE 24 PATENT JURISDICTION ANALYSIS, 2020
- 5.9.7 TOP PATENT APPLICANTS
- FIGURE 25 TOP PATENT APPLICANTS
- 5.9.8 PATENTS BY BOEING CO.
- 5.9.9 PATENTS BY UNIVERSITY OF SICHUAN
- 5.9.10 TOP TEN PATENT OWNERS (US) IN LAST 10 YEARS
- 5.10 CASE STUDY ANALYSIS
- 5.11 TRENDS AND DISRUPTIONS IMPACTING CUSTOMER BUSINESS
6 COMPOSITE REPAIR MARKET, BY TYPE
- 6.1 INTRODUCTION
- FIGURE 26 STRUCTURAL SEGMENT ACCOUNTED FOR MAJOR SHARE OF COMPOSITE REPAIR MARKET IN 2022 (USD MILLION)
- TABLE 4 COMPOSITE REPAIR MARKET, BY TYPE, 2020-2022 (USD MILLION)
- TABLE 5 COMPOSITE REPAIR MARKET, BY TYPE, 2023-2028 (USD MILLION)
- 6.1.1 STRUCTURAL
- 6.1.1.1 Improving aerospace industry to drive market
- FIGURE 27 ASIA PACIFIC TO ACCOUNT FOR LARGEST SHARE IN STRUCTURAL COMPOSITE REPAIR MARKET
- TABLE 6 STRUCTURAL COMPOSITE REPAIR MARKET, BY REGION, 2020-2022 (USD MILLION)
- TABLE 7 STRUCTURAL COMPOSITE REPAIR MARKET, BY REGION, 2023-2028 (USD MILLION)
- 6.1.2 SEMI-STRUCTURAL
- 6.1.2.1 Demand from wind energy to increase usage
- FIGURE 28 ASIA PACIFIC TO LEAD SEMI-STRUCTURAL COMPOSITE REPAIR MARKET BY 2028
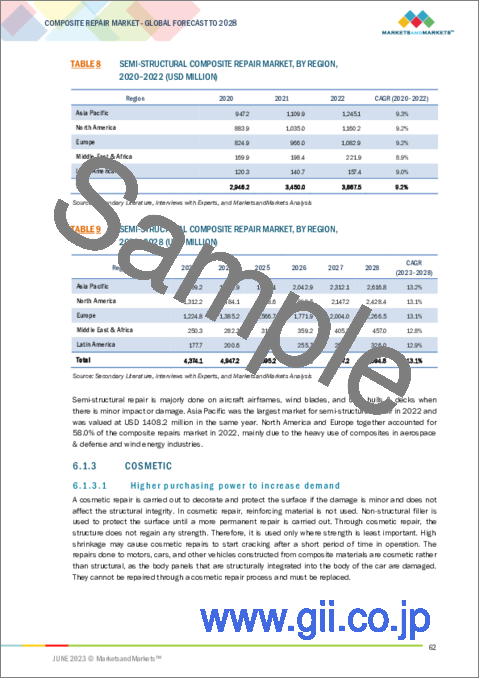
- TABLE 8 SEMI-STRUCTURAL COMPOSITE REPAIR MARKET, BY REGION, 2020-2022 (USD MILLION)
- TABLE 9 SEMI-STRUCTURAL COMPOSITE REPAIR MARKET, BY REGION, 2023-2028 (USD MILLION)
- 6.1.3 COSMETIC
- 6.1.3.1 Higher purchasing power to increase demand
- FIGURE 29 ASIA PACIFIC TO BE LARGEST MARKET IN COSMETIC COMPOSITE REPAIR MARKET
- TABLE 10 COSMETIC COMPOSITE REPAIR MARKET, BY REGION, 2020-2022 (USD MILLION)
- TABLE 11 COSMETIC COMPOSITE REPAIR MARKET, BY REGION, 2023-2028 (USD MILLION)
7 COMPOSITE REPAIR MARKET, BY PROCESS
- 7.1 INTRODUCTION
- FIGURE 30 HAND LAY-UP PROCESS SEGMENT DOMINATED COMPOSITE REPAIR MARKET IN 2022 (USD MILLION)
- TABLE 12 COMPOSITE REPAIR MARKET, BY PROCESS, 2020-2022 (USD MILLION)
- TABLE 13 COMPOSITE REPAIR MARKET, BY PROCESS, 2023-2028 (USD MILLION)
- 7.1.1 HAND LAY-UP
- 7.1.1.1 Convenience of usage in wide variety of applications to drive market
- FIGURE 31 ASIA PACIFIC TO HAVE LARGEST MARKET SHARE IN HAND LAY-UP PROCESS SEGMENT DURING FORECAST PERIOD
- TABLE 14 HAND LAY-UP COMPOSITE REPAIR MARKET, BY REGION, 2020-2022 (USD MILLION)
- TABLE 15 HAND LAY-UP COMPOSITE REPAIR MARKET, BY REGION, 2023-2028 (USD MILLION)
- 7.1.2 VACUUM INFUSION
- 7.1.2.1 Complex and airtight structure repairs in aerospace & defense industry to drive demand
- FIGURE 32 ASIA PACIFIC TO LEAD VACUUM INFUSION PROCESS SEGMENT IN COMPOSITE REPAIR MARKET BY 2028
- TABLE 16 VACUUM INFUSION COMPOSITE REPAIR MARKET, BY REGION, 2020-2022 (USD MILLION)
- TABLE 17 VACUUM INFUSION COMPOSITE REPAIR MARKET, BY REGION, 2023-2028 (USD MILLION)
- 7.1.3 AUTOCLAVE
- 7.1.3.1 Increased usage of composites in high-performance industries to drive market
- FIGURE 33 ASIA PACIFIC TO ACCOUNT FOR HIGHEST MARKET SHARE IN AUTOCLAVE PROCESS SEGMENT BETWEEN 2023 AND 2028
- TABLE 18 AUTOCLAVE COMPOSITE REPAIR MARKET, BY REGION, 2020-2022 (USD MILLION)
- TABLE 19 AUTOCLAVE COMPOSITE REPAIR MARKET, BY REGION, 2023-2028 (USD MILLION)
- 7.1.4 OTHER PROCESSES
- 7.1.4.1 Usage of composites in newer applications to drive segment
- 7.1.4.2 Composite wrap
- 7.1.4.3 Out-of-autoclave
- 7.1.4.4 Prepreg molding
- FIGURE 34 ASIA PACIFIC TO LEAD OTHER PROCESSES SEGMENT OF COMPOSITE REPAIR MARKET BETWEEN 2023 AND 2028
- TABLE 20 OTHER PROCESSES COMPOSITE REPAIR MARKET, BY REGION, 2020-2022 (USD MILLION)
- TABLE 21 OTHER PROCESSES COMPOSITE REPAIR MARKET, BY REGION, 2023-2028 (USD MILLION)
8 COMPOSITE REPAIR MARKET, BY END USE INDUSTRY
- 8.1 INTRODUCTION
- FIGURE 35 AEROSPACE & DEFENSE SEGMENT ACCOUNTED FOR LARGEST END USE SEGMENT IN GLOBAL COMPOSITE REPAIR MARKET IN 2022
- TABLE 22 COMPOSITE REPAIR MARKET, BY END USE INDUSTRY, 2020-2022 (USD MILLION)
- TABLE 23 COMPOSITE REPAIR MARKET, BY END USE INDUSTRY, 2023-2028 (USD MILLION)
- 8.1.1 AEROSPACE & DEFENSE
- 8.1.1.1 Aircraft fuel efficiency to drive segment
- FIGURE 36 ASIA PACIFIC TO GROW FASTER IN AEROSPACE & DEFENSE INDUSTRY BETWEEN 2023 AND 2028
- TABLE 24 COMPOSITE REPAIR MARKET IN AEROSPACE & DEFENSE, BY REGION, 2020-2022 (USD MILLION)
- TABLE 25 COMPOSITE REPAIR MARKET IN AEROSPACE & DEFENSE, BY REGION, 2023-2028 (USD MILLION)
- 8.1.1.2 Commercial aircraft
- 8.1.1.3 Business and general aviation aircraft
- 8.1.1.4 Civil helicopter
- 8.1.1.5 Military aircraft
- 8.1.2 WIND ENERGY
- 8.1.2.1 Need for clean energy generation and increased installation of wind turbines to boost segment
- FIGURE 37 ASIA PACIFIC TO REMAIN LARGEST MARKET FOR COMPOSITE REPAIRS IN WIND ENERGY INDUSTRY BETWEEN 2023 AND 2028
- TABLE 26 COMPOSITE REPAIR MARKET IN WIND ENERGY, BY REGION, 2020-2022 (USD MILLION)
- TABLE 27 COMPOSITE REPAIR MARKET IN WIND ENERGY, BY REGION, 2023-2028 (USD MILLION)
- 8.1.2.2 Wind turbine blade
- 8.1.3 AUTOMOTIVE & TRANSPORTATION
- 8.1.3.1 Increasing competition and consumer demand for cosmetic changes to drive market
- FIGURE 38 NORTH AMERICA TO LEAD COMPOSITE REPAIR MARKET DURING FORECAST PERIOD
- TABLE 28 COMPOSITE REPAIR MARKET IN AUTOMOTIVE & TRANSPORTATION, BY REGION, 2020-2022 (USD MILLION)
- TABLE 29 COMPOSITE REPAIR MARKET IN AUTOMOTIVE & TRANSPORTATION, BY REGION, 2023-2028 (USD MILLION)
- 8.1.3.2 Automobile
- 8.1.3.3 Rail
- 8.1.4 MARINE
- 8.1.4.1 Need for easily repairable parts to withstand marine environment to accelerate demand
- FIGURE 39 ASIA PACIFIC TO POSSESS HIGHEST MARKET SHARE IN MARINE INDUSTRY BETWEEN 2023 AND 2028
- TABLE 30 COMPOSITE REPAIR MARKET IN MARINE, BY REGION, 2020-2022 (USD MILLION)
- TABLE 31 COMPOSITE REPAIR MARKET IN MARINE, BY REGION, 2023-2028 (USD MILLION)
- 8.1.4.2 Powerboat
- 8.1.4.3 Sailboat
- 8.1.4.4 Cruise ship
- 8.1.5 CONSTRUCTION
- 8.1.5.1 Increased usage for cost-saving efficient construction products to improve demand
- FIGURE 40 NORTH AMERICA TO REMAIN LARGEST MARKET FOR COMPOSITE REPAIR IN CONSTRUCTION INDUSTRY
- TABLE 32 COMPOSITE REPAIR MARKET IN CONSTRUCTION, BY REGION, 2020-2022 (USD MILLION)
- TABLE 33 COMPOSITE REPAIR MARKET IN CONSTRUCTION, BY REGION, 2023-2028 (USD MILLION)
- 8.1.5.2 Civil construction
- 8.1.5.3 Residential and commercial building
- 8.1.6 PIPES AND TANKS
- 8.1.6.1 Demand from various end use industries to drive market
- FIGURE 41 ASIA PACIFIC TO HAVE HIGHEST CAGR OF COMPOSITE REPAIR MARKET IN PIPES AND TANKS INDUSTRY DURING FORECAST PERIOD
- TABLE 34 COMPOSITE REPAIR MARKET IN PIPES AND TANKS, BY REGION, 2020-2022 (USD MILLION)
- TABLE 35 COMPOSITE REPAIR MARKET IN PIPES AND TANKS, BY REGION, 2023-2028 (USD MILLION)
- 8.1.6.2 Oil & gas
- 8.1.6.3 Sewage
- 8.1.6.4 Chemical
- 8.1.6.5 Irrigation
- 8.1.7 OTHER END USE INDUSTRIES
- 8.1.7.1 Increasing consumption of composites in various applications to drive market
- 8.1.7.2 Sporting goods
- 8.1.7.3 Medical
- 8.1.7.4 Electrical and electronics
- FIGURE 42 ASIA PACIFIC TO ACCOUNT FOR LARGEST MARKET SHARE FOR OTHER END USE INDUSTRES DURING FORECAST PERIOD
- TABLE 36 COMPOSITE REPAIR MARKET IN OTHER END USE INDUSTRIES, BY REGION, 2020-2022 (USD MILLION)
- TABLE 37 COMPOSITE REPAIR MARKET IN OTHER END USE INDUSTRIES, BY REGION, 2023-2028 (USD MILLION)
9 COMPOSITE REPAIR MARKET, BY REGION
- 9.1 INTRODUCTION
- FIGURE 43 CHINA TO DRIVE COMPOSITE REPAIR MARKET WITH HIGHEST CAGR BETWEEN 2023 AND 2028
- TABLE 38 COMPOSITE REPAIR MARKET, BY REGION, 2020-2022 (USD MILLION)
- TABLE 39 COMPOSITE REPAIR MARKET, BY REGION, 2023-2028 (USD MILLION)
- 9.2 NORTH AMERICA
- FIGURE 44 NORTH AMERICA: COMPOSITE REPAIR MARKET SNAPSHOT
- 9.2.1 NORTH AMERICA: COMPOSITE REPAIR MARKET, BY TYPE
- TABLE 40 NORTH AMERICA: COMPOSITE REPAIR MARKET, BY TYPE, 2020-2022 (USD MILLION)
- TABLE 41 NORTH AMERICA: COMPOSITE REPAIR MARKET, BY TYPE, 2023-2028 (USD MILLION)
- 9.2.2 NORTH AMERICA: COMPOSITE REPAIR MARKET, BY PROCESS
- TABLE 42 NORTH AMERICA: COMPOSITE REPAIR MARKET, BY PROCESS, 2020-2022 (USD MILLION)
- TABLE 43 NORTH AMERICA: COMPOSITE REPAIR MARKET, BY PROCESS, 2023-2028 (USD MILLION)
- 9.2.3 NORTH AMERICA: COMPOSITE REPAIR MARKET, BY END USE INDUSTRY
- TABLE 44 NORTH AMERICA: COMPOSITE REPAIR MARKET, BY END USE INDUSTRY, 2020-2022 (USD MILLION)
- TABLE 45 NORTH AMERICA: COMPOSITE REPAIR MARKET, BY END USE INDUSTRY, 2023-2028 (USD MILLION)
- 9.2.4 NORTH AMERICA: COMPOSITE REPAIR MARKET, BY COUNTRY
- TABLE 46 NORTH AMERICA: COMPOSITE REPAIR MARKET, BY COUNTRY, 2020-2022 (USD MILLION)
- TABLE 47 NORTH AMERICA: COMPOSITE REPAIR MARKET, BY COUNTRY, 2023-2028 (USD MILLION)
- 9.2.4.1 US
- 9.2.4.1.1 Increased demand from aerospace and automobile industries to boost market
- 9.2.4.1 US
- TABLE 48 US: COMPOSITE REPAIR MARKET, BY PROCESS, 2020-2022 (USD MILLION)
- TABLE 49 US: COMPOSITE REPAIR MARKET, BY PROCESS, 2023-2028 (USD MILLION)
- 9.2.4.2 Canada
- 9.2.4.2.1 Improving aerospace industry to drive market
- 9.2.4.2 Canada
- TABLE 50 CANADA: COMPOSITE REPAIR MARKET, BY PROCESS, 2020-2022 (USD MILLION)
- TABLE 51 CANADA: COMPOSITE REPAIR MARKET, BY PROCESS, 2023-2028 (USD MILLION)
- 9.3 EUROPE
- FIGURE 45 EUROPE: COMPOSITE REPAIR MARKET SNAPSHOT
- 9.3.1 EUROPE: COMPOSITE REPAIR MARKET, BY TYPE
- TABLE 52 EUROPE: COMPOSITE REPAIR MARKET, BY TYPE, 2020-2022 (USD MILLION)
- TABLE 53 EUROPE: COMPOSITE REPAIR MARKET, BY TYPE, 2023-2028 (USD MILLION)
- 9.3.2 EUROPE: COMPOSITE REPAIR MARKET, BY PROCESS
- TABLE 54 EUROPE: COMPOSITE REPAIR MARKET, BY PROCESS, 2020-2022 (USD MILLION)
- TABLE 55 EUROPE: COMPOSITE REPAIR MARKET, BY PROCESS, 2023-2028 (USD MILLION)
- 9.3.3 EUROPE: COMPOSITE REPAIR MARKET, BY END USE INDUSTRY
- TABLE 56 EUROPE: COMPOSITE REPAIR MARKET, BY END USE INDUSTRY, 2020-2022 (USD MILLION)
- TABLE 57 EUROPE: COMPOSITE REPAIR MARKET, BY END USE INDUSTRY, 2023-2028 (USD MILLION)
- 9.3.4 EUROPE: COMPOSITE REPAIR MARKET, BY COUNTRY
- TABLE 58 EUROPE: COMPOSITE REPAIR MARKET, BY COUNTRY, 2020-2022 (USD MILLION)
- TABLE 59 EUROPE: COMPOSITE REPAIR MARKET, BY COUNTRY, 2023-2028 (USD MILLION)
- 9.3.4.1 Germany
- 9.3.4.1.1 Increasing wind energy demand to fuel market
- 9.3.4.1 Germany
- TABLE 60 GERMANY: COMPOSITE REPAIR MARKET, BY PROCESS, 2020-2022 (USD MILLION)
- TABLE 61 GERMANY: COMPOSITE REPAIR MARKET, BY PROCESS, 2023-2028 (USD MILLION)
- 9.3.4.2 France
- 9.3.4.2.1 Demand from aerospace sector to drive market growth
- 9.3.4.2 France
- TABLE 62 FRANCE: COMPOSITE REPAIR MARKET, BY PROCESS, 2020-2022 (USD MILLION)
- TABLE 63 FRANCE: COMPOSITE REPAIR MARKET, BY PROCESS, 2023-2028 (USD MILLION)
- 9.3.4.3 UK
- 9.3.4.3.1 Increasing demand from automotive and aerospace sectors to drive market
- 9.3.4.3 UK
- TABLE 64 UK: COMPOSITE REPAIR MARKET, BY PROCESS, 2020-2022 (USD MILLION)
- TABLE 65 UK: COMPOSITE REPAIR MARKET, BY PROCESS, 2023-2028 (USD MILLION)
- 9.3.4.4 Spain
- 9.3.4.4.1 Incentives from government in wind energy sector to boost market
- 9.3.4.4 Spain
- TABLE 66 SPAIN: COMPOSITE REPAIR MARKET, BY PROCESS, 2020-2022 (USD MILLION)
- TABLE 67 SPAIN: COMPOSITE REPAIR MARKET, BY PROCESS, 2023-2028 (USD MILLION)
- 9.3.4.5 Rest of Europe
- TABLE 68 REST OF EUROPE: COMPOSITE REPAIR MARKET, BY PROCESS, 2020-2022 (USD MILLION)
- TABLE 69 REST OF EUROPE: COMPOSITE REPAIR MARKET, BY PROCESS, 2023-2028 (USD MILLION)
- 9.4 ASIA PACIFIC
- FIGURE 46 ASIA PACIFIC: COMPOSITE REPAIR MARKET SNAPSHOT
- 9.4.1 ASIA PACIFIC: COMPOSITE REPAIR MARKET, BY TYPE
- TABLE 70 ASIA PACIFIC: COMPOSITE REPAIR MARKET, BY TYPE, 2020-2022 (USD MILLION)
- TABLE 71 ASIA PACIFIC: COMPOSITE REPAIR MARKET, BY TYPE, 2023-2028 (USD MILLION)
- 9.4.2 ASIA PACIFIC: COMPOSITE REPAIR MARKET, BY PROCESS
- TABLE 72 ASIA PACIFIC: COMPOSITE REPAIR MARKET, BY PROCESS, 2020-2022 (USD MILLION)
- TABLE 73 ASIA PACIFIC: COMPOSITE REPAIR MARKET, BY PROCESS, 2023-2028 (USD MILLION)
- 9.4.3 ASIA PACIFIC: COMPOSITE REPAIR MARKET, BY END USE INDUSTRY
- TABLE 74 ASIA PACIFIC: COMPOSITE REPAIR MARKET, BY END USE INDUSTRY, 2020-2022 (USD MILLION)
- TABLE 75 ASIA PACIFIC: COMPOSITE REPAIR MARKET, BY END USE INDUSTRY, 2023-2028 (USD MILLION)
- 9.4.4 ASIA PACIFIC: COMPOSITE REPAIR MARKET, BY COUNTRY
- TABLE 76 ASIA PACIFIC: COMPOSITE REPAIR MARKET, BY COUNTRY, 2020-2022 (USD MILLION)
- TABLE 77 ASIA PACIFIC: COMPOSITE REPAIRS MARKET, BY COUNTRY, 2023-2028 (USD MILLION)
- 9.4.4.1 China
- 9.4.4.1.1 Demand from aerospace and automobile industries to boost market
- 9.4.4.1 China
- TABLE 78 CHINA: COMPOSITE REPAIR MARKET, BY PROCESS, 2020-2022 (USD MILLION)
- TABLE 79 CHINA: COMPOSITE REPAIR MARKET, BY PROCESS, 2023-2028 (USD MILLION)
- 9.4.4.2 India
- 9.4.4.2.1 Improving business conditions across sectors to drive market
- 9.4.4.2 India
- TABLE 80 INDIA: COMPOSITE REPAIR MARKET, BY PROCESS, 2020-2022 (USD MILLION)
- TABLE 81 INDIA: COMPOSITE REPAIR MARKET, BY PROCESS, 2023-2028 (USD MILLION)
- 9.4.4.3 Australia and New Zealand
- 9.4.4.3.1 Wind energy installation to improve market growth
- 9.4.4.3 Australia and New Zealand
- TABLE 82 AUSTRALIA AND NEW ZEALAND: COMPOSITE REPAIR MARKET, BY PROCESS, 2020-2022 (USD MILLION)
- TABLE 83 AUSTRALIA AND NEW ZEALAND: COMPOSITE REPAIR MARKET, BY PROCESS, 2023-2028 (USD MILLION)
- 9.4.4.4 Japan
- 9.4.4.4.1 Demand from automotive and marine industries to boost market
- 9.4.4.4 Japan
- TABLE 84 JAPAN: COMPOSITE REPAIR MARKET, BY PROCESS, 2020-2022 (USD MILLION)
- TABLE 85 JAPAN: COMPOSITE REPAIR MARKET, BY PROCESS, 2023-2028 (USD MILLION)
- 9.4.4.5 South Korea
- 9.4.4.5.1 Increased use of structural composite in end use applications to boost market
- 9.4.4.5 South Korea
- TABLE 86 SOUTH KOREA: COMPOSITE REPAIR MARKET, BY PROCESS, 2020-2022 (USD MILLION)
- TABLE 87 SOUTH KOREA: COMPOSITE REPAIR MARKET, BY PROCESS, 2023-2028 (USD MILLION)
- 9.4.4.6 Taiwan
- 9.4.4.6.1 Demand from electronics industry to improve market growth
- 9.4.4.6 Taiwan
- TABLE 88 TAIWAN: COMPOSITE REPAIR MARKET, BY PROCESS, 2020-2022 (USD MILLION)
- TABLE 89 TAIWAN: COMPOSITE REPAIR MARKET, BY PROCESS, 2023-2028 (USD MILLION)
- 9.4.4.7 Thailand
- 9.4.4.7.1 Improving market conditions to boost market
- 9.4.4.7 Thailand
- TABLE 90 THAILAND: COMPOSITE REPAIR MARKET, BY PROCESS, 2020-2022 (USD MILLION)
- TABLE 91 THAILAND: COMPOSITE REPAIR MARKET, BY PROCESS, 2023-2028 (USD MILLION)
- 9.4.4.8 Rest of Asia Pacific
- TABLE 92 REST OF ASIA PACIFIC: COMPOSITE REPAIR MARKET, BY PROCESS, 2020-2022 (USD MILLION)
- TABLE 93 REST OF ASIA PACIFIC: COMPOSITE REPAIR MARKET, BY PROCESS, 2023-2028 (USD MILLION)
- 9.5 MIDDLE EAST & AFRICA
- 9.5.1 MIDDLE EAST & AFRICA: COMPOSITE REPAIR MARKET, BY TYPE
- TABLE 94 MIDDLE EAST & AFRICA: COMPOSITE REPAIR MARKET, BY TYPE, 2020-2022 (USD MILLION)
- TABLE 95 MIDDLE EAST & AFRICA: COMPOSITE REPAIR MARKET, BY TYPE, 2023-2028 (USD MILLION)
- 9.5.2 MIDDLE EAST & AFRICA: COMPOSITE REPAIR MARKET, BY PROCESS
- TABLE 96 MIDDLE EAST & AFRICA: COMPOSITE REPAIR MARKET, BY PROCESS, 2020-2022 (USD MILLION)
- TABLE 97 MIDDLE EAST & AFRICA: COMPOSITE REPAIR MARKET, BY PROCESS, 2023-2028 (USD MILLION)
- 9.5.3 MIDDLE EAST & AFRICA: COMPOSITE REPAIR MARKET, BY END USE INDUSTRY
- TABLE 98 MIDDLE EAST & AFRICA: COMPOSITE REPAIR MARKET, BY END USE INDUSTRY, 2020-2022 (USD MILLION)
- TABLE 99 MIDDLE EAST & AFRICA: COMPOSITE REPAIRS MARKET, BY END USE INDUSTRY, 2023-2028 (USD MILLION)
- 9.5.4 MIDDLE EAST & AFRICA: COMPOSITE REPAIR MARKET, BY COUNTRY
- TABLE 100 MIDDLE EAST & AFRICA: COMPOSITE REPAIR MARKET, BY COUNTRY, 2020-2022 (USD MILLION)
- TABLE 101 MIDDLE EAST & AFRICA: COMPOSITE REPAIRS MARKET, BY COUNTRY, 2023-2028 (USD MILLION)
- 9.5.4.1 UAE
- 9.5.4.1.1 Increasing demand from automotive and construction industries to boost market
- 9.5.4.1 UAE
- TABLE 102 UAE: COMPOSITE REPAIR MARKET, BY PROCESS, 2020-2022 (USD MILLION)
- TABLE 103 UAE: COMPOSITE REPAIR MARKET, BY PROCESS, 2023-2028 (USD MILLION)
- 9.5.4.2 Saudi Arabia
- 9.5.4.2.1 Demand from automotive and pipes and tanks industries to fuel market
- 9.5.4.2 Saudi Arabia
- TABLE 104 SAUDI ARABIA: COMPOSITE REPAIR MARKET, BY PROCESS, 2020-2022 (USD MILLION)
- TABLE 105 SAUDI ARABIA: COMPOSITE REPAIR MARKET, BY PROCESS, 2023-2028 (USD MILLION)
- 9.5.4.3 South Africa
- 9.5.4.3.1 Improving market conditions and investments in several sectors to boost market
- 9.5.4.3 South Africa
- TABLE 106 SOUTH AFRICA: COMPOSITE REPAIR MARKET, BY PROCESS, 2020-2022 (USD MILLION)
- TABLE 107 SOUTH AFRICA: COMPOSITE REPAIR MARKET, BY PROCESS, 2023-2028 (USD MILLION)
- 9.5.4.4 Rest of Middle East & Africa
- TABLE 108 REST OF MIDDLE EAST & AFRICA: COMPOSITE REPAIR MARKET, BY PROCESS, 2020-2022 (USD MILLION)
- TABLE 109 REST OF MIDDLE EAST & AFRICA: COMPOSITE REPAIR MARKET, BY PROCESS, 2023-2028 (USD MILLION)
- 9.6 LATIN AMERICA
- 9.6.1 LATIN AMERICA: COMPOSITE REPAIR MARKET, BY TYPE
- TABLE 110 LATIN AMERICA: COMPOSITE REPAIR MARKET, BY TYPE, 2020-2022 (USD MILLION)
- TABLE 111 LATIN AMERICA: COMPOSITE REPAIR MARKET, BY TYPE, 2023-2028 (USD MILLION)
- 9.6.2 LATIN AMERICA: COMPOSITE REPAIR MARKET, BY PROCESS
- TABLE 112 LATIN AMERICA: COMPOSITE REPAIR MARKET, BY PROCESS, 2020-2022 (USD MILLION)
- TABLE 113 LATIN AMERICA: COMPOSITE REPAIR MARKET, BY PROCESS, 2023-2028 (USD MILLION)
- 9.6.3 LATIN AMERICA: COMPOSITE REPAIR MARKET, BY END USE INDUSTRY
- TABLE 114 LATIN AMERICA: COMPOSITE REPAIR MARKET, BY END USE INDUSTRY, 2020-2022 (USD MILLION)
- TABLE 115 LATIN AMERICA: COMPOSITE REPAIR MARKET, BY END USE INDUSTRY, 2023-2028 (USD MILLION)
- 9.6.4 LATIN AMERICA: COMPOSITE REPAIR MARKET, BY COUNTRY
- TABLE 116 LATIN AMERICA: COMPOSITE REPAIR MARKET, BY COUNTRY, 2020-2022 (USD MILLION)
- TABLE 117 LATIN AMERICA: COMPOSITE REPAIRS MARKET, BY COUNTRY, 2023-2028 (USD MILLION)
- 9.6.4.1 Brazil
- 9.6.4.1.1 Demand from wind energy industry to boost market
- 9.6.4.1 Brazil
- TABLE 118 BRAZIL: COMPOSITE REPAIR MARKET, BY PROCESS, 2020-2022 (USD MILLION)
- TABLE 119 BRAZIL: COMPOSITE REPAIR MARKET, BY PROCESS, 2023-2028 (USD MILLION)
- 9.6.4.2 Mexico
- 9.6.4.2.1 Improving market conditions in wind energy and aerospace industries to drive market
- 9.6.4.2 Mexico
- TABLE 120 MEXICO: COMPOSITE REPAIR MARKET, BY PROCESS, 2020-2022 (USD MILLION)
- TABLE 121 MEXICO: COMPOSITE REPAIR MARKET, BY PROCESS, 2023-2028 (USD MILLION)
- 9.6.4.3 Rest of Latin America
- TABLE 122 REST OF LATIN AMERICA: COMPOSITE REPAIR MARKET, BY PROCESS, 2020-2022 (USD MILLION)
- TABLE 123 REST OF LATIN AMERICA: COMPOSITE REPAIR MARKET, BY PROCESS, 2023-2028 (USD MILLION)
10 COMPETITIVE LANDSCAPE
- 10.1 INTRODUCTION
- 10.2 MARKET SHARE ANALYSIS, 2022
- FIGURE 47 MARKET SHARE OF TOP COMPANIES IN COMPOSITE REPAIR MARKET
- 10.3 MARKET RANKING ANALYSIS
- FIGURE 48 COMPOSITE REPAIR MARKET: COMPANY RANKING, 2022
- 10.4 REVENUE ANALYSIS OF TOP THREE MARKET PLAYERS
- FIGURE 49 COMPOSITE REPAIR MARKET: REVENUE ANALYSIS OF TOP THREE PLAYERS, 2020-2022
- 10.5 COMPANY EVALUATION MATRIX
- 10.5.1 STARS
- 10.5.2 EMERGING LEADERS
- 10.5.3 PERVASIVE PLAYERS
- 10.5.4 PARTICIPANTS
- FIGURE 50 COMPOSITE REPAIR MARKET: COMPANY EVALUATION MATRIX, 2022
- TABLE 124 COMPOSITE REPAIR MARKET: PRODUCT FOOTPRINT, 2022
- TABLE 125 COMPOSITE REPAIR MARKET: END USE INDUSTRY FOOTPRINT, 2022
- TABLE 126 COMPOSITE REPAIR MARKET: REGIONAL FOOTPRINT, 2022
- 10.6 STARTUP/SME EVALUATION MATRIX
- 10.6.1 PROGRESSIVE COMPANIES
- 10.6.2 RESPONSIVE COMPANIES
- 10.6.3 DYNAMIC COMPANIES
- 10.6.4 STARTING BLOCKS
- FIGURE 51 COMPOSITE REPAIR MARKET: STARTUP/SME EVALUATION MATRIX, 2022
- 10.7 MARKET EVALUATION FRAMEWORK
- TABLE 127 COMPOSITE REPAIR MARKET: DEALS, 2018-2023
- TABLE 128 COMPOSITE REPAIR MARKET: PRODUCT DEVELOPMENT, 2018-2022
11 COMPANY PROFILES
- (Business Overview, Products offered, Recent Developments, Deals, MnM view, Right to win, Strategic choices, Weakness and competitive threats)**
- 11.1 KEY COMPANIES
- 11.1.1 LUFTHANSA TECHNIK AG
- TABLE 129 LUFTHANSA TECHNIK AG: COMPANY OVERVIEW
- FIGURE 52 LUFTHANSA TECHNIK AG: COMPANY SNAPSHOT
- 11.1.2 AIR FRANCE-KLM E&M
- TABLE 130 AIR FRANCE-KLM E&M: COMPANY OVERVIEW
- FIGURE 53 AIR FRANCE-KLM E&M: COMPANY SNAPSHOT
- TABLE 131 AIR FRANCE-KLM E&M: DEALS
- 11.1.3 HAECO
- TABLE 132 HAECO: COMPANY OVERVIEW
- FIGURE 54 HAECO: COMPANY SNAPSHOT
- 11.1.4 UPWIND SOLUTIONS, INC.
- TABLE 133 UPWIND SOLUTIONS, INC.: COMPANY OVERVIEW
- TABLE 134 UPWIND SOLUTIONS, INC.: DEALS
- 11.1.5 TOTAL WIND GROUP
- TABLE 135 TOTAL WIND GROUP: COMPANY OVERVIEW
- TABLE 136 TOTAL WIND GROUP: PRODUCT LAUNCHES
- TABLE 137 TOTAL WIND GROUP: DEALS
- 11.1.6 TECHNICAL WIND SERVICES
- TABLE 138 TECHNICAL WIND SERVICES: COMPANY OVERVIEW
- TABLE 139 TECHNICAL WIND SERVICES: DEALS
- 11.1.7 CITADEL TECHNOLOGIES
- TABLE 140 CITADEL TECHNOLOGIES: COMPANY OVERVIEW
- 11.1.8 MILLIKEN INFRASTRUCTURE
- TABLE 141 MILLIKEN INFRASTRUCTURE: COMPANY OVERVIEW
- 11.1.9 T.D. WILLIAMSON
- TABLE 142 T.D. WILLIAMSON: COMPANY OVERVIEW
- 11.1.10 WEST SYSTEM
- TABLE 143 WEST SYSTEM: COMPANY OVERVIEW
- 11.1.11 WR COMPOSITE
- TABLE 144 WR COMPOSITE: COMPANY OVERVIEW
- 11.1.12 CONCRETE REPAIRS LTD.
- TABLE 145 CONCRETE REPAIRS LTD.: COMPANY OVERVIEW
- 11.1.13 WALKER TECHNICAL RESOURCES LTD.
- TABLE 146 WALKER TECHNICAL RESOURCES LTD.: COMPANY OVERVIEW
- *Details on Business Overview, Products offered, Recent Developments, Deals, MnM view, Right to win, Strategic choices, Weakness and competitive threats might not be captured in case of unlisted companies.
- 11.2 OTHER PLAYERS
- 11.2.1 FURMANITE CORPORATION
- TABLE 147 FURMANITE CORPORATION: COMPANY OVERVIEW
- 11.2.2 COMPOSITE TECHNOLOGIES LTD.
- TABLE 148 COMPOSITE TECHNOLOGIES LTD.: COMPANY OVERVIEW
- 11.2.3 FGS COMPOSITES
- TABLE 149 FGS COMPOSITES: COMPANY OVERVIEW
- 11.2.4 HAMBLE YACHT SERVICES
- TABLE 150 HAMBLE YACHT SERVICES: COMPANY OVERVIEW
- 11.2.5 CRAWFORD COMPOSITES LLC
- TABLE 151 CRAWFORD COMPOSITES LLC: COMPANY OVERVIEW
- 11.2.6 DELFT INFRA COMPOSITES
- TABLE 152 DELFT INFRA COMPOSITES: COMPANY OVERVIEW
12 APPENDIX
- 12.1 DISCUSSION GUIDE
- 12.2 KNOWLEDGESTORE: MARKETSANDMARKETS' SUBSCRIPTION PORTAL
- 12.3 CUSTOMIZATION OPTIONS
- 12.4 RELATED REPORTS
- 12.5 AUTHOR DETAILS