|
|
市場調査レポート
商品コード
1455830
リクローザーの世界市場:フェーズ・制御タイプ・定格電圧・絶縁媒体・地域別 - 予測(~2030年)Recloser Market by Phase (Three-phase, Single-phase, and Triple Single-phase), Control Type (Electronic and Hydraulic), Voltage Rating (Up to 15 kV, 16-27 kV, and 28-38 kV), Insulation Medium (Oil, air, and epoxy) Region - Global Forecast to 2030 |
||||||
|
|||||||
カスタマイズ可能
|
|||||||

| リクローザーの世界市場:フェーズ・制御タイプ・定格電圧・絶縁媒体・地域別 - 予測(~2030年) |
|
出版日: 2024年03月25日
発行: MarketsandMarkets
ページ情報: 英文 279 Pages
納期: 即納可能
|

全表示
- 概要
- 目次
リクローザーの市場規模は、予測期間中に5.0%のCAGRで推移し、2024年の11億米ドルから、2030年には15億米ドルの規模に成長すると予測されています。
グリッドの近代化、信頼性の向上、環境への配慮を必要とするさまざまな要因が重なり、リクローザー市場の将来は可能性に満ちています。世界中の送電網インフラが老朽化しているため、停電を防ぎ、信頼性の高い電力供給を確保するためのアップグレードが必要となっています。リクローザーは、送電網の特定セクションの保護を強化するためのコスト効率の高いソリューションを提供します。故障を自動的に隔離し、停電時間を最小限に抑える機能は、送電網の近代化イニシアチブの目標に完全に合致しています。風力発電所や太陽光発電所などの再生可能エネルギー源の普及が進むにつれて、堅牢なグリッド統合ソリューションが必要とされています。リクローザーは、再生可能エネルギー発電固有の変動性を管理することで、重要な役割を果たします。
| 調査範囲 | |
|---|---|
| 調査対象年 | 2020-2030年 |
| 基準年 | 2024年 |
| 予測期間 | 2024-2030年 |
| 単位 | 金額 (米ドル) |
| セグメント | フェーズ・制御タイプ・定格電圧・絶縁媒体別 |
| 対象地域 | アジア太平洋・北米・欧州・中東&アフリカ・南米 |
定格電圧別では、16~27kVの部門が予測期間中に2番目に急成長する市場です。定格電圧16~27 kVのリクローザーは、特に中電圧配電ネットワーク用に設計されています。この範囲は、中電圧配電システムでもっとも一般的に使用される電圧レベルを効果的にカバーし、ユーティリティ事業者に汎用性の高いソリューションを提供します。
制御タイプ別では、油圧式の部門が予測期間中、第2位に位置付ける見通しです。油圧式リクローザーは、何十年もの間、中電圧配電網における自動故障保護の基幹となってきました。その機能は、作動に油圧を利用する独自の制御機構を中心に展開されています。
当レポートでは、世界のリクローザーの市場を調査し、市場概要、市場影響因子および市場機会の分析、技術・特許の動向、法規制環境、ケーススタディ、市場規模の推移・予測、各種区分・地域別の詳細分析、競合情勢、主要企業のプロファイルなどをまとめています。
目次
第1章 イントロダクション
第2章 調査手法
第3章 エグゼクティブサマリー
第4章 重要考察
第5章 市場概要
- 市場力学
- 促進要因
- 抑制要因
- 機会
- 課題
- 顧客ビジネスに影響を与える動向/ディスラプション
- エコシステム分析
- 投資と資金調達のシナリオ
- サプライチェーン分析
- 技術動向
- 価格分析
- 主な会議とイベント
- 関税と規制状況
- 貿易分析
- 特許分析
- ポーターのファイブフォース分析
- 主なステークホルダーと購入基準
- 購入基準
- ケーススタディ分析
第6章 リクローザー市場:フェーズ別
- 三相
- 単相
- 三重単相
第7章 リクローザー市場:制御タイプ別
- 電子タイプ
- 油圧式
第8章 リクローザー市場:定格電圧別
- 最大15KV
- 16-27KV
- 28-38KV
第9章 リクローザー市場:絶縁媒体別
- オイル
- 空気
- エポキシ
第10章 リクローザー市場:地域別
- アジア太平洋
- 北米
- 欧州
- 中東・アフリカ
- 南米
第11章 競合情勢
- 概要
- 主要企業が採用する主要戦略
- トップ5社の市場シェア分析
- トップ4社の収益分析
- 企業評価マトリックス:主要企業
- 企業概要:主要企業
- 企業評価マトリックス:スタートアップ/中小企業
- 企業価値評価と財務指標
- 競合シナリオと動向
第12章 企業プロファイル
- 主要企業
- ABB
- EATON CORPORATION
- SCHNEIDER ELECTRIC
- SIEMENS
- NOJA POWER SWITCHGEAR PTY LTD
- GENERAL ELECTRIC
- HUBBELL
- S&C ELECTRIC COMPANY
- TAVRIDA ELECTRIC
- ENTEC ELECTRIC & ELECTRONIC
- G&W ELECTRIC
- ARTECHE GROUP
- GHORIT ELECTRICAL CO., LTD.
- ILJIN ELECTRIC
- HUGHES POWER SYSTEM
- WASION HOLDINGS INTERNATIONAL
- その他の企業
- BEIJING SOJO ELECTRIC CO., LTD.
- NIKUM ENERGY CONTROL (INDIA) LTD.
- SHINSUNG INDUSTRIAL ELECTRIC CO., LTD.
- HUAYI ELECTRIC CO., LTD.
- SCHWEITZER ENGINEERING LABORATORIES, INC.
- ACTOM
- GEYA ELECTRICAL EQUIPMENT SUPPLY
- WENZHOU ROCKWILL ELECTRIC CO., LTD.
- EFACEC
- STELMEC
第13章 付録
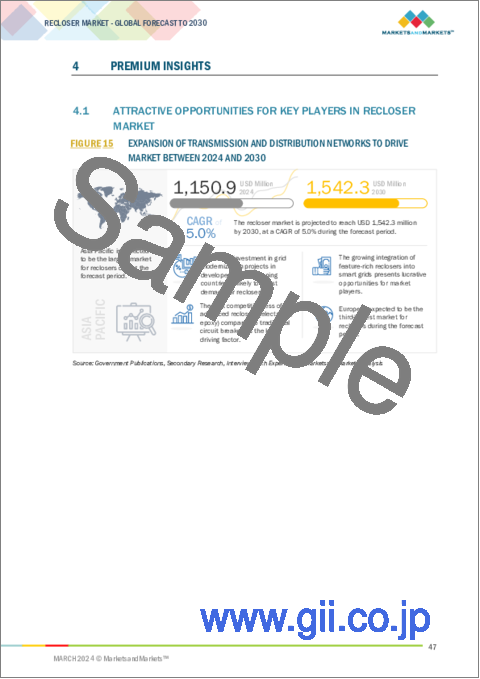
The global recloser market is on a trajectory to reach USD 1.5 billion by 2030, a notable increase from the estimated USD 1.1 billion in 2024, with a steady CAGR of 5.0% spanning the period from 2024 to 2030. The future of the recloser market is brimming with potential, driven by a confluence of factors that necessitate grid modernization, improved reliability, and environmental considerations. Aging grid infrastructure across the globe necessitates upgrades to prevent outages and ensure reliable power delivery. Reclosers offer a cost-effective solution for enhancing protection in specific sections of the grid. Their ability to automatically isolate faults and minimize outage durations aligns perfectly with the goals of grid modernization initiatives. The increasing penetration of renewable energy sources like wind and solar farms requires robust grid integration solutions. Reclosers play a crucial role here by managing the inherent variability of renewable generation. Their ability to handle fault currents associated with these distributed sources and ensure overall grid stability will be increasingly valuable. Environmental concerns regarding the use of mineral oil in traditional oil-insulated reclosers (OIL reclosers) and SF6 gas in some switchgear alternatives are prompting a shift towards more sustainable options. The future of the recloser market is promising. It hinges on the ability of manufacturers to adapt to evolving grid needs, embrace sustainable technologies, and integrate seamlessly with smart grid systems. By focusing on cost-competitiveness, innovation, and data-driven solutions, the recloser market is poised to play a vital role in ensuring a reliable, efficient, and environmentally conscious power grid of the future.
| Scope of the Report | |
|---|---|
| Years Considered for the Study | 2020-2030 |
| Base Year | 2024 |
| Forecast Period | 2024-2030 |
| Units Considered | Value (USD Million/Billion) |
| Segments | By Phase, By Control type, By Voltage Rating, By Insulation Medium |
| Regions covered | Asia Pacific, North America, Europe, Middle East and Africa, and South America |
"16-27 kV segment, by voltage taring, to be second-fastest growing market from 2024 to 2030."
Reclosers serve as the workhorses of medium voltage distribution networks, offering automated fault protection and isolation. While they come in a variety of voltage ratings, a crucial segment lies between 16 kV and 27 kV. Reclosers with a voltage rating of 16-27 kV are specifically designed for medium voltage distribution networks. This range effectively covers the most commonly used voltage levels in medium voltage distribution systems, offering a versatile solution for utilities. These reclosers function as automatic circuit interrupters. They continuously monitor the power line for faults using sensors. Upon detecting a fault, they automatically interrupt the current flow using an arc quenching mechanism (oil, vacuum, etc.). Growing environmental regulations and a focus on sustainability are likely to influence the market share within the 16-27 kV range. Solid dielectric reclosers are expected to see increased adoption due to their eco-friendly nature. dvancements in areas like arc quenching technology for AIR reclosers and cost reduction strategies for solid dielectric reclosers could open doors for wider adoption of these sustainable alternatives within the 16-27 kV segment.
"Hydraulic segment, by control type, to be the second-largest market from 2024 to 2030."
Hydraulic reclosers have been the backbone of automated fault protection in medium voltage distribution networks for decades. Their functionality revolves around a unique control mechanism that utilizes hydraulics for operation. Similar to other recloser types, hydraulic reclosers function as automatic circuit interrupters. Sensors continuously monitor the power line for faults. Upon detection, a fault current triggers a rapid increase in pressure within a sealed hydraulic circuit. This pressure surge activates a tripping mechanism that interrupts the current flow using internal contacts. The hydraulic system also plays a role in the reclosing sequence. After a pre-programmed delay, the hydraulic pressure is released, allowing the contacts to reclose and re-energize the line. This automated cycle continues for a set number of attempts, aiming to clear temporary faults while isolating persistent ones. Hydraulic reclosers were traditionally the dominant technology within the 16-27 kV recloser segment, finding application in various aspects of medium voltage distribution networks such as distribution feeders, overhead lines, substations (in conjunction with other switchgear). Hydraulic systems necessitate periodic maintenance to ensure proper operation and prevent leaks. This adds to the overall lifecycle cost compared to simpler electronic controls. While their dominance might wane due to the rise of electronic controls, they are likely to remain a viable option for specific applications and within existing infrastructure. As the recloser market evolves, advancements in technology and a focus on cost-effectiveness will determine the future trajectory of hydraulic reclosers.
"Middle East & Africa to be fourth largest region in recloser market."
The Middle East and Africa (MEA) recloser market presents a unique landscape with immense potential for future growth. Compared to North America or Europe, the MEA recloser market is in a relatively nascent stage. While some established utilities in the region utilize reclosers, overall penetration remains limited. Similar to other regions, aging grid infrastructure in many MEA countries necessitates upgrades for improved reliability and reduced outages. Reclosers offer a cost-effective solution for enhancing fault protection in specific sections of the grid. Government initiatives aimed at expanding electricity access to remote areas in Africa present an opportunity for reclosers. Their compact size and ease of installation make them suitable for these applications. The growing focus on renewable energy sources like solar and wind farms creates a need for grid integration solutions. Reclosers can manage fault currents associated with these distributed generation sources. The future of the MEA recloser market hinges on addressing specific challenges and capitalizing on emerging trends. Developing innovative financing models that make reclosers more accessible for utilities with limited budgets will be crucial for market expansion. Building local expertise in recloser installation, maintenance, and operation is essential for wider adoption. Training programs and knowledge-sharing initiatives can bridge this gap. The MEA recloser market is on the cusp of significant growth. By addressing challenges related to financing, expertise, and sustainability, and by offering cost-effective solutions with comprehensive support services, manufacturers can tap into the immense potential of this evolving market.
Breakdown of Primaries:
In-depth interviews with key industry participants, subject-matter experts, C-level executives of key market players, and industry consultants, among other experts, were conducted to obtain and verify critical qualitative and quantitative information, as well as to assess future market prospects. The primary interviews were distributed as follows:
By Company Type: Tier 1-30%, Tier 2-55%, and Tier 3-15%
By Designation: C-Level-30%, D-Level-20%, and Others-50%
By Region: North America-18%, Europe-8%, Asia Pacific-60%, South America-4% and
Middle East & Africa-10%.
Note: "Others" include sales managers, engineers, and regional managers
The tiers of the companies are defined based on their total revenue as of 2021: Tier 1: >USD 1 billion, Tier 2: USD 500 million-1 billion, and Tier 3: <USD 500 million.
The recloser market is predominantly governed by well-established global leaders. Notable players in the recloser market include Schneider Electric (France), Eaton (Ireland), Siemens (Germany), ABB (Switzerland), NOJA Power Switchgear Pty Ltd (Australia), General Electric (US), Hubbell (US), S&C Electric company (US), Tavrida Electric (US), ENTEC Electric & Electronic (South Korea), G&W Electric (US), Arteche Group (Spain), Ghorit Electrical Co., Ltd. (China), ILJIN ELECTRIC (South Korea), and several others.
Research Coverage:
The report provides a comprehensive definition, description, and forecast of the recloser market based on various parameters, including phase (Three-phase, Single-phase, and Triple Single-phase), control type (Electronic, Hydraulic), voltage rating (Up to 15 kV, 16-27 kV, and 28-38 kV), insulation medium (Oil, Air, and Epoxy), and region (Asia Pacific, North America, Europe, Middle East and Africa, South America). The report also offers a thorough qualitative and quantitative analysis of the recloser market, encompassing a comprehensive examination of the key market drivers, limitations, opportunities, and challenges. Additionally, it covers critical facets of the market, such as an assessment of the competitive landscape, an analysis of market dynamics, value-based market estimates, and future trends in the recloser market. The report provides investment and funding information of key players in the recloser market.
Key Benefits of Buying the Report
The report is thoughtfully designed to benefit both established industry leaders and newcomers in the recloser market. It provides reliable revenue forecasts for the entire market as well as its individual sub-segments. This data is a valuable resource for stakeholders, enabling them to gain a comprehensive understanding of the competitive landscape and formulate effective market strategies for their businesses. Furthermore, the report serves as a channel for stakeholders to grasp the current state of the market, providing essential insights into market drivers, limitations, challenges, and growth opportunities. By incorporating these insights, stakeholders can make well-informed decisions and stay informed about the constantly evolving dynamics of the recloser industry.
- Analysis of key drivers: (Strategic focus on grid modernization, Emphasis on integrating renewable energy sources into power grids, Expansion of transmission and distribution infrastructure), restraints (Substantial upfront cost associated with reclosers, Standardization and interoperability issues related to reclosers), opportunities (Rapid economic development and population growth in emerging markets, Government-run performance-based incentive schemes for power distribution network operators), and challenges (Lack of standardized security protocols, Intense competition among market players and potential threat of substitutes) influencing the growth of the recloser market.
- Product Development/ Innovation: The recloser market is in a constant state of evolution, with a primary focus on product development and innovation. Leading industry players like Schneider Electric, ABB, Siemens, and General Electric are at the forefront of advancing their product offerings to address shifting demands and environmental considerations. There is a notable shift towards enhancing the intelligence of recloser.
- Market Development: The recloser market is experiencing a surge globally, driven by a confluence of factors that necessitate grid modernization, improved reliability, and environmental considerations. Traditionally, reclosers have served as workhorses in medium voltage distribution networks. These automated circuit interrupters offer a cost-effective solution for enhancing protection in specific sections of the grid. They continuously monitor for faults using sensors, and upon detection, automatically interrupt the current flow using an arc quenching mechanism. However, a key distinction sets them apart: their reclosing sequence. This automated attempt to re-energize the line after a pre-programmed timeframe helps clear temporary faults while isolating persistent ones, minimizing outage durations for unaffected customers. A significant driver of the recloser market is the aging grid infrastructure prevalent in many regions worldwide. Upgrading these aging networks to ensure reliability and prevent outages is paramount. Reclosers offer a cost-effective solution by providing targeted fault protection, making them an attractive option for utilities. The focus on grid modernization further propels the recloser market. These automated devices align perfectly with the goals of these initiatives by providing automated fault isolation and protection capabilities. Additionally, the increasing penetration of renewable energy sources like wind and solar farms necessitates robust grid integration solutions. Reclosers play a crucial role here by managing the inherent variability of renewable generation and ensuring overall grid stability.
- Market Diversification: Traditionally, a single type of recloser might have served the needs of an entire distribution network. However, the evolving landscape of power grids necessitates a more nuanced approach. Solid dielectric reclosers are environmentally friendly alternatives to oil-insulated reclosers (OIL reclosers) are gaining traction. Their use of epoxy resin or other solid insulating materials caters to utilities prioritizing sustainability. Air-insulated reclosers eliminate environmental concerns associated with both oil and SF6 gas used in some switchgear. However, advancements in arc quenching technology and compact designs are crucial for their broader adoption, particularly in space-constrained environments. Single-phase reclosers cater to distribution feeders with predominantly single-phase loads or overhead lines susceptible to single-phase faults caused by lightning strikes or vegetation contact. Their ability to isolate faults on individual phases minimizes outage durations for unaffected customers on healthy phases. Manufacturers are increasingly focused on developing cost-effective solutions across the recloser spectrum. Manufacturers are exploring ways to reduce the production costs of even established OIL reclosers, ensuring they remain a viable choice for utilities with budgetary constraints. The future of the recloser market is no longer a uniform path. Instead, it's a diverse landscape offering a spectrum of solutions tailored to address the specific needs of different utilities and grid sections. By focusing on technological advancements, market segmentation, cost-effectiveness, and regional considerations, the recloser market is well-positioned to play a vital role in a constantly evolving power grid environment.
- Competitive Assessment: A comprehensive evaluation has been conducted to scrutinize the market presence, growth strategies, and service offerings of key players in the recloser market. These prominent companies include Schneider Electric (France), Eaton (Ireland), ABB (Switzerland), NOJA Power Switchgear Pty Ltd (Australia), Siemens (Germany), General Electric (US), Hubbell (US), S&C Electric Company (US), Tavrida Electric (US), ENTEC Electric & Electronic (South Korea), G&W Electric (US), Arteche Group (Spain), Ghorit Electrical Co., Ltd. (China), and others. This analysis provides in-depth insights into the competitive positions of these major players, their approaches to driving market growth, and the range of services they offer within the recloser segment.
TABLE OF CONTENTS
1 INTRODUCTION
- 1.1 STUDY OBJECTIVES
- 1.2 MARKET DEFINITION
- 1.3 INCLUSIONS AND EXCLUSIONS
- 1.3.1 RECLOSER MARKET, BY PHASE
- 1.3.2 RECLOSER MARKET, BY CONTROL TYPE
- 1.3.3 RECLOSER MARKET, BY VOLTAGE RATING
- 1.3.4 RECLOSER MARKET, BY INSULATION MEDIUM
- 1.3.5 RECLOSER MARKET, BY REGION
- 1.4 MARKET SCOPE
- 1.4.1 MARKET SEGMENTATION
- 1.4.2 REGIONAL SCOPE
- 1.4.3 YEARS CONSIDERED
- 1.5 CURRENCY CONSIDERED
- 1.6 UNITS CONSIDERED
- 1.7 LIMITATIONS
- 1.8 STAKEHOLDERS
- 1.9 SUMMARY OF CHANGES
2 RESEARCH METHODOLOGY
- 2.1 RESEARCH DATA
- FIGURE 1 RECLOSER MARKET: RESEARCH DESIGN
- 2.2 MARKET BREAKDOWN AND DATA TRIANGULATION
- FIGURE 2 DATA TRIANGULATION
- 2.2.1 SECONDARY DATA
- 2.2.1.1 Key data from secondary sources
- 2.2.1.2 List of major secondary sources
- 2.2.2 PRIMARY DATA
- 2.2.2.1 Breakdown of primaries
- FIGURE 3 KEY INDUSTRY INSIGHTS
- FIGURE 4 BREAKDOWN OF PRIMARY INTERVIEWS: BY COMPANY TYPE, DESIGNATION, AND REGION
- FIGURE 5 MAIN METRICS CONSIDERED TO ANALYZE AND ASSESS DEMAND FOR RECLOSERS
- 2.2.2.2 List of key participants in primary interviews
- 2.3 MARKET SIZE ESTIMATION
- 2.3.1 BOTTOM-UP APPROACH
- FIGURE 6 MARKET SIZE ESTIMATION METHODOLOGY: BOTTOM-UP APPROACH
- 2.3.2 TOP-DOWN APPROACH
- FIGURE 7 MARKET SIZE ESTIMATION METHODOLOGY: TOP-DOWN APPROACH
- 2.3.3 DEMAND-SIDE ANALYSIS
- 2.3.3.1 Regional analysis
- 2.3.3.2 Country-wise analysis
- 2.3.3.3 Demand-side assumptions
- 2.3.3.4 Demand-side calculations
- 2.3.4 SUPPLY-SIDE ANALYSIS
- FIGURE 8 KEY STEPS CONSIDERED TO ASSESS SUPPLY OF RECLOSERS
- FIGURE 9 RECLOSER MARKET: SUPPLY-SIDE ANALYSIS
- 2.3.4.1 Supply-side assumptions
- 2.3.4.2 Supply-side calculations
- 2.3.5 FORECAST
- 2.3.5.1 Impact of recession on recloser market
- 2.3.5.2 Research assumptions
3 EXECUTIVE SUMMARY
- TABLE 1 RECLOSER MARKET SNAPSHOT
- FIGURE 10 ASIA PACIFIC DOMINATED RECLOSER MARKET IN 2023
- FIGURE 11 THREE-PHASE SEGMENT TO HOLD LARGEST SHARE OF RECLOSER MARKET IN 2030
- FIGURE 12 ELECTRONIC RECLOSERS TO LEAD MARKET THROUGHOUT FORECAST PERIOD
- FIGURE 13 EPOXY SEGMENT TO EXHIBIT HIGHEST CAGR IN RECLOSER MARKET FROM 2024 TO 2030
- FIGURE 14 UP TO 15 KV SEGMENT TO COMMAND RECLOSER MARKET BETWEEN 2024 AND 2030
4 PREMIUM INSIGHTS
- 4.1 ATTRACTIVE OPPORTUNITIES FOR KEY PLAYERS IN RECLOSER MARKET
- FIGURE 15 EXPANSION OF TRANSMISSION AND DISTRIBUTION NETWORKS TO DRIVE MARKET BETWEEN 2024 AND 2030
- 4.2 RECLOSER MARKET, BY REGION
- FIGURE 16 ASIA PACIFIC TO BE FASTEST-GROWING MARKET DURING FORECAST PERIOD
- 4.3 RECLOSER MARKET IN ASIA PACIFIC, BY CONTROL TYPE AND COUNTRY, 2023
- FIGURE 17 ELECTRONIC SEGMENT AND CHINA ACCOUNTED FOR LARGEST SHARES OF RECLOSER MARKET IN 2023
- 4.4 RECLOSER MARKET, BY PHASE
- FIGURE 18 THREE-PHASE RECLOSERS TO ACCOUNT FOR MAJORITY OF MARKET SHARE IN 2030
- 4.5 RECLOSER MARKET, BY CONTROL TYPE
- FIGURE 19 ELECTRONIC SEGMENT TO ACCOUNT FOR LARGER MARKET SHARE THAN HYDRAULIC SEGMENT IN 2030
- 4.6 RECLOSER MARKET, BY VOLTAGE RATING
- FIGURE 20 RECLOSERS WITH VOLTAGE RATINGS OF UP TO 15 KV TO DOMINATE MARKET IN 2030
- 4.7 RECLOSER MARKET, BY INSULATION MEDIUM
- FIGURE 21 EPOXY SEGMENT TO CAPTURE LARGEST MARKET SHARE IN 2030
5 MARKET OVERVIEW
- 5.1 INTRODUCTION
- 5.2 MARKET DYNAMICS
- FIGURE 22 DRIVERS, RESTRAINTS, OPPORTUNITIES, AND CHALLENGES: RECLOSER MARKET
- 5.2.1 DRIVERS
- 5.2.1.1 Strategic focus on grid modernization
- FIGURE 23 GLOBAL INVESTMENTS IN POWER GRIDS, 2015-2022
- 5.2.1.2 Emphasis on integrating renewable energy sources into power grids
- FIGURE 24 GLOBAL RENEWABLE ELECTRICITY CAPACITY EXPANSION, 2005-2028
- 5.2.1.3 Expansion of transmission and distribution infrastructure
- FIGURE 25 INVESTMENTS IN T&D GRIDS, BY COUNTRY, 2018-2022
- 5.2.2 RESTRAINTS
- 5.2.2.1 Substantial upfront cost associated with reclosers
- 5.2.2.2 Standardization and interoperability issues related to reclosers
- 5.2.2.3 Fluctuating copper material prices
- FIGURE 26 AVERAGE COPPER PRICE PER ANNUM, 2017-2023 (USD/KG)
- 5.2.3 OPPORTUNITIES
- 5.2.3.1 Rapid economic development and population growth in emerging markets
- FIGURE 27 ENERGY INVESTMENTS IN EMERGING MARKETS, BY SOURCE TYPE, 2019 VS. 2022
- 5.2.3.2 Government-run performance-based incentive schemes for power distribution network operators
- 5.2.3.3 Introduction of reclosers with advanced functionalities
- 5.2.4 CHALLENGES
- 5.2.4.1 Lack of standardized cybersecurity protocols
- 5.2.4.2 Intense competition among market players and potential threat of substitutes
- 5.3 TRENDS/DISRUPTIONS IMPACTING CUSTOMER BUSINESS
- 5.3.1 TRENDS INFLUENCING CUSTOMER BUSINESS
- FIGURE 28 TRENDS IMPACTING CUSTOMER BUSINESS
- 5.4 ECOSYSTEM ANALYSIS
- FIGURE 29 KEY PLAYERS IN ECOSYSTEM
- TABLE 2 ROLE OF PARTICIPANTS IN ECOSYSTEM
- 5.5 INVESTMENT AND FUNDING SCENARIO
- FIGURE 30 FUNDING RAISED BY TOP PLAYERS IN RECLOSER MARKET, 2020-2024
- TABLE 3 ABB: FUNDING DETAILS
- TABLE 4 EATON CORPORATION: FUNDING DETAILS
- TABLE 5 SIEMENS: FUNDING DETAILS
- TABLE 6 NOJA POWER: FUNDING DETAILS
- 5.6 SUPPLY CHAIN ANALYSIS
- FIGURE 31 RECLOSER MARKET: SUPPLY CHAIN ANALYSIS
- 5.6.1 RAW MATERIAL PROVIDERS/SUPPLIERS
- 5.6.2 COMPONENT MANUFACTURERS
- 5.6.3 RECLOSER MANUFACTURERS/ASSEMBLERS
- 5.6.4 DISTRIBUTORS
- 5.6.5 END USERS
- 5.6.6 POST-SALES SERVICE PROVIDERS
- 5.7 TECHNOLOGY TRENDS
- 5.7.1 ARTIFICIAL INTELLIGENCE (AI)-BASED AUTOMATIC CIRCUIT RECLOSERS
- 5.7.2 INTERNET OF THINGS (IOT)-CONNECTED AUTOMATIC CIRCUIT RECLOSERS
- 5.8 PRICING ANALYSIS
- 5.8.1 INDICATIVE PRICING ANALYSIS, BY VOLTAGE RATING
- TABLE 7 INDICATIVE PRICES OF RECLOSERS, BY VOLTAGE RATING, 2023
- 5.8.2 AVERAGE SELLING PRICE TREND, BY REGION
- FIGURE 32 AVERAGE SELLING PRICE TREND, BY REGION, 2020-2023
- 5.9 KEY CONFERENCES AND EVENTS, 2024-2025
- TABLE 8 RECLOSER MARKET: DETAILED LIST OF CONFERENCES AND EVENTS
- 5.10 TARIFF AND REGULATORY LANDSCAPE
- 5.10.1 TARIFF ANALYSIS
- 5.10.1.1 Country-wise tariff for HS code 853690-compliant products
- TABLE 9 IMPORT TARIFFS FOR HS 853690-COMPLIANT LOW-VOLTAGE PROTECTION EQUIPMENT, 2022
- 5.10.1.2 Country-wise tariff for HS code 8535-compliant products
- TABLE 10 IMPORT TARIFFS FOR HS 8535-COMPLIANT HIGH-VOLTAGE PROTECTION EQUIPMENT, 2022
- 5.10.2 REGULATORY BODIES, GOVERNMENT AGENCIES, AND OTHER ORGANIZATIONS
- TABLE 11 NORTH AMERICA: LIST OF REGULATORY BODIES, GOVERNMENT AGENCIES, AND OTHER ORGANIZATIONS
- TABLE 12 EUROPE: LIST OF REGULATORY BODIES, GOVERNMENT AGENCIES, AND OTHER ORGANIZATIONS
- TABLE 13 ASIA PACIFIC: LIST OF REGULATORY BODIES, GOVERNMENT AGENCIES, AND OTHER ORGANIZATIONS
- TABLE 14 ROW: LIST OF REGULATORY BODIES, GOVERNMENT AGENCIES, AND OTHER ORGANIZATIONS
- 5.10.3 CODES AND REGULATIONS RELATED TO RECLOSER MARKET
- TABLE 15 RECLOSER MARKET: CODES AND REGULATIONS
- 5.10.1 TARIFF ANALYSIS
- 5.11 TRADE ANALYSIS
- 5.11.1 TRADE ANALYSIS FOR ELECTRICAL APPARATUS USED IN SWITCHING OR PROTECTING ELECTRICAL CIRCUITS EXCEEDING 1,000 VOLTS
- 5.11.2 IMPORT DATA
- TABLE 16 IMPORT SCENARIO FOR HS CODE 8535-COMPLIANT PRODUCTS, BY COUNTRY, 2020-2022 (USD THOUSAND)
- FIGURE 33 IMPORT DATA FOR HS CODE 8535-COMPLIANT PRODUCTS FOR TOP 5 COUNTRIES, 2018-2022 (USD THOUSAND)
- 5.11.3 EXPORT DATA
- TABLE 17 EXPORT SCENARIO FOR HS CODE 8535-COMPLIANT PRODUCTS, BY COUNTRY, 2020-2022 (USD)
- FIGURE 34 EXPORT DATA FOR HS CODE 8535-COMPLIANT PRODUCTS FOR TOP 5 COUNTRIES, 2018-2022 (USD THOUSAND)
- 5.11.4 TRADE ANALYSIS FOR ELECTRICAL APPARATUS USED IN SWITCHING OR PROTECTING ELECTRICAL CIRCUITS NOT EXCEEDING 1,000 VOLTS
- 5.11.5 IMPORT DATA
- TABLE 18 IMPORT SCENARIO FOR HS CODE 853690-COMPLIANT PRODUCTS, BY COUNTRY, 2020-2022 (USD)
- FIGURE 35 IMPORT DATA FOR HS CODE 853690-COMPLIANT PRODUCTS FOR TOP 5 COUNTRIES, 2018-2022 (USD THOUSAND)
- 5.11.6 EXPORT DATA
- TABLE 19 EXPORT SCENARIO FOR HS CODE 853690-COMPLIANT PRODUCTS, BY COUNTRY, 2020-2022 (USD)
- FIGURE 36 EXPORT DATA FOR HS CODE 853690-COMPLIANT PRODUCTS FOR TOP 5 COUNTRIES, 2018-2022 (USD THOUSAND)
- 5.12 PATENT ANALYSIS
- FIGURE 37 RECLOSER MARKET: INNOVATIONS AND PATENT REGISTRATIONS, 2013-2023
- TABLE 20 RECLOSER MARKET: INNOVATIONS AND PATENT REGISTRATIONS, DECEMBER 2020-DECEMBER 2023
- 5.13 PORTER'S FIVE FORCES ANALYSIS
- FIGURE 38 PORTER'S FIVE FORCES ANALYSIS FOR RECLOSER MARKET
- TABLE 21 RECLOSER MARKET: PORTER'S FIVE FORCES ANALYSIS
- 5.13.1 THREAT OF SUBSTITUTES
- TABLE 22 RECLOSER MARKET: COMPARISON OF SUBSTITUTES
- 5.13.2 BARGAINING POWER OF SUPPLIERS
- 5.13.3 BARGAINING POWER OF BUYERS
- 5.13.4 THREAT OF NEW ENTRANTS
- 5.13.5 INTENSITY OF COMPETITIVE RIVALRY
- 5.14 KEY STAKEHOLDERS AND BUYING CRITERIA
- 5.14.1 KEY STAKEHOLDERS IN BUYING PROCESS
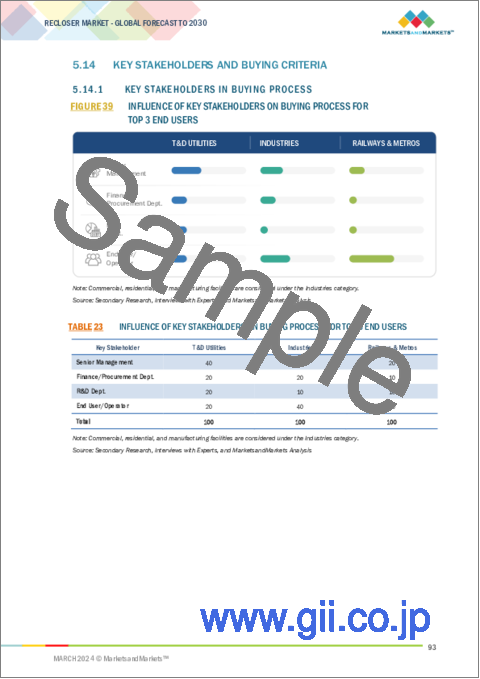
- FIGURE 39 INFLUENCE OF KEY STAKEHOLDERS ON BUYING PROCESS FOR TOP 3 END USERS
- TABLE 23 INFLUENCE OF KEY STAKEHOLDERS ON BUYING PROCESS FOR TOP 3 END USERS
- 5.15 BUYING CRITERIA
- FIGURE 40 KEY BUYING CRITERIA FOR TOP 3 END USERS
- TABLE 24 KEY BUYING CRITERIA FOR TOP 3 END USERS
- 5.16 CASE STUDY ANALYSIS
- 5.16.1 G&W ELECTRIC OFFERS PADMOUNT VIPER-ST RECLOSER TO UTILITY TO ENSURE COMPLIANCE WITH SAFETY STANDARDS
- 5.16.1.1 Problem statement
- 5.16.1.2 Solution
- 5.16.2 BANDERA ELECTRIC COOPERATIVE IMPLEMENTS TRIPSAVER II CUTOUT-MOUNTED RECLOSERS FOR RELIABLE FAULT INTERRUPTION AND EFFECTIVE GRID MANAGEMENT
- 5.16.2.1 Problem statement
- 5.16.2.2 Solution
- 5.16.3 G&W ELECTRIC VIPER DEPLOYS RECLOSER IN PV ARRAY AT STATE COLLEGE
- 5.16.3.1 Problem statement
- 5.16.3.2 Solution
- 5.16.1 G&W ELECTRIC OFFERS PADMOUNT VIPER-ST RECLOSER TO UTILITY TO ENSURE COMPLIANCE WITH SAFETY STANDARDS
6 RECLOSER MARKET, BY PHASE
- 6.1 INTRODUCTION
- FIGURE 41 RECLOSER MARKET, BY PHASE, 2023
- TABLE 25 RECLOSER MARKET, BY PHASE, 2020-2023 (USD MILLION)
- TABLE 26 RECLOSER MARKET, BY PHASE, 2024-2030 (USD MILLION)
- 6.2 THREE-PHASE
- 6.2.1 GROWING NEED FOR RELIABLE POWER SUPPLY IN RESIDENTIAL, COMMERCIAL, AND INDUSTRIAL SECTORS TO ACCELERATE SEGMENTAL GROWTH
- TABLE 27 THREE-PHASE: RECLOSER MARKET, BY REGION, 2020-2023 (USD MILLION)
- TABLE 28 THREE-PHASE: RECLOSER MARKET, BY REGION, 2024-2030 (USD MILLION)
- 6.3 SINGLE-PHASE
- 6.3.1 INCREASING INVESTMENT IN T&D PROJECTS TO DRIVE MARKET
- TABLE 29 SINGLE-PHASE: RECLOSER MARKET, BY REGION, 2020-2023 (USD MILLION)
- TABLE 30 SINGLE-PHASE: RECLOSER MARKET, BY REGION, 2024-2030 (USD MILLION)
- 6.4 TRIPLE SINGLE-PHASE
- 6.4.1 BETTER NETWORK RELIABILITY AND OVERCURRENT PROTECTION TO BOOST ADOPTION
- TABLE 31 TRIPLE SINGLE-PHASE: RECLOSER MARKET, BY REGION, 2020-2023 (USD MILLION)
- TABLE 32 TRIPLE SINGLE-PHASE: RECLOSER MARKET, BY REGION, 2024-2030 (USD MILLION)
7 RECLOSER MARKET, BY CONTROL TYPE
- 7.1 INTRODUCTION
- FIGURE 42 RECLOSER MARKET, BY CONTROL TYPE, 2023
- TABLE 33 RECLOSER MARKET, BY CONTROL TYPE, 2020-2023 (USD MILLION)
- TABLE 34 RECLOSER MARKET, BY CONTROL TYPE, 2024-2030 (USD MILLION)
- 7.2 ELECTRONIC
- 7.2.1 INCREASING INVESTMENT IN SMART GRIDS TO BOOST DEMAND
- TABLE 35 ELECTRONIC: RECLOSER MARKET, BY REGION, 2020-2023 (USD MILLION)
- TABLE 36 ELECTRONIC: RECLOSER MARKET, BY REGION, 2024-2030 (USD MILLION)
- 7.3 HYDRAULIC
- 7.3.1 GROWING NEED FOR RELIABLE BACKUP SOLUTIONS IN POWER DISTRIBUTION NETWORKS TO DRIVE MARKET
- TABLE 37 HYDRAULIC: RECLOSER MARKET, BY REGION, 2020-2023 (USD MILLION)
- TABLE 38 HYDRAULIC: RECLOSER MARKET, BY REGION, 2024-2030 (USD MILLION)
8 RECLOSER MARKET, BY VOLTAGE RATING
- 8.1 INTRODUCTION
- FIGURE 43 RECLOSER MARKET, BY VOLTAGE RATING, 2023
- TABLE 39 RECLOSER MARKET, BY VOLTAGE RATING, 2020-2023 (USD MILLION)
- TABLE 40 RECLOSER MARKET, BY VOLTAGE RATING, 2024-2030 (USD MILLION)
- TABLE 41 RECLOSER MARKET, BY VOLTAGE RATING, 2020-2023 (THOUSAND UNITS)
- TABLE 42 RECLOSER MARKET, BY VOLTAGE RATING, 2024-2030 (THOUSAND UNITS)
- 8.2 UP TO 15 KV
- 8.2.1 GROWING DEMAND FROM DEVELOPING COUNTRIES OWING TO AFFORDABLE PRICES TO BOOST SEGMENTAL GROWTH
- TABLE 43 UP TO 15 KV: RECLOSER MARKET, BY REGION, 2020-2023 (USD MILLION)
- TABLE 44 UP TO 15 KV: RECLOSER MARKET, BY REGION, 2024-2030 (USD MILLION)
- TABLE 45 UP TO 15 KV: RECLOSER MARKET, BY REGION, 2020-2023 (THOUSAND UNITS)
- TABLE 46 UP TO 15 KV: RECLOSER MARKET, BY REGION, 2024-2030 (THOUSAND UNITS)
- 8.3 16-27 KV
- 8.3.1 SURGING DEMAND FOR RELIABLE POWER SUPPLY FROM INDUSTRIAL AND COMMERCIAL SECTORS TO FUEL SEGMENTAL GROWTH
- TABLE 47 16-27 KV: RECLOSER MARKET, BY REGION, 2020-2023 (USD MILLION)
- TABLE 48 16-27 KV: RECLOSER MARKET, BY REGION, 2024-2030 (USD MILLION)
- TABLE 49 16-27 KV: RECLOSER MARKET, BY REGION, 2020-2023 (THOUSAND UNITS)
- TABLE 50 16-27 KV: RECLOSER MARKET, BY REGION, 2024-2030 (THOUSAND UNITS)
- 8.4 28-38 KV
- 8.4.1 INCREASING USE OF RENEWABLE ENERGY SOURCES TO ACCELERATE MARKET GROWTH
- TABLE 51 28-38 KV: RECLOSER MARKET, BY REGION, 2020-2023 (USD MILLION)
- TABLE 52 28-38 KV: RECLOSER MARKET, BY REGION, 2024-2030 (USD MILLION)
- TABLE 53 28-38 KV: RECLOSER MARKET, BY REGION, 2020-2023 (THOUSAND UNITS)
- TABLE 54 28-38 KV: RECLOSER MARKET, BY REGION, 2024-2030 (THOUSAND UNITS)
9 RECLOSER MARKET, BY INSULATION MEDIUM
- 9.1 INTRODUCTION
- FIGURE 44 RECLOSER MARKET, BY INSULATION MEDIUM, 2023
- TABLE 55 RECLOSER MARKET, BY INSULATION MEDIUM, 2020-2023 (USD MILLION)
- TABLE 56 RECLOSER MARKET, BY INSULATION MEDIUM, 2024-2030 (USD MILLION)
- 9.2 OIL
- 9.2.1 STRINGENT ENVIRONMENTAL REGULATIONS TO LIMIT ADOPTION
- TABLE 57 OIL: RECLOSER MARKET, BY REGION, 2020-2023 (USD MILLION)
- TABLE 58 OIL: RECLOSER MARKET, BY REGION, 2024-2030 (USD MILLION)
- 9.3 AIR
- 9.3.1 SIMPLER DESIGN AND MINIMAL MAINTENANCE TO BOOST DEMAND
- TABLE 59 AIR: RECLOSER MARKET, BY REGION, 2020-2023 (USD MILLION)
- TABLE 60 AIR: RECLOSER MARKET, BY REGION, 2024-2030 (USD MILLION)
- 9.4 EPOXY
- 9.4.1 ECO-FRIENDLY DESIGN AND ABILITY TO WITHSTAND HIGH VOLTAGE STRESS TO FUEL MARKET GROWTH
- TABLE 61 EPOXY: RECLOSER MARKET, BY REGION, 2020-2023 (USD MILLION)
- TABLE 62 EPOXY: RECLOSER MARKET, BY REGION, 2024-2030 (USD MILLION)
10 RECLOSER MARKET, BY REGION
- 10.1 INTRODUCTION
- FIGURE 45 ASIA PACIFIC TO RECORD HIGHEST CAGR IN RECLOSER MARKET DURING FORECAST PERIOD
- FIGURE 46 RECLOSER MARKET SHARE (IN TERMS OF VALUE), BY REGION, 2023
- TABLE 63 RECLOSER MARKET, BY REGION, 2020-2023 (USD MILLION)
- TABLE 64 RECLOSER MARKET, BY REGION, 2024-2030 (USD MILLION)
- 10.2 ASIA PACIFIC
- 10.2.1 RECESSION IMPACT ON MARKET IN ASIA PACIFIC
- FIGURE 47 ASIA PACIFIC: RECLOSER MARKET SNAPSHOT
- TABLE 65 ASIA PACIFIC: RECLOSER MARKET, BY PHASE, 2020-2023 (USD MILLION)
- TABLE 66 ASIA PACIFIC: RECLOSER MARKET, BY PHASE, 2024-2030 (USD MILLION)
- TABLE 67 ASIA PACIFIC: RECLOSER MARKET, BY CONTROL TYPE, 2020-2023 (USD MILLION)
- TABLE 68 ASIA PACIFIC: RECLOSER MARKET, BY CONTROL TYPE, 2024-2030 (USD MILLION)
- TABLE 69 ASIA PACIFIC: RECLOSER MARKET, BY INSULATION MEDIUM, 2020-2023 (USD MILLION)
- TABLE 70 ASIA PACIFIC: RECLOSER MARKET, BY INSULATION MEDIUM, 2024-2030 (USD MILLION)
- TABLE 71 ASIA PACIFIC: RECLOSER MARKET, BY VOLTAGE RATING, 2020-2023 (USD MILLION)
- TABLE 72 ASIA PACIFIC: RECLOSER MARKET, BY VOLTAGE RATING, 2024-2030 (USD MILLION)
- TABLE 73 ASIA PACIFIC: RECLOSER MARKET, BY COUNTRY, 2020-2023 (USD MILLION)
- TABLE 74 ASIA PACIFIC: RECLOSER MARKET, BY COUNTRY, 2024-2030 (USD MILLION)
- 10.2.1.1 China
- 10.2.1.1.1 Rising investment in clean energy and grid modernization projects to fuel market growth
- 10.2.1.1 China
- TABLE 75 CHINA: RECLOSER MARKET, BY PHASE, 2020-2023 (USD MILLION)
- TABLE 76 CHINA: RECLOSER MARKET, BY PHASE, 2024-2030 (USD MILLION)
- TABLE 77 CHINA: RECLOSER MARKET, BY CONTROL TYPE, 2020-2023 (USD MILLION)
- TABLE 78 CHINA: RECLOSER MARKET, BY CONTROL TYPE, 2024-2030 (USD MILLION)
- 10.2.1.2 Australia
- 10.2.1.2.1 Growing focus on improving network reliability and resilience to drive market
- 10.2.1.2 Australia
- TABLE 79 AUSTRALIA: RECLOSER MARKET, BY PHASE, 2020-2023 (USD MILLION)
- TABLE 80 AUSTRALIA: RECLOSER MARKET, BY PHASE, 2024-2030 (USD MILLION)
- TABLE 81 AUSTRALIA: RECLOSER MARKET, BY CONTROL TYPE, 2020-2023 (USD MILLION)
- TABLE 82 AUSTRALIA: RECLOSER MARKET, BY CONTROL TYPE, 2024-2030 (USD MILLION)
- 10.2.1.3 India
- 10.2.1.3.1 Government initiatives in electrification projects to stimulate market growth
- 10.2.1.3 India
- TABLE 83 INDIA: RECLOSER MARKET, BY PHASE, 2020-2023 (USD MILLION)
- TABLE 84 INDIA: RECLOSER MARKET, BY PHASE, 2024-2030 (USD MILLION)
- TABLE 85 INDIA: RECLOSER MARKET, BY CONTROL TYPE, 2020-2023 (USD MILLION)
- TABLE 86 INDIA: RECLOSER MARKET, BY CONTROL TYPE, 2024-2030 (USD MILLION)
- 10.2.1.4 South Korea
- 10.2.1.4.1 Rapid transition toward renewable energy sources to accelerate demand
- 10.2.1.4 South Korea
- TABLE 87 SOUTH KOREA: RECLOSER MARKET, BY PHASE, 2020-2023 (USD MILLION)
- TABLE 88 SOUTH KOREA: RECLOSER MARKET, BY PHASE, 2024-2030 (USD MILLION)
- TABLE 89 SOUTH KOREA: RECLOSER MARKET, BY CONTROL TYPE, 2020-2023 (USD MILLION)
- TABLE 90 SOUTH KOREA: RECLOSER MARKET, BY CONTROL TYPE, 2024-2030 (USD MILLION)
- 10.2.1.5 Rest of Asia Pacific
- TABLE 91 REST OF ASIA PACIFIC: RECLOSER MARKET, BY PHASE, 2020-2023 (USD MILLION)
- TABLE 92 REST OF ASIA PACIFIC: RECLOSER MARKET, BY PHASE, 2024-2030 (USD MILLION)
- TABLE 93 REST OF ASIA PACIFIC: RECLOSER MARKET, BY CONTROL TYPE, 2020-2023 (USD MILLION)
- TABLE 94 REST OF ASIA PACIFIC: RECLOSER MARKET, BY CONTROL TYPE, 2024-2030 (USD MILLION)
- 10.3 NORTH AMERICA
- 10.3.1 RECESSION IMPACT ON MARKET IN NORTH AMERICA
- FIGURE 48 NORTH AMERICA: RECLOSER MARKET SNAPSHOT
- TABLE 95 NORTH AMERICA: RECLOSER MARKET, BY PHASE, 2020-2023 (USD MILLION)
- TABLE 96 NORTH AMERICA: RECLOSER MARKET, BY PHASE, 2024-2030 (USD MILLION)
- TABLE 97 NORTH AMERICA: RECLOSER MARKET, BY CONTROL TYPE, 2020-2023 (USD MILLION)
- TABLE 98 NORTH AMERICA: RECLOSER MARKET, BY CONTROL TYPE, 2024-2030 (USD MILLION)
- TABLE 99 NORTH AMERICA: RECLOSER MARKET, BY INSULATION MEDIUM, 2020-2023 (USD MILLION)
- TABLE 100 NORTH AMERICA: RECLOSER MARKET, BY INSULATION MEDIUM, 2024-2030 (USD MILLION)
- TABLE 101 NORTH AMERICA: RECLOSER MARKET, BY VOLTAGE RATING, 2020-2023 (USD MILLION)
- TABLE 102 NORTH AMERICA: RECLOSER MARKET, BY VOLTAGE RATING, 2024-2030 (USD MILLION)
- TABLE 103 NORTH AMERICA: RECLOSER MARKET, BY COUNTRY, 2020-2023 (USD MILLION)
- TABLE 104 NORTH AMERICA: RECLOSER MARKET, BY COUNTRY, 2024-2030 (USD MILLION)
- 10.3.1.1 US
- 10.3.1.1.1 Pressing need to shift from aging coal-fired power plants to gas-fired flexible power plants to boost demand
- 10.3.1.1 US
- TABLE 105 US: RECLOSER MARKET, BY PHASE, 2020-2023 (USD MILLION)
- TABLE 106 US: RECLOSER MARKET, BY PHASE, 2024-2030 (USD MILLION)
- TABLE 107 US: RECLOSER MARKET, BY CONTROL TYPE, 2020-2023 (USD MILLION)
- TABLE 108 US: RECLOSER MARKET, BY CONTROL TYPE, 2024-2030 (USD MILLION)
- 10.3.1.2 Canada
- 10.3.1.2.1 Strong focus on increasing proportion of renewables in energy mix to boost demand
- 10.3.1.2 Canada
- TABLE 109 CANADA: RECLOSER MARKET, BY PHASE, 2020-2023 (USD MILLION)
- TABLE 110 CANADA: RECLOSER MARKET, BY PHASE, 2024-2030 (USD MILLION)
- TABLE 111 CANADA: RECLOSER MARKET, BY CONTROL TYPE, 2020-2023 (USD MILLION)
- TABLE 112 CANADA: RECLOSER MARKET, BY CONTROL TYPE, 2024-2030 (USD MILLION)
- 10.3.1.3 Mexico
- 10.3.1.3.1 Increasing investment in power infrastructure development to foster market growth
- 10.3.1.3 Mexico
- TABLE 113 MEXICO: RECLOSER MARKET, BY PHASE, 2020-2023 (USD MILLION)
- TABLE 114 MEXICO: RECLOSER MARKET, BY PHASE, 2024-2030 (USD MILLION)
- TABLE 115 MEXICO: RECLOSER MARKET, BY CONTROL TYPE, 2020-2023 (USD MILLION)
- TABLE 116 MEXICO: RECLOSER MARKET, BY CONTROL TYPE, 2024-2030 (USD MILLION)
- 10.4 EUROPE
- 10.4.1 RECESSION IMPACT ON MARKET IN EUROPE
- TABLE 117 EUROPE: RECLOSER MARKET, BY PHASE, 2020-2023 (USD MILLION)
- TABLE 118 EUROPE: RECLOSER MARKET, BY PHASE, 2024-2030 (USD MILLION)
- TABLE 119 EUROPE: RECLOSER MARKET, BY CONTROL TYPE, 2020-2023 (USD MILLION)
- TABLE 120 EUROPE: RECLOSER MARKET, BY CONTROL TYPE, 2024-2030 (USD MILLION)
- TABLE 121 EUROPE: RECLOSER MARKET, BY INSULATION MEDIUM, 2020-2023 (USD MILLION)
- TABLE 122 EUROPE: RECLOSER MARKET, BY INSULATION MEDIUM, 2024-2030 (USD MILLION)
- TABLE 123 EUROPE: RECLOSER MARKET, BY VOLTAGE RATING, 2020-2023 (USD MILLION)
- TABLE 124 EUROPE: RECLOSER MARKET, BY VOLTAGE RATING, 2024-2030 (USD MILLION)
- TABLE 125 EUROPE: RECLOSER MARKET, BY COUNTRY, 2020-2023 (USD MILLION)
- TABLE 126 EUROPE: RECLOSER MARKET, BY COUNTRY, 2024-2030 (USD MILLION)
- 10.4.1.1 Germany
- 10.4.1.1.1 Significant focus on expanding grid infrastructure and power transmission network to drive market
- 10.4.1.1 Germany
- TABLE 127 GERMANY: RECLOSER MARKET, BY PHASE, 2020-2023 (USD MILLION)
- TABLE 128 GERMANY: RECLOSER MARKET, BY PHASE, 2024-2030 (USD MILLION)
- TABLE 129 GERMANY: RECLOSER MARKET, BY CONTROL TYPE, 2020-2023 (USD MILLION)
- TABLE 130 GERMANY: RECLOSER MARKET, BY CONTROL TYPE, 2024-2030 (USD MILLION)
- 10.4.1.2 UK
- 10.4.1.2.1 Increasing focus on power generation using renewable sources to propel market
- 10.4.1.2 UK
- TABLE 131 UK: RECLOSER MARKET, BY PHASE, 2020-2023 (USD MILLION)
- TABLE 132 UK: RECLOSER MARKET, BY PHASE, 2024-2030 (USD MILLION)
- TABLE 133 UK: RECLOSER MARKET, BY CONTROL TYPE, 2020-2023 (USD MILLION)
- TABLE 134 UK: RECLOSER MARKET, BY CONTROL TYPE, 2024-2030 (USD MILLION)
- 10.4.1.3 Italy
- 10.4.1.3.1 Shift from natural gas toward renewable energy to stimulate market growth
- 10.4.1.3 Italy
- TABLE 135 ITALY: RECLOSER MARKET, BY PHASE, 2020-2023 (USD MILLION)
- TABLE 136 ITALY: RECLOSER MARKET, BY PHASE, 2024-2030 (USD MILLION)
- TABLE 137 ITALY: RECLOSER MARKET, BY CONTROL TYPE, 2020-2023 (USD MILLION)
- TABLE 138 ITALY: RECLOSER MARKET, BY CONTROL TYPE, 2024-2030 (USD MILLION)
- 10.4.1.4 France
- 10.4.1.4.1 Government initiatives to replace aging infrastructure with smart grid technology to provide growth opportunities
- 10.4.1.4 France
- TABLE 139 FRANCE: RECLOSER MARKET, BY PHASE, 2020-2023 (USD MILLION)
- TABLE 140 FRANCE: RECLOSER MARKET, BY PHASE, 2024-2030 (USD MILLION)
- TABLE 141 FRANCE: RECLOSER MARKET, BY CONTROL TYPE, 2020-2023 (USD MILLION)
- TABLE 142 FRANCE: RECLOSER MARKET, BY CONTROL TYPE, 2024-2030 (USD MILLION)
- 10.4.1.5 Spain
- 10.4.1.5.1 Development of electricity transmission networks to fuel demand
- 10.4.1.5 Spain
- TABLE 143 SPAIN: RECLOSER MARKET, BY PHASE, 2020-2023 (USD MILLION)
- TABLE 144 SPAIN: RECLOSER MARKET, BY PHASE, 2024-2030 (USD MILLION)
- TABLE 145 SPAIN: RECLOSER MARKET, BY CONTROL TYPE, 2020-2023 (USD MILLION)
- TABLE 146 SPAIN: RECLOSER MARKET, BY CONTROL TYPE, 2024-2030 (USD MILLION)
- 10.4.1.6 Rest of Europe
- TABLE 147 REST OF EUROPE: RECLOSER MARKET, BY PHASE, 2020-2023 (USD MILLION)
- TABLE 148 REST OF EUROPE: RECLOSER MARKET, BY PHASE, 2024-2030 (USD MILLION)
- TABLE 149 REST OF EUROPE: RECLOSER MARKET, BY CONTROL TYPE, 2020-2023 (USD MILLION)
- TABLE 150 REST OF EUROPE: RECLOSER MARKET, BY CONTROL TYPE, 2024-2030 (USD MILLION)
- 10.5 MIDDLE EAST & AFRICA
- 10.5.1 RECESSION IMPACT ON MARKET IN MIDDLE EAST & AFRICA
- TABLE 151 MIDDLE EAST & AFRICA: RECLOSER MARKET, BY PHASE, 2020-2023 (USD MILLION)
- TABLE 152 MIDDLE EAST & AFRICA: RECLOSER MARKET, BY PHASE, 2024-2030 (USD MILLION)
- TABLE 153 MIDDLE EAST & AFRICA: RECLOSER MARKET, BY CONTROL TYPE, 2020-2023 (USD MILLION)
- TABLE 154 MIDDLE EAST & AFRICA: RECLOSER MARKET, BY CONTROL TYPE, 2024-2030 (USD MILLION)
- TABLE 155 MIDDLE EAST & AFRICA: RECLOSER MARKET, BY INSULATION MEDIUM, 2020-2023 (USD MILLION)
- TABLE 156 MIDDLE EAST & AFRICA: RECLOSER MARKET, BY INSULATION MEDIUM, 2024-2030 (USD MILLION)
- TABLE 157 MIDDLE EAST & AFRICA: RECLOSER MARKET, BY VOLTAGE RATING, 2020-2023 (USD MILLION)
- TABLE 158 MIDDLE EAST & AFRICA: RECLOSER MARKET, BY VOLTAGE RATING, 2024-2030 (USD MILLION)
- TABLE 159 MIDDLE EAST & AFRICA: RECLOSER MARKET, BY COUNTRY, 2020-2023 (USD MILLION)
- TABLE 160 MIDDLE EAST & AFRICA: RECLOSER MARKET, BY COUNTRY, 2024-2030 (USD MILLION)
- 10.5.1.1 GCC countries
- TABLE 161 GCC COUNTRIES: RECLOSER MARKET, BY PHASE, 2020-2023 (USD MILLION)
- TABLE 162 GCC COUNTRIES: RECLOSER MARKET, BY PHASE, 2024-2030 (USD MILLION)
- TABLE 163 GCC COUNTRIES: RECLOSER MARKET, BY CONTROL TYPE, 2020-2023 (USD MILLION)
- TABLE 164 GCC COUNTRIES: RECLOSER MARKET, BY CONTROL TYPE, 2024-2030 (USD MILLION)
- TABLE 165 GCC COUNTRIES: RECLOSER MARKET, BY COUNTRY, 2020-2023 (USD MILLION)
- TABLE 166 GCC COUNTRIES: RECLOSER MARKET, BY COUNTRY, 2024-2030 (USD MILLION)
- 10.5.1.2 Saudi Arabia
- 10.5.1.2.1 Government policies aiming to reduce carbon emissions to drive market
- 10.5.1.2 Saudi Arabia
- TABLE 167 SAUDI ARABIA: RECLOSER MARKET, BY PHASE, 2020-2023 (USD MILLION)
- TABLE 168 SAUDI ARABIA: RECLOSER MARKET, BY PHASE, 2024-2030 (USD MILLION)
- TABLE 169 SAUDI ARABIA: RECLOSER MARKET, BY CONTROL TYPE, 2020-2023 (USD MILLION)
- TABLE 170 SAUDI ARABIA: RECLOSER MARKET, BY CONTROL TYPE, 2024-2030 (USD MILLION)
- 10.5.1.3 UAE
- 10.5.1.3.1 Rapid economic development and increasing demand for power to fuel market growth
- 10.5.1.3 UAE
- TABLE 171 UAE: RECLOSER MARKET, BY PHASE, 2020-2023 (USD MILLION)
- TABLE 172 UAE: RECLOSER MARKET, BY PHASE, 2024-2030 (USD MILLION)
- TABLE 173 UAE: RECLOSER MARKET, BY CONTROL TYPE, 2020-2023 (USD MILLION)
- TABLE 174 UAE: RECLOSER MARKET, BY CONTROL TYPE, 2024-2030 (USD MILLION)
- 10.5.1.4 Rest of GCC countries
- TABLE 175 REST OF GCC COUNTRIES: RECLOSER MARKET, BY PHASE, 2020-2023 (USD MILLION)
- TABLE 176 REST OF GCC COUNTRIES: RECLOSER MARKET, BY PHASE, 2024-2030 (USD MILLION)
- TABLE 177 REST OF GCC COUNTRIES: RECLOSER MARKET, BY CONTROL TYPE, 2020-2023 (USD MILLION)
- TABLE 178 REST OF GCC COUNTRIES: RECLOSER MARKET, BY CONTROL TYPE, 2024-2030 (USD MILLION)
- 10.5.1.5 South Africa
- 10.5.1.5.1 Grid modernization initiative to fuel market growth
- 10.5.1.5 South Africa
- TABLE 179 SOUTH AFRICA: RECLOSER MARKET, BY PHASE, 2020-2023 (USD MILLION)
- TABLE 180 SOUTH AFRICA: RECLOSER MARKET, BY PHASE, 2024-2030 (USD MILLION)
- TABLE 181 SOUTH AFRICA: RECLOSER MARKET, BY CONTROL TYPE, 2020-2023 (USD MILLION)
- TABLE 182 SOUTH AFRICA: RECLOSER MARKET, BY CONTROL TYPE, 2024-2030 (USD MILLION)
- 10.5.1.6 Nigeria
- 10.5.1.6.1 Growing demand for renewable energy to drive market
- 10.5.1.6 Nigeria
- TABLE 183 NIGERIA: RECLOSER MARKET, BY PHASE, 2020-2023 (USD MILLION)
- TABLE 184 NIGERIA: RECLOSER MARKET, BY PHASE, 2024-2030 (USD MILLION)
- TABLE 185 NIGERIA: RECLOSER MARKET, BY CONTROL TYPE, 2020-2023 (USD MILLION)
- TABLE 186 NIGERIA: RECLOSER MARKET, BY CONTROL TYPE, 2024-2030 (USD MILLION)
- 10.5.1.7 Rest of Middle East & Africa
- TABLE 187 REST OF MIDDLE EAST & AFRICA: RECLOSER MARKET, BY PHASE, 2020-2023 (USD MILLION)
- TABLE 188 REST OF MIDDLE EAST & AFRICA: RECLOSER MARKET, BY PHASE, 2024-2030 (USD MILLION)
- TABLE 189 REST OF MIDDLE EAST & AFRICA: RECLOSER MARKET, BY CONTROL TYPE, 2020-2023 (USD MILLION)
- TABLE 190 REST OF MIDDLE EAST & AFRICA: RECLOSER MARKET, BY CONTROL TYPE, 2024-2030 (USD MILLION)
- 10.6 SOUTH AMERICA
- 10.6.1 RECESSION IMPACT ON MARKET IN SOUTH AMERICA
- TABLE 191 SOUTH AMERICA: RECLOSER MARKET, BY PHASE, 2020-2023 (USD MILLION)
- TABLE 192 SOUTH AMERICA: RECLOSER MARKET, BY PHASE, 2024-2030 (USD MILLION)
- TABLE 193 SOUTH AMERICA: RECLOSER MARKET, BY CONTROL TYPE, 2020-2023 (USD MILLION)
- TABLE 194 SOUTH AMERICA: RECLOSER MARKET, BY CONTROL TYPE, 2024-2030 (USD MILLION)
- TABLE 195 SOUTH AMERICA: RECLOSER MARKET, BY INSULATION MEDIUM, 2020-2023 (USD MILLION)
- TABLE 196 SOUTH AMERICA: RECLOSER MARKET, BY INSULATION MEDIUM, 2024-2030 (USD MILLION)
- TABLE 197 SOUTH AMERICA: RECLOSER MARKET, BY VOLTAGE RATING, 2020-2023 (USD MILLION)
- TABLE 198 SOUTH AMERICA: RECLOSER MARKET SIZE, BY VOLTAGE RATING, 2024-2030 (USD MILLION)
- TABLE 199 SOUTH AMERICA: RECLOSER MARKET, BY COUNTRY, 2020-2023 (USD MILLION)
- TABLE 200 SOUTH AMERICA: RECLOSER MARKET SIZE, BY COUNTRY, 2024-2030 (USD MILLION)
- 10.6.1.1 Brazil
- 10.6.1.1.1 Increasing electrification initiatives to boost demand
- 10.6.1.1 Brazil
- TABLE 201 BRAZIL: RECLOSER MARKET, BY PHASE, 2020-2023 (USD MILLION)
- TABLE 202 BRAZIL: RECLOSER MARKET, BY PHASE, 2024-2030 (USD MILLION)
- TABLE 203 BRAZIL: RECLOSER MARKET, BY CONTROL TYPE, 2020-2023 (USD MILLION)
- TABLE 204 BRAZIL: RECLOSER MARKET, BY CONTROL TYPE, 2024-2030 (USD MILLION)
- 10.6.1.2 Argentina
- 10.6.1.2.1 Thriving industrial sector to boost demand
- 10.6.1.2 Argentina
- TABLE 205 ARGENTINA: RECLOSER MARKET, BY PHASE, 2020-2023 (USD MILLION)
- TABLE 206 ARGENTINA: RECLOSER MARKET, BY PHASE, 2024-2030 (USD MILLION)
- TABLE 207 ARGENTINA: RECLOSER MARKET, BY CONTROL TYPE, 2020-2023 (USD MILLION)
- TABLE 208 ARGENTINA: RECLOSER MARKET, BY CONTROL TYPE, 2024-2030 (USD MILLION)
- 10.6.1.3 Chile
- 10.6.1.3.1 Advancements in power infrastructure to drive market
- 10.6.1.3 Chile
- TABLE 209 CHILE: RECLOSER MARKET, BY PHASE, 2020-2023 (USD MILLION)
- TABLE 210 CHILE: RECLOSER MARKET, BY PHASE, 2024-2030 (USD MILLION)
- TABLE 211 CHILE: RECLOSER MARKET, BY CONTROL TYPE, 2020-2023 (USD MILLION)
- TABLE 212 CHILE: RECLOSER MARKET, BY CONTROL TYPE, 2024-2030 (USD MILLION)
- 10.6.1.4 Rest of South America
- TABLE 213 REST OF SOUTH AMERICA: RECLOSER MARKET, BY PHASE, 2020-2023 (USD MILLION)
- TABLE 214 REST OF SOUTH AMERICA: RECLOSER MARKET, BY PHASE, 2024-2030 (USD MILLION)
- TABLE 215 REST OF SOUTH AMERICA: RECLOSER MARKET, BY CONTROL TYPE, 2020-2023 (USD MILLION)
- TABLE 216 REST OF SOUTH AMERICA: RECLOSER MARKET, BY CONTROL TYPE, 2024-2030 (USD MILLION)
11 COMPETITIVE LANDSCAPE
- 11.1 OVERVIEW
- 11.2 MAJOR STRATEGIES ADOPTED BY KEY PLAYERS, 2020-2024
- TABLE 217 OVERVIEW OF KEY STRATEGIES ADOPTED BY TOP PLAYERS, APRIL 2020-FEBRUARY 2024
- 11.3 MARKET SHARE ANALYSIS OF TOP 5 PLAYERS, 2023
- TABLE 218 RECLOSER MARKET: DEGREE OF COMPETITION, 2023
- FIGURE 49 RECLOSER MARKET SHARE ANALYSIS, 2023
- 11.4 REVENUE ANALYSIS OF TOP 4 MARKET PLAYERS, 2018-2022
- FIGURE 50 FIVE-YEAR REVENUE ANALYSIS OF TOP PLAYERS IN RECLOSER MARKET, 2018-2022
- 11.5 COMPANY EVALUATION MATRIX: KEY PLAYERS, 2023
- 11.5.1 STARS
- 11.5.2 PERVASIVE PLAYERS
- 11.5.3 EMERGING LEADERS
- 11.5.4 PARTICIPANTS
- FIGURE 51 RECLOSER MARKET: COMPANY EVALUATION MATRIX (KEY PLAYERS), 2023
- 11.6 COMPANY FOOTPRINT: KEY PLAYERS
- FIGURE 52 RECLOSER MARKET: COMPANY FOOTPRINT
- 11.6.1 PHASE FOOTPRINT
- TABLE 219 COMPANY FOOTPRINT: BY PHASE
- 11.6.2 CONTROL TYPE FOOTPRINT
- TABLE 220 COMPANY FOOTPRINT: BY CONTROL TYPE
- 11.6.3 INSULATION MEDIUM FOOTPRINT
- TABLE 221 COMPANY FOOTPRINT: BY INSULATION MEDIUM
- 11.6.4 VOLTAGE RATING FOOTPRINT
- TABLE 222 COMPANY FOOTPRINT: BY VOLTAGE RATING
- 11.6.5 REGION FOOTPRINT
- TABLE 223 COMPANY FOOTPRINT: BY REGION
- 11.7 COMPANY EVALUATION MATRIX: STARTUPS/SMES, 2023
- 11.7.1 PROGRESSIVE COMPANIES
- 11.7.2 RESPONSIVE COMPANIES
- 11.7.3 DYNAMIC COMPANIES
- 11.7.4 STARTING BLOCKS
- FIGURE 53 RECLOSER MARKET: COMPANY EVALUATION MATRIX (STARTUPS/SMES), 2023
- 11.7.5 COMPETITIVE BENCHMARKING, STARTUPS/SMES, 2023
- 11.7.5.1 Detailed list of startups/SMEs
- TABLE 224 RECLOSER MARKET: LIST OF KEY STARTUPS/SMES
- 11.7.6 COMPETITIVE BENCHMARKING OF KEY STARTUPS/SMES
- TABLE 225 RECLOSER MARKET: COMPETITIVE BENCHMARKING OF KEY PLAYERS (STARTUPS/SMES)
- 11.8 COMPANY VALUATION AND FINANCIAL METRICS
- FIGURE 54 EV/EBITDA OF KEY VENDORS
- FIGURE 55 COMPANY VALUATION OF KEY VENDORS
- 11.8.1 BRAND/PRODUCT COMPARISON
- FIGURE 56 BRAND/PRODUCT COMPARISON OF KEY VENDORS
- 11.9 COMPETITIVE SCENARIO AND TRENDS
- 11.9.1 PRODUCT LAUNCHES
- TABLE 226 RECLOSER MARKET: PRODUCT LAUNCHES, APRIL 2020-FEBRUARY 2024
- 11.9.2 DEALS
- TABLE 227 RECLOSER MARKET: DEALS, APRIL 2020-FEBRUARY 2024
- 11.9.3 EXPANSIONS
- TABLE 228 RECLOSER MARKET: EXPANSIONS, APRIL 2020-FEBRUARY 2024
- 11.9.4 OTHERS
- TABLE 229 RECLOSER MARKET: OTHERS, APRIL 2020-FEBRUARY 2024
12 COMPANY PROFILES
(Business Overview, Products Offered, Recent Developments, MnM View Right to win, Strategic choices made, Weaknesses and competitive threats) **
- 12.1 KEY PLAYERS
- 12.1.1 ABB
- TABLE 230 ABB: COMPANY OVERVIEW
- FIGURE 57 ABB: COMPANY SNAPSHOT
- TABLE 231 ABB: PRODUCTS/SERVICES/SOLUTIONS OFFERED
- TABLE 232 ABB: DEALS
- TABLE 233 ABB: OTHERS
- 12.1.2 EATON CORPORATION
- TABLE 234 EATON CORPORATION: COMPANY OVERVIEW
- FIGURE 58 EATON CORPORATION: COMPANY SNAPSHOT
- TABLE 235 EATON CORPORATION: PRODUCTS/SERVICES/SOLUTIONS OFFERED
- TABLE 236 EATON CORPORATION: PRODUCT LAUNCHES
- TABLE 237 EATON CORPORATION: DEALS
- TABLE 238 EATON CORPORATION: OTHERS
- 12.1.3 SCHNEIDER ELECTRIC
- TABLE 239 SCHNEIDER ELECTRIC: COMPANY OVERVIEW
- FIGURE 59 SCHNEIDER ELECTRIC: COMPANY SNAPSHOT
- TABLE 240 SCHNEIDER ELECTRIC: PRODUCTS/SERVICES/SOLUTIONS OFFERED
- TABLE 241 SCHNEIDER ELECTRIC: DEALS
- TABLE 242 SCHNEIDER ELECTRIC: OTHERS
- 12.1.4 SIEMENS
- TABLE 243 SIEMENS: COMPANY OVERVIEW
- FIGURE 60 SIEMENS: COMPANY SNAPSHOT
- TABLE 244 SIEMENS: PRODUCTS/SERVICES/SOLUTIONS OFFERED
- TABLE 245 SIEMENS: DEALS
- TABLE 246 SIEMENS: OTHERS
- 12.1.5 NOJA POWER SWITCHGEAR PTY LTD
- TABLE 247 NOJA POWER SWITCHGEAR PTY LTD: COMPANY OVERVIEW
- TABLE 248 NOJA POWER SWITCHGEAR PTY LTD: PRODUCTS/SERVICES/SOLUTIONS OFFERED
- TABLE 249 NOJA POWER SWITCHGEAR PTY LTD: PRODUCT LAUNCHES
- TABLE 250 NOJA POWER SWITCHGEAR PTY LTD: OTHERS
- 12.1.6 GENERAL ELECTRIC
- TABLE 251 GENERAL ELECTRIC: COMPANY OVERVIEW
- FIGURE 61 GENERAL ELECTRIC: COMPANY SNAPSHOT
- TABLE 252 GENERAL ELECTRIC: PRODUCTS/SERVICES/SOLUTIONS OFFERED
- TABLE 253 GENERAL ELECTRIC: OTHERS
- TABLE 254 GENERAL ELECTRIC: DEALS
- 12.1.7 HUBBELL
- TABLE 255 HUBBELL: COMPANY OVERVIEW
- FIGURE 62 HUBBELL: COMPANY SNAPSHOT
- TABLE 256 HUBBELL: PRODUCTS/SERVICES/SOLUTIONS OFFERED
- 12.1.8 S&C ELECTRIC COMPANY
- TABLE 257 S&C ELECTRIC COMPANY: COMPANY OVERVIEW
- TABLE 258 S&C ELECTRIC COMPANY: PRODUCTS/SERVICES/SOLUTIONS OFFERED
- TABLE 259 S&C ELECTRIC COMPANY: DEALS
- TABLE 260 S&C ELECTRIC COMPANY: OTHERS
- 12.1.9 TAVRIDA ELECTRIC
- TABLE 261 TAVRIDA ELECTRIC: COMPANY OVERVIEW
- TABLE 262 TAVRIDA ELECTRIC: PRODUCTS/SERVICES/SOLUTIONS OFFERED
- TABLE 263 TAVRIDA ELECTRIC: OTHERS
- 12.1.10 ENTEC ELECTRIC & ELECTRONIC
- TABLE 264 ENTEC ELECTRIC & ELECTRONIC: COMPANY OVERVIEW
- TABLE 265 ENTEC ELECTRIC & ELECTRONIC: PRODUCTS/SERVICES/SOLUTIONS OFFERED
- 12.1.11 G&W ELECTRIC
- TABLE 266 G&W ELECTRIC: COMPANY OVERVIEW
- TABLE 267 G&W ELECTRIC: PRODUCTS/SERVICES/SOLUTIONS OFFERED
- TABLE 268 G&W ELECTRIC: PRODUCT LAUNCHES
- TABLE 269 G&W ELECTRIC: DEALS
- 12.1.12 ARTECHE GROUP
- TABLE 270 ARTECHE GROUP: COMPANY OVERVIEW
- FIGURE 63 ARTECHE GROUP: COMPANY SNAPSHOT
- TABLE 271 ARTECHE GROUP: PRODUCTS/SERVICES/SOLUTIONS OFFERED
- TABLE 272 ARTECHE GROUP: DEALS
- 12.1.13 GHORIT ELECTRICAL CO., LTD.
- TABLE 273 GHORIT ELECTRICAL CO., LTD.: COMPANY OVERVIEW
- TABLE 274 GHORIT ELECTRICAL CO., LTD.: PRODUCTS/SERVICES/SOLUTIONS OFFERED
- 12.1.14 ILJIN ELECTRIC
- TABLE 275 ILJIN ELECTRIC: COMPANY OVERVIEW
- TABLE 276 ILJIN ELECTRIC: PRODUCTS/SERVICES/SOLUTIONS OFFERED
- 12.1.15 HUGHES POWER SYSTEM
- TABLE 277 HUGHES POWER SYSTEM: COMPANY OVERVIEW
- TABLE 278 HUGHES POWER SYSTEM: PRODUCTS/SERVICES/SOLUTIONS OFFERED
- 12.1.16 WASION HOLDINGS INTERNATIONAL
- TABLE 279 WASION HOLDINGS INTERNATIONAL: COMPANY OVERVIEW
- FIGURE 64 WASION HOLDINGS INTERNATIONAL: COMPANY SNAPSHOT
- TABLE 280 WASION HOLDINGS INTERNATIONAL: PRODUCTS/SERVICES/SOLUTIONS OFFERED
- TABLE 281 WASION HOLDINGS INTERNATIONAL: OTHERS
- 12.2 OTHER PLAYERS
- 12.2.1 BEIJING SOJO ELECTRIC CO., LTD.
- 12.2.2 NIKUM ENERGY CONTROL (INDIA) LTD.
- 12.2.3 SHINSUNG INDUSTRIAL ELECTRIC CO., LTD.
- 12.2.4 HUAYI ELECTRIC CO., LTD.
- 12.2.5 SCHWEITZER ENGINEERING LABORATORIES, INC.
- 12.2.6 ACTOM
- 12.2.7 GEYA ELECTRICAL EQUIPMENT SUPPLY
- 12.2.8 WENZHOU ROCKWILL ELECTRIC CO., LTD.
- 12.2.9 EFACEC
- 12.2.10 STELMEC
- *Details on Business Overview, Products Offered, Recent Developments, MnM View, Right to win, Strategic choices made, Weaknesses and competitive threats might not be captured in case of unlisted companies.
13 APPENDIX
- 13.1 INSIGHTS FROM INDUSTRY EXPERTS
- 13.2 DISCUSSION GUIDE
- 13.3 KNOWLEDGESTORE: MARKETSANDMARKETS' SUBSCRIPTION PORTAL
- 13.4 CUSTOMIZATION OPTIONS
- 13.5 RELATED REPORTS
- 13.6 AUTHOR DETAILS

