|
|
市場調査レポート
商品コード
1465228
プログレッシブキャビティポンプの世界市場:製品タイプ別、ステージタイプ別、定格出力別、ポンプ能力別、エンドユーザー別、地域別 - 2029年までの予測Progressing Cavity Pump Market by Power Rating (Up To 50 Hp, 51-150 Hp, Above 150 Hp), Pumping Capacity, End-User (Oil & Gas, Water & Wastewater Treatment, Food & Beverage, Food Waste, Biogas, Battery Recycling) and Region - Global Forecast to 2029 |
||||||
|
|||||||
カスタマイズ可能
|
|||||||

| プログレッシブキャビティポンプの世界市場:製品タイプ別、ステージタイプ別、定格出力別、ポンプ能力別、エンドユーザー別、地域別 - 2029年までの予測 |
|
出版日: 2024年04月15日
発行: MarketsandMarkets
ページ情報: 英文 265 Pages
納期: 即納可能
|

全表示
- 概要
- 目次
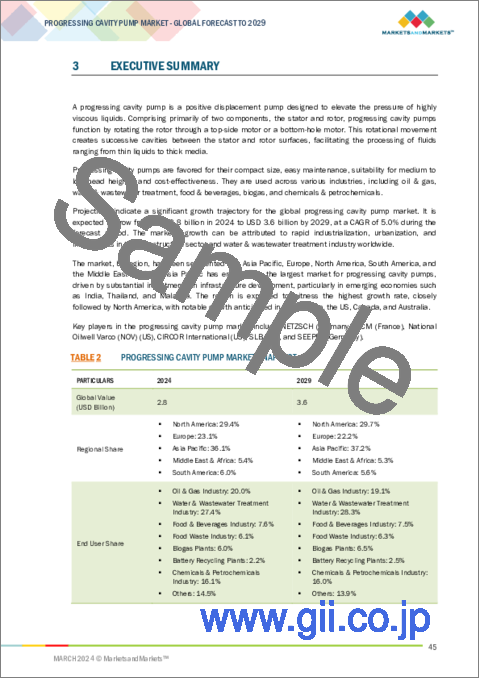
世界のプログレッシブキャビティポンプの市場規模は大幅な成長を遂げ、2029年には36億米ドルに達すると予測されています。
これは、2024年の推定値28億米ドルからの顕著な増加であり、2024年から2029年までの期間にわたって5.0%の安定した年間平均成長率(CAGR)での成長が見込まれています。同市場は、世界規模での拡大を後押しするいくつかの重要な要因によって、著しい成長を遂げています。主に、新興経済諸国における工業化と都市開発の急増が、進行中のインフラ・プロジェクトと相まって、石油・ガス、水・廃水処理、飲食品、化学、鉱業など、さまざまな分野における効率的な流体処理ソリューションの需要を促進しています。さらに、厳しい環境規制や職場の安全性重視の高まりが、優れた性能、信頼性、環境の持続可能性で知られるプログレッシブキャビティポンプのような高度なポンプ技術への投資を各産業に促しています。さらに、IoT対応監視システム、エネルギー効率の高い設計、スマートポンプソリューションなどの技術的進歩は、運転効率の向上、ダウンタイムの短縮、エネルギー消費の最小化によって市場の成長をさらに後押ししています。さらに、様々な産業におけるキャビティポンプの用途拡大と、再生可能エネルギーや医薬品などの新興分野での採用拡大が、市場拡大の新たな道を開いています。高品質で効率的な流体処理機器に対する世界の需要が高まる中、世界のプログレッシブキャビティポンプ市場は今後数年間、継続的な成長を遂げるとみられています。
| 調査範囲 | |
|---|---|
| 調査対象年 | 2020年~2029年 |
| 基準年 | 2023年 |
| 予測期間 | 2024年~2029年 |
| 検討単位 | 金額(10億米ドル) |
| セグメント別 | 製品タイプ別、ステージタイプ別、定格出力別、ポンプ能力別、エンドユーザー別、地域別 |
| 対象地域 | アジア太平洋、北米、欧州、中東・アフリカ、南米 |
エンドユーザー別では、プログレッシブキャビティポンプ市場における優位性を強調するいくつかの重要な要因によって、2024年から2029年にかけて最大の市場セグメントとして浮上すると予測されています。第一に、水不足と汚染に対する懸念が高まる中、水処理と衛生インフラの強化に世界の関心が高まっています。これは、さまざまな地域で上下水道処理施設への投資が増加することを意味し、その結果、プログレッシブキャビティポンプのような効率的な流体処理ソリューションへの需要が高まっています。さらに、水質と環境保護に関する厳しい規制基準が、水処理・廃水処理分野における高度なポンプ技術の必要性をさらに高めています。さらに、人口の拡大、急速な都市化、工業化は、廃水発生量の増加に寄与しており、環境への影響を緩和するための包括的な処理プロセスが必要となっています。プログレッシブキャビティポンプは、粘性流体や摩耗性流体を効率的に処理できるため、汚泥処理、薬液注入、ろ過など、水処理のさまざまな段階で重要な役割を果たしています。
アジア太平洋は、プログレッシブキャビティポンプ市場において最大かつ最速の成長地域となります。第一に、中国、インド、東南アジア諸国などの急速な工業化と都市化が、石油・ガス、上下水道処理、飲食品、化学、鉱業などの多様な分野で、効率的な流体処理ソリューションへの大きな需要を促進しています。この堅調な産業成長は、進行中のインフラ開発プロジェクトと相まって、同地域におけるプログレッシブキャビティポンプの採用拡大に大きく寄与しています。さらに、厳しい環境規制と職場の安全性への関心の高まりが、アジア太平洋の産業界に、優れた性能、信頼性、環境持続性を提供するプログレッシブキャビティポンプのような高度なポンプ技術への投資を促しています。
当レポートでは、世界のプログレッシブキャビティポンプ市場について調査し、製品タイプ別、ステージタイプ別、定格出力別、ポンプ能力別、エンドユーザー別、地域別動向、および市場に参入する企業のプロファイルなどをまとめています。
目次
第1章 イントロダクション
第2章 調査手法
第3章 エグゼクティブサマリー
第4章 重要考察
第5章 市場概要
- イントロダクション
- 市場力学
- ポーターのファイブフォース分析
- 価格分析
- サプライチェーン分析
- エコシステム/市場マップ
- 顧客のビジネスに影響を与える動向/混乱
- 技術分析
- 特許分析
- 貿易分析
- ケーススタディ分析
- 投資と資金調達のシナリオ
- 関税、基準、規制状況
- 主な利害関係者と購入基準
- 2024年~2025年の主な会議とイベント
第6章 プログレッシブキャビティポンプ市場、製品タイプ別
- イントロダクション
- 薬注ポンプ
- フランジポンプ
- ホッパーポンプ
- 食品グレード(EHEDG/3A認証)ポンプ
- 食品グレード(非認証)ポンプ
- 立形ポンプ
第7章 プログレッシブキャビティポンプ市場、ステージタイプ別
- イントロダクション
- シングルステージ(90 PSI)ポンプ
- 2段式(180 PSI)ポンプ
- 4段式(360PSI)ポンプ
- 8段式(720 PSI)ポンプ
第8章 プログレッシブキャビティポンプ市場、定格出力別
- イントロダクション
- 50馬力未満
- 51~150馬力
- 150馬力以上
第9章 プログレッシブキャビティポンプ市場、ポンプ能力別
- イントロダクション
- 500GPM未満
- 501~1,000GPM
- 1,000GPM以上
第10章 プログレッシブキャビティポンプ市場、エンドユーザー別
- イントロダクション
- 石油・ガス産業
- 水・廃水処理産業
- 食品・飲料業界
- 食品廃棄物産業
- バイオガスプラント
- バッテリーリサイクル工場
- 化学・石油化学産業
- その他
第11章 プログレッシブキャビティポンプ市場、地域別
- イントロダクション
- アジア太平洋
- 北米
- 欧州
- 中東・アフリカ
- 南米
第12章 競合情勢
- 概要
- 主要参入企業が採用した戦略
- 市場シェア分析、2022年
- 収益分析、2018-2022
- 2024年の評価と財務指標
- ブランド/製品比較
- 企業評価マトリックス:主要参入企業、2023年
- 企業評価マトリックス:スタートアップ/中小企業、2023年
- 競合シナリオと動向
第13章 企業プロファイル
- 主要参入企業
- NETZSCH
- PCM
- NOV INC.
- CIRCOR INTERNATIONAL
- SLB
- SEEPEX GMBH(INGERSOLL RAND INC.)
- CHAMPIONX
- SULZER
- XYLEM
- WILO SE
- VERDER LIQUIDS
- VARISCO
- DELTA PD PUMPS
- NOVA ROTORS
- ROTO PUMPS
- VOGELSANG
- INOXPA INDIA PVT. LTD.
- SHANGHAI GL ENVIRONMENTAL TECHNOLOGY CO., LTD.
- TAPFLO
- SPI PUMPS
- その他の企業
- ZHEJIANG YONJOU TECHNOLOGY CO., LTD
- FRISTUM PUMPS INDIA PVT. LTD.
- PSP PUMPS
- SPX FLOW, INC.
- GEA GERMANY GMBH
第14章 付録
The global market for progressing cavity pumps is poised for substantial growth, with a projected trajectory reaching USD 3.6 billion by the year 2029. This represents a noteworthy increase from the estimated value of USD 2.8 billion in 2024, reflecting a steady Compound Annual Growth Rate (CAGR) of 5.0% over the period spanning from 2024 to 2029. The global market for progressing cavity pumps is undergoing significant growth, driven by several key factors that are propelling its expansion on a worldwide scale. Primarily, the surge in industrialization and urban development in emerging economies, combined with ongoing infrastructure projects, is fueling demand for efficient fluid handling solutions across diverse sectors including oil and gas, water and wastewater treatment, food and beverage, chemicals, and mining. Additionally, stringent environmental regulations and increased focus on workplace safety are compelling industries to invest in advanced pumping technologies like progressing cavity pumps, renowned for their superior performance, reliability, and environmental sustainability. Furthermore, technological advancements such as IoT-enabled monitoring systems, energy-efficient designs, and smart pumping solutions are further bolstering market growth by enhancing operational efficiency, reducing downtime, and minimizing energy consumption. Moreover, the expanding applications of progressing cavity pumps across various industries, coupled with their increasing adoption in emerging sectors such as renewable energy and pharmaceuticals, are opening up new avenues for market expansion. With a rising global demand for high-quality, efficient fluid handling equipment, the global progressing cavity pump market is poised for continued growth in the forthcoming years.
| Scope of the Report | |
|---|---|
| Years Considered for the Study | 2020-2029 |
| Base Year | 2023 |
| Forecast Period | 2024-2029 |
| Units Considered | Value (USD Billion) |
| Segments | By Power Rating, By Pumping Capacity, By End-user Industry, By Product type, By Stage type |
| Regions covered | Asia Pacific, North America, Europe, Middle East and Africa, and South America |
"Up to 50 HP segment, by power rating, to be fastest growing market from 2024 to 2029."
The up to 50 HP segment, categorized by power rating, is poised to emerge as the fastest-growing market segment from 2024 to 2029 due to several key factors driving its accelerated expansion. Primarily, this segment caters to the needs of small to medium-sized operations across various industries, including manufacturing, agriculture, and small-scale processing facilities. The versatility and affordability of pumps within this power range make them highly attractive to a wide range of end-users, prompting increased adoption and driving market growth. Additionally, as industries continue to prioritize efficiency and cost-effectiveness in their operations, the demand for compact, lower horsepower pumps capable of handling a variety of fluids remains strong. Moreover, technological advancements such as energy-efficient designs and IoT-enabled monitoring systems are making pumps in this segment even more appealing by enhancing their performance, reliability, and operational efficiency. Furthermore, emerging trends such as the integration of smart technologies and automation further fuel the growth of this segment by streamlining processes and reducing maintenance requirements. With a growing emphasis on sustainable and eco-friendly solutions across industries, the up to 50 HP segment is expected to witness robust growth as businesses seek efficient fluid handling equipment that aligns with their environmental objectives and operational needs.
"Water & Wastewater Treatment Segment, by end-use industry, to be the largest market from 2024 to 2029."
The Water & Wastewater Treatment segment, classified by end-use industry, is anticipated to emerge as the largest market segment from 2024 to 2029, driven by several key factors that underscore its dominance in the progressing cavity pump market. Firstly, amidst growing concerns about water scarcity and pollution, there is an escalating global focus on enhancing water treatment and sanitation infrastructure. This translates to increased investments in water and wastewater treatment facilities across various regions, thereby driving demand for efficient fluid handling solutions such as progressing cavity pumps. Furthermore, stringent regulatory standards pertaining to water quality and environmental protection further amplify the need for advanced pumping technologies in the water and wastewater treatment sector. Moreover, the expanding population, rapid urbanization, and industrialization contribute to the rising volumes of wastewater generated, necessitating comprehensive treatment processes to mitigate environmental impact. Progressing cavity pumps play a vital role in various stages of water treatment, including sludge handling, chemical dosing, and filtration, owing to their ability to efficiently handle viscous and abrasive fluids.
"Asia Pacific to be largest and fastest growing region in progressing cavity pump market."
The Asia Pacific region is set to emerge as both the largest and fastest-growing region in the progressing cavity pump market, driven by a confluence of factors that underscore its prominence in the industry. Firstly, rapid industrialization and urbanization across countries like China, India, and Southeast Asian nations are fueling substantial demand for efficient fluid handling solutions across diverse sectors such as oil and gas, water and wastewater treatment, food and beverage, chemicals, and mining. This robust industrial growth, coupled with ongoing infrastructure development projects, contributes significantly to the increasing adoption of progressing cavity pumps in the region. Moreover, stringent environmental regulations and a growing focus on workplace safety are compelling industries in the Asia Pacific to invest in advanced pumping technologies like progressing cavity pumps, which offer superior performance, reliability, and environmental sustainability. Additionally, technological advancements such as IoT-enabled monitoring systems, energy-efficient designs, and smart pumping solutions are further accelerating market growth by enhancing operational efficiency, reducing downtime, and minimizing energy consumption.
Breakdown of Primaries:
Important qualitative and quantitative data were gathered and verified, as well as future market prospects, through in-depth interviews with subject-matter experts, C-level executives of major market players, industry consultants, and other experts. The following is how the main interviews were dispersed:
By Company Type: Tier 1-65%, Tier 2-24%, and Tier 3-11%
By Designation: C-Level-30%, D-Level-25%, and Others-45%
By Region: North America-27%, Europe-20%, Asia Pacific-33%, Middle East & Africa-12%, and South America-8%
Note: "Others" include sales managers, engineers, and regional managers
The tiers of the companies are defined based on their total revenue as of 2023: Tier 1: greater than USD 1 billion, Tier 2: USD 500 million-1 billion, and Tier 3: less than USD 500 million.
The market for progressing cavity pumps is primarily controlled by reputable international giants. In the industrial control transformer market, some of the leading companies are Caterpillar (USA), Wartsila (Finland), Rolls-Royce Holdings (UK), Cummins (USA), Volkswagen (Germany), Siemens Energy (Germany), Mitsubishi Heavy Industries (Japan) and a few more.
Research Coverage:
The report provides an exhaustive analysis of the progressing cavity pumps market, offering detailed definitions, descriptions, and forecasts based on various parameters. These parameters include power rating (Up to 50 hp, 51-150 hp, above 150 hp), Pumping Capacity (Up to 500 GPM, 501-1,000 GPM, Above 1,000 GPM), end-user industry (Oil & gas, water & wastewater treatment, food & beverage, chemicals & petrochemicals, others), product type (Dosing Pump, Flanged Pump, Hopper Pump, Food Grade (EHEDG/3A Certified), Food Grade (Non-Certified), Vertical Pump, Downhole Pump), stage type (Single-stage (90-PSI), Double stage (180-PSI), Four stage (360-PSI), Eight-stage (720-PSI)), and region (including Asia Pacific, North America, Europe, Middle East and Africa, and South America). Using both qualitative and quantitative approaches, the report explores key drivers, limitations, opportunities, and challenges within the progressing cavity pump market. Moreover, it provides insights into critical aspects such as competitive landscape analysis, assessment of market dynamics, value-based market estimates, and future trends shaping the progressing cavity pumps market.
Key Benefits of Buying the Report
The research has been carefully developed to meet the requirements of both new entrants into the cavity pump market and established industry players. It provides accurate revenue projections for each of the market's sub-segments as well as the overall market, making it an invaluable tool for stakeholders trying to get a full picture of the competitive environment. Stakeholders can use this data to create market strategies that work for their companies. Furthermore, the research serves as a means of communication for stakeholders to understand the current status of the market by offering vital insights into market drivers, constraints, opportunities for growth, and challenges. Through the integration of these data, stakeholders can make well-informed decisions and remain up to date with the constantly changing dynamics within the cavity pump business.
- Analysis of key drivers (Growing demand from the water & wastewater treatment sector, Rising investments in oil & gas exploration), restraints ( High initial investment costs, Availability of skilled labor, Fluctuating raw material prices ), opportunities ( Development of niche applications, Adoption of Industry 4.0 technologies), and challenges (Stricter environmental regulations, Counterfeiting and intellectual property concerns) influencing the growth of the progressing cavity pump market.
- Product Development/ Innovation: In the progressing cavity pump market, innovation is poised to address specific application challenges while prioritizing sustainability. One avenue for advancement involves the development of pumps with enhanced efficiency and reduced energy consumption, aligning with the increasing demand for eco-friendly solutions. Another key focus area lies in designing pumps with advanced materials to bolster corrosion resistance, thereby enabling the handling of harsh chemicals and fluids prevalent in industries such as oil & gas and chemical processing. Additionally, integrating smart features like sensors and remote monitoring capabilities presents opportunities for predictive maintenance and optimized performance, enhancing overall operational efficiency. Furthermore, exploring the incorporation of variable-speed drives offers the potential to adjust pump operation in real-time, minimizing energy waste and further contributing to sustainability efforts. By pursuing these avenues of innovation, the progressing cavity pump market can continue to meet evolving industry needs while advancing sustainability goals.
- Market Development: Market development offers significant growth potential for progressing cavity pump manufacturers. Unexploited segments within existing end-user industries, like the rise of food-grade certified pumps in the food & beverage sector, and emerging applications in industries like clean energy, present exciting opportunities. Additionally, geographic expansion into regions like Asia Pacific with their booming infrastructure development holds promise. By strategically targeting these new markets and tailoring product offerings to their specific needs, progressing cavity pump companies can unlock fresh revenue streams and solidify their market positions.
- Market Diversification: To mitigate risk and broaden its scope, the progressing cavity pump market can explore diversification strategies. One approach is to target untapped end-user sectors such as pharmaceuticals and biofuels, where precise and efficient pumping mechanisms are paramount. Additionally, there's potential in developing pumps tailored for emerging applications like geothermal energy extraction or carbon capture and storage, tapping into evolving technological demands. Moreover, expanding into burgeoning geographic regions with increasing infrastructure demands, especially in developing economies, presents opportunities for market growth. Another avenue involves prioritizing research and development efforts to design pumps capable of handling novel materials or operating in more challenging environments. By pursuing these diversification avenues, the progressing cavity pump market can enhance its resilience and extend its influence across various sectors and regions.
- Competitive Assessment: Conducting a competitive assessment for the progressing cavity pump market involves analyzing key factors such as market share, product offerings, technological advancements, distribution channels, and customer service strategies among industry players. Assessing the market landscape provides insights into the strengths, weaknesses, opportunities, and threats (SWOT) of each competitor, enabling companies to refine their own strategies accordingly. Factors such as innovation in pump design, efficiency improvements, sustainability initiatives, and expansion into new markets or applications are crucial for maintaining a competitive edge. Furthermore, understanding customer preferences, market trends, regulatory frameworks, and economic conditions allows companies to anticipate changes and adapt their strategies proactively. By continuously evaluating these aspects, businesses can position themselves effectively in the evolving competitive landscape of the progressing cavity pump market.
TABLE OF CONTENTS
1 INTRODUCTION
- 1.1 STUDY OBJECTIVES
- 1.2 MARKET DEFINITION
- 1.3 INCLUSIONS AND EXCLUSIONS
- 1.3.1 PROGRESSING CAVITY PUMP MARKET: INCLUSIONS AND EXCLUSIONS, BY POWER RATING
- 1.3.2 PROGRESSING CAVITY PUMP MARKET: INCLUSIONS AND EXCLUSIONS, BY PUMPING CAPACITY
- 1.3.3 PROGRESSING CAVITY PUMP MARKET: INCLUSIONS AND EXCLUSIONS, BY END USER
- 1.4 STUDY SCOPE
- 1.4.1 MARKETS COVERED
- 1.4.2 REGIONAL SCOPE
- 1.4.3 YEARS CONSIDERED
- 1.4.4 CURRENCY CONSIDERED
- 1.4.5 UNITS CONSIDERED
- 1.5 LIMITATIONS
- 1.6 STAKEHOLDERS
- 1.7 SUMMARY OF CHANGES
- 1.8 RECESSION IMPACT
2 RESEARCH METHODOLOGY
- 2.1 RESEARCH DATA
- FIGURE 1 PROGRESSING CAVITY PUMP MARKET: RESEARCH DESIGN
- 2.1.1 SECONDARY DATA
- 2.1.1.1 List of major secondary sources
- TABLE 1 LIST OF MAJOR SECONDARY SOURCES
- 2.1.1.2 Key data from secondary sources
- 2.1.2 PRIMARY DATA
- 2.1.2.1 Key data from primary sources
- 2.1.2.2 Breakdown of primaries
- FIGURE 2 BREAKDOWN OF PRIMARIES: BY COMPANY TYPE, DESIGNATION, AND REGION
- FIGURE 3 MAIN METRICS CONSIDERED TO ANALYZE AND ASSESS DEMAND FOR PROGRESSING CAVITY PUMPS
- 2.2 MARKET SIZE ESTIMATION
- 2.2.1 BOTTOM-UP APPROACH
- FIGURE 4 MARKET SIZE ESTIMATION METHODOLOGY: BOTTOM-UP APPROACH
- 2.2.2 TOP-DOWN APPROACH
- FIGURE 5 MARKET SIZE ESTIMATION METHODOLOGY: TOP-DOWN APPROACH
- 2.2.3 DEMAND-SIDE ANALYSIS
- 2.2.3.1 Regional analysis
- 2.2.3.2 Country-level analysis
- 2.2.3.3 Demand-side assumptions
- 2.2.3.4 Demand-side calculations
- 2.2.4 SUPPLY-SIDE ANALYSIS
- FIGURE 6 KEY STEPS CONSIDERED TO ASSESS SUPPLY OF PROGRESSING CAVITY PUMPS
- FIGURE 7 PROGRESSING CAVITY PUMP MARKET: SUPPLY-SIDE ANALYSIS
- 2.2.4.1 Supply-side calculations
- 2.2.4.2 Supply-side assumptions
- 2.3 FORECAST
- 2.4 RISK ASSESSMENT
- 2.5 RESEARCH LIMITATIONS
- 2.6 IMPACT OF RECESSION
- 2.7 MARKET BREAKDOWN AND DATA TRIANGULATION
- FIGURE 8 DATA TRIANGULATION
3 EXECUTIVE SUMMARY
- TABLE 2 PROGRESSING CAVITY PUMP MARKET SNAPSHOT
- FIGURE 9 ASIA PACIFIC TO HOLD LARGEST SHARE OF PROGRESSING CAVITY PUMP MARKET IN 2023
- FIGURE 10 UP TO 50 HP SEGMENT TO REGISTER HIGHEST CAGR IN PROGRESSING CAVITY PUMP MARKET DURING FORECAST PERIOD
- FIGURE 11 WATER & WASTEWATER TREATMENT INDUSTRY SEGMENT TO ACCOUNT FOR LARGEST SHARE OF PROGRESSING CAVITY PUMP MARKET IN 2029
- FIGURE 12 UP TO 500 GPM SEGMENT TO HOLD LARGEST SHARE OF PROGRESSING CAVITY PUMP MARKET IN 2029
4 PREMIUM INSIGHTS
- 4.1 ATTRACTIVE OPPORTUNITIES FOR PLAYERS IN PROGRESSING CAVITY PUMP MARKET
- FIGURE 13 RISING DEMAND FOR CLEAN AND EFFICIENT POWER GENERATION TECHNOLOGIES TO DRIVE MARKET
- 4.2 PROGRESSING CAVITY PUMP MARKET IN ASIA PACIFIC, BY END USER AND COUNTRY
- FIGURE 14 WATER & WASTEWATER TREATMENT INDUSTRY SEGMENT AND CHINA HELD LARGEST SHARES OF PROGRESSING CAVITY PUMP MARKET IN ASIA PACIFIC IN 2023
- 4.3 PROGRESSING CAVITY PUMP MARKET, BY POWER RATING
- FIGURE 15 UP TO 50 HP SEGMENT TO ACCOUNT FOR LARGEST MARKET SHARE IN 2029
- 4.4 PROGRESSING CAVITY PUMP MARKET, BY PUMPING CAPACITY
- FIGURE 16 UP TO 500 GPM SEGMENT TO DOMINATE MARKET IN 2029
- 4.5 PROGRESSING CAVITY PUMP MARKET, BY END USER
- FIGURE 17 WATER & WASTEWATER TREATMENT INDUSTRY SEGMENT TO HOLD LARGEST MARKET SHARE IN 2029
- 4.6 PROGRESSING CAVITY PUMP MARKET, BY REGION
- FIGURE 18 ASIA PACIFIC PROGRESSING CAVITY PUMP MARKET TO RECORD HIGHEST CAGR DURING FORECAST PERIOD
5 MARKET OVERVIEW
- 5.1 INTRODUCTION
- 5.2 MARKET DYNAMICS
- FIGURE 19 PROGRESSING CAVITY PUMP MARKET: DRIVERS, RESTRAINTS, OPPORTUNITIES, AND CHALLENGES
- 5.2.1 DRIVERS
- 5.2.1.1 Growing demand in water & wastewater treatment industry
- TABLE 3 PROPORTION OF SAFELY TREATED DOMESTIC WASTEWATER FLOWS (%)
- 5.2.1.2 Rising investments in oil & gas exploration
- FIGURE 20 GLOBAL OIL DEMAND, 2019-2028 (MB/D)
- 5.2.1.3 Advancements in material science and progressing cavity pump design
- FIGURE 21 GLOBAL ELECTRICITY INVESTMENT AND SHARE OF DIGITAL GRID INFRASTRUCTURE, 2015-2023 (USD BILLION)
- 5.2.2 RESTRAINTS
- 5.2.2.1 High initial investment and shortage of skilled labor
- 5.2.2.2 Fluctuating raw material prices
- 5.2.3 OPPORTUNITIES
- 5.2.3.1 Growing adoption of Industry 4.0 technologies
- 5.2.3.2 Rise in investments in food & beverages industry
- FIGURE 22 CAPITAL EXPENDITURE BY TOP 100 COMPANIES IN FOOD & BEVERAGES INDUSTRY, 2016-2021 (USD BILLION)
- 5.2.3.3 Rising demand for electric vehicles (EVs)
- 5.2.4 CHALLENGES
- 5.2.4.1 Preference for traditional centrifugal pumps over progressing cavity pumps in low-solid content wastewater applications
- 5.2.4.2 Counterfeiting and intellectual property concerns
- 5.3 PORTER'S FIVE FORCES ANALYSIS
- FIGURE 23 PROGRESSING CAVITY PUMP MARKET: PORTER'S FIVE FORCES ANALYSIS
- TABLE 4 PROGRESSING CAVITY PUMP MARKET: PORTER'S FIVE FORCES ANALYSIS
- 5.3.1 THREAT OF NEW ENTRANTS
- 5.3.2 BARGAINING POWER OF SUPPLIERS
- 5.3.3 BARGAINING POWER OF BUYERS
- 5.3.4 THREAT OF SUBSTITUTES
- 5.3.5 INTENSITY OF COMPETITIVE RIVALRY
- 5.4 PRICING ANALYSIS
- 5.4.1 INDICATIVE PRICING ANALYSIS OF PROGRESSING CAVITY PUMPS, BY PUMPING CAPACITY
- TABLE 5 INDICATIVE PRICING ANALYSIS OF PROGRESSING CAVITY PUMPS, BY PUMPING CAPACITY
- 5.4.2 AVERAGE SELLING PRICE (ASP) OF PROGRESSING CAVITY PUMPS, BY REGION
- TABLE 6 AVERAGE SELLING PRICE (ASP) OF PROGRESSING CAVITY PUMPS, BY REGION, 2020-2029 (USD/UNIT)
- FIGURE 24 AVERAGE SELLING PRICE (ASP) TREND OF PROGRESSING CAVITY PUMPS, BY REGION, 2020-2029 (USD/UNIT)
- 5.5 SUPPLY CHAIN ANALYSIS
- FIGURE 25 PROGRESSING CAVITY PUMP MARKET: SUPPLY CHAIN ANALYSIS
- 5.5.1 RAW MATERIAL PROVIDERS/SUPPLIERS
- 5.5.2 COMPONENT MANUFACTURERS
- 5.5.3 PROGRESSING CAVITY PUMP ASSEMBLERS/MANUFACTURERS
- 5.5.4 DISTRIBUTORS
- 5.5.5 END USERS
- 5.6 ECOSYSTEM/MARKET MAP
- FIGURE 26 PROGRESSING CAVITY PUMP MARKET: MARKET MAP
- TABLE 7 ROLES OF COMPANIES IN PROGRESSING CAVITY PUMP ECOSYSTEM
- 5.7 TRENDS/DISRUPTIONS IMPACTING CUSTOMERS' BUSINESSES
- FIGURE 27 TRENDS/DISRUPTIONS IMPACTING CUSTOMERS' BUSINESSES
- 5.8 TECHNOLOGY ANALYSIS
- 5.8.1 KEY TECHNOLOGY
- 5.8.1.1 Smart pump systems
- 5.8.2 COMPLEMENTARY TECHNOLOGY
- 5.8.2.1 Artificial intelligence (AI) and machine learning (ML)
- 5.8.1 KEY TECHNOLOGY
- 5.9 PATENT ANALYSIS
- FIGURE 28 PATENTS GRANTED AND APPLIED RELATED TO PROGRESSING CAVITY PUMPS, 2014-2023
- TABLE 8 PROGRESSING CAVITY PUMP MARKET: PATENT ANALYSIS, FEBRUARY 2020- FEBRUARY 2024
- 5.10 TRADE ANALYSIS
- 5.10.1 TRADE ANALYSIS RELATED TO ENGINES AND MOTORS
- 5.10.1.1 Import scenario
- TABLE 9 IMPORT DATA FOR HS CODE 841360-COMPLIANT PRODUCTS, BY COUNTRY, 2020-2022 (USD THOUSAND)
- FIGURE 29 IMPORT DATA FOR HS CODE 841360-COMPLIANT PRODUCTS, BY FIVE KEY COUNTRIES, 2020-2022 (USD THOUSAND)
- 5.10.1.2 Export scenario
- TABLE 10 EXPORT DATA FOR HS CODE 841360-COMPLIANT PRODUCTS, BY COUNTRY, 2020-2022 (USD THOUSAND)
- FIGURE 30 EXPORT DATA FOR HS CODE 841360-COMPLIANT PRODUCTS, BY FIVE KEY COUNTRIES, 2020-2022 (USD THOUSAND)
- 5.10.1 TRADE ANALYSIS RELATED TO ENGINES AND MOTORS
- 5.11 CASE STUDY ANALYSIS
- 5.11.1 NETZSCH PARTNERED WITH DXP TO ADDRESS CHALLENGES ASSOCIATED WITH TRADITIONAL CENTRIFUGAL PUMPS OF OIL PRODUCER
- 5.11.1.1 Problem statement
- 5.11.1.2 Solution
- 5.11.2 ALL-PUMPS UTILIZED NEXUS HELICAL ROTOR PUMPS TO TREAT MINING WATER
- 5.11.2.1 Problem statement
- 5.11.2.2 Solution
- 5.11.3 IRISH DISTILLERY COLLABORATED WITH SEEPEX TO INCREASE PRODUCTIVITY OF WHISKEY BY 50%
- 5.11.3.1 Problem statement
- 5.11.3.2 Solution
- 5.11.1 NETZSCH PARTNERED WITH DXP TO ADDRESS CHALLENGES ASSOCIATED WITH TRADITIONAL CENTRIFUGAL PUMPS OF OIL PRODUCER
- 5.12 INVESTMENT AND FUNDING SCENARIO
- FIGURE 31 INVESTMENT AND FUNDING SCENARIO
- 5.13 TARIFFS, STANDARDS, AND REGULATORY LANDSCAPE
- 5.13.1 TARIFF RELATED TO PROGRESSING CAVITY PUMPS
- TABLE 11 IMPORT TARIFF FOR HS 841360-COMPLIANT ROTARY POSITIVE DISPLACEMENT PUMPS IN 2022
- 5.13.2 REGULATORY BODIES, GOVERNMENT AGENCIES, AND OTHER ORGANIZATIONS
- TABLE 12 NORTH AMERICA: LIST OF REGULATORY BODIES, GOVERNMENT AGENCIES, AND OTHER ORGANIZATIONS
- TABLE 13 EUROPE: LIST OF REGULATORY BODIES, GOVERNMENT AGENCIES, AND OTHER ORGANIZATIONS
- TABLE 14 ASIA PACIFIC: LIST OF REGULATORY BODIES, GOVERNMENT AGENCIES, AND OTHER ORGANIZATIONS
- TABLE 15 ROW: LIST OF REGULATORY BODIES, GOVERNMENT AGENCIES, AND OTHER ORGANIZATIONS
- TABLE 16 GLOBAL: LIST OF REGULATORY BODIES, GOVERNMENT AGENCIES, AND OTHER ORGANIZATIONS
- 5.13.3 STANDARDS
- TABLE 17 STANDARDS RELATED TO POSITIVE DISPLACEMENT ROTARY PUMPS
- 5.14 KEY STAKEHOLDERS AND BUYING CRITERIA
- 5.14.1 KEY STAKEHOLDERS IN BUYING PROCESS
- FIGURE 32 INFLUENCE OF KEY STAKEHOLDERS ON BUYING PROCESS FOR TOP THREE END USERS
- TABLE 18 INFLUENCE OF KEY STAKEHOLDERS ON BUYING PROCESS FOR TOP THREE END USERS
- 5.14.2 BUYING CRITERIA
- FIGURE 33 KEY BUYING CRITERIA FOR TOP THREE END USERS
- TABLE 19 KEY BUYING CRITERIA FOR TOP THREE END USERS
- 5.15 KEY CONFERENCES AND EVENTS, 2024-2025
- TABLE 20 PROGRESSING CAVITY PUMP MARKET: KEY CONFERENCES AND EVENTS, 2024-2025
6 PROGRESSING CAVITY PUMP MARKET, BY PRODUCT TYPE
- 6.1 INTRODUCTION
- 6.2 DOSING PUMPS
- 6.2.1 GROWING USE TO PRECISELY DELIVER FLUIDS ACROSS INDUSTRIES TO FUEL MARKET GROWTH
- 6.3 FLANGED PUMPS
- 6.3.1 VERSATILE APPLICATIONS IN MINING, CONSTRUCTION, AND CHEMICALS INDUSTRIES TO DRIVE MARKET
- 6.4 HOPPER PUMPS
- 6.4.1 ONGOING ADVANCEMENTS TO ENHANCE PERFORMANCE AND RELIABILITY TO DRIVE MARKET
- 6.5 FOOD GRADE (EHEDG/3A-CERTIFIED) PUMPS
- 6.5.1 GROWING USE IN INDUSTRIAL FOOD PROCESSING FOR ENSURING HYGIENIC EXCELLENCE TO DRIVE MARKET
- 6.6 FOOD GRADE (NON-CERTIFIED) PUMPS
- 6.6.1 SAFE CONTACT WITH FOOD AND COMPLIANCE WITH INDUSTRY REGULATIONS TO DRIVE DEMAND
- 6.7 VERTICAL PUMPS
- 6.7.1 ABILITY TO EFFICIENTLY HANDLE FLUIDS WITH HIGH VISCOSITY OR ENTRAINED SOLIDS AND CORROSIVE OR ABRASIVE LIQUIDS TO DRIVE DEMAND
7 PROGRESSING CAVITY PUMP MARKET, BY STAGE TYPE
- 7.1 INTRODUCTION
- 7.2 SINGLE-STAGE (90-PSI) PUMPS
- 7.2.1 GROWING USE OF SINGLE-STAGE PROGRESSING CAVITY PUMPS FOR LOW-PRESSURE FLUID TRANSFER TO DRIVE MARKET
- 7.3 DOUBLE-STAGE (180-PSI) PUMPS
- 7.3.1 RISING ADOPTION OF DOUBLE-STAGE PROGRESSING CAVITY PUMPS FOR MODERATE-PRESSURE FLUID TRANSFER IN VARIOUS INDUSTRIES TO DRIVE MARKET
- 7.4 FOUR-STAGE (360-PSI) PUMPS
- 7.4.1 INCREASING DEMAND FOR FOUR-STAGE PROGRESSING CAVITY PUMPS IN VARIOUS SECTORS AND INDUSTRIES FOR CONVEYING AND DOSING APPLICATIONS TO DRIVE MARKET
- 7.5 EIGHT-STAGE (720-PSI) PUMPS
- 7.5.1 UNPARALLELED PRESSURE CAPABILITIES AND HIGH RELIABILITY IN HIGH-PRESSURE FLUID TRANSFER APPLICATIONS TO DRIVE DEMAND
8 PROGRESSING CAVITY PUMP MARKET, BY POWER RATING
- 8.1 INTRODUCTION
- FIGURE 34 PROGRESSING CAVITY PUMP MARKET, BY POWER RATING, 2023
- TABLE 21 PROGRESSING CAVITY PUMP MARKET, BY POWER RATING, 2020-2023 (USD MILLION)
- TABLE 22 PROGRESSING CAVITY PUMP MARKET, BY POWER RATING, 2024-2029 (USD MILLION)
- 8.2 UP TO 50 HP
- 8.2.1 GROWING USE OF UP TO 50 HP PROGRESSING CAVITY PUMPS IN TOUGH PUMPING APPLICATIONS TO DRIVE MARKET
- TABLE 23 UP TO 50 HP: PROGRESSING CAVITY PUMP MARKET, BY REGION, 2020-2023 (USD MILLION)
- TABLE 24 UP TO 50 HP: PROGRESSING CAVITY PUMP MARKET, BY REGION, 2024-2029 (USD MILLION)
- 8.3 51-150 HP
- 8.3.1 RISING EMPHASIS ON EFFICIENCY, RELIABILITY, AND COST-EFFECTIVENESS IN INDUSTRIAL PROCESSES TO DRIVE DEMAND
- TABLE 25 51-150 HP: PROGRESSING CAVITY PUMP MARKET, BY REGION, 2020-2023 (USD MILLION)
- TABLE 26 51-150 HP: PROGRESSING CAVITY PUMP MARKET, BY REGION, 2024-2029 (USD MILLION)
- 8.4 ABOVE 150 HP
- 8.4.1 INCREASING DEPLOYMENT OF ABOVE 150 HP PROGRESSING CAVITY PUMPS IN UNCONVENTIONAL OIL & GAS WELLS TO DRIVE MARKET
- TABLE 27 ABOVE 150 HP: PROGRESSING CAVITY PUMP MARKET, BY REGION, 2020-2023 (USD MILLION)
- TABLE 28 ABOVE 150 HP: PROGRESSING CAVITY PUMP MARKET, BY REGION, 2024-2029 (USD MILLION)
9 PROGRESSING CAVITY PUMP MARKET, BY PUMPING CAPACITY
- 9.1 INTRODUCTION
- FIGURE 35 PROGRESSING CAVITY PUMP MARKET, BY PUMPING CAPACITY, 2023
- TABLE 29 PROGRESSING CAVITY PUMP MARKET, BY PUMPING CAPACITY, 2020-2023 (USD MILLION)
- TABLE 30 PROGRESSING CAVITY PUMP MARKET, BY PUMPING CAPACITY, 2024-2029 (USD MILLION)
- 9.2 UP TO 500 GPM
- 9.2.1 INCREASING DEMAND FOR WATER & WASTEWATER TREATMENT SOLUTIONS AND INDUSTRIALIZATION IN EMERGING ECONOMIES TO DRIVE DEMAND
- TABLE 31 UP TO 500 GPM: PROGRESSING CAVITY PUMP MARKET, BY REGION, 2020-2023 (USD MILLION)
- TABLE 32 UP TO 500 GPM: PROGRESSING CAVITY PUMP MARKET, BY REGION, 2024-2029 (USD MILLION)
- 9.3 501-1,000 GPM
- 9.3.1 VERSATILITY, IMPROVED EFFICIENCY, AND REDUCED MAINTENANCE REQUIREMENTS TO DRIVE DEMAND
- TABLE 33 501-1,000 GPM: PROGRESSING CAVITY PUMP MARKET, BY REGION, 2020-2023 (USD MILLION)
- TABLE 34 501-1,000 GPM: PROGRESSING CAVITY PUMP MARKET, BY REGION, 2024-2029 (USD MILLION)
- 9.4 ABOVE 1,000 GPM
- 9.4.1 INCREASING DEMAND FOR WATER AND ENERGY AND INFRASTRUCTURE DEVELOPMENT PROJECTS TO FUEL DEMAND
- TABLE 35 ABOVE 1,000 GPM: PROGRESSING CAVITY PUMP MARKET, BY REGION, 2020-2023 (USD MILLION)
- TABLE 36 ABOVE 1,000 GPM: PROGRESSING CAVITY PUMP MARKET, BY REGION, 2024-2029 (USD MILLION)
10 PROGRESSING CAVITY PUMP MARKET, BY END USER
- 10.1 INTRODUCTION
- FIGURE 36 PROGRESSING CAVITY PUMP MARKET, BY END USER, 2023
- TABLE 37 PROGRESSING CAVITY PUMP MARKET, BY END USER, 2020-2023 (USD MILLION)
- TABLE 38 PROGRESSING CAVITY PUMP MARKET, BY END USER, 2024-2029 (USD MILLION)
- 10.2 OIL & GAS INDUSTRY
- 10.2.1 INCREASING OIL & GAS EXPLORATION AND PRODUCTION ACTIVITIES, PARTICULARLY IN UNCONVENTIONAL RESERVES, TO DRIVE DEMAND
- TABLE 39 OIL & GAS INDUSTRY: PROGRESSING CAVITY PUMP MARKET, BY REGION, 2020-2023 (USD MILLION)
- TABLE 40 OIL & GAS INDUSTRY: PROGRESSING CAVITY PUMP MARKET, BY REGION, 2024-2029 (USD MILLION)
- 10.3 WATER & WASTEWATER TREATMENT INDUSTRY
- 10.3.1 IMPLEMENTATION OF STRINGENT ENVIRONMENTAL REGULATIONS MANDATING WASTEWATER TREATMENT AND DISCHARGE STANDARDS TO DRIVE DEMAND
- TABLE 41 WATER & WASTEWATER TREATMENT INDUSTRY: PROGRESSING CAVITY PUMP MARKET, BY REGION, 2020-2023 (USD MILLION)
- TABLE 42 WATER & WASTEWATER TREATMENT INDUSTRY: PROGRESSING CAVITY PUMP MARKET, BY REGION, 2024-2029 (USD MILLION)
- 10.4 FOOD & BEVERAGES INDUSTRY
- 10.4.1 INCREASING TREND OF AUTOMATION AND PROCESS OPTIMIZATION IN FOOD PROCESSING PLANTS TO FUEL ADOPTION
- TABLE 43 FOOD & BEVERAGES INDUSTRY: PROGRESSING CAVITY PUMP MARKET, BY REGION, 2020-2023 (USD MILLION)
- TABLE 44 FOOD & BEVERAGES INDUSTRY: PROGRESSING CAVITY PUMP MARKET, BY REGION, 2024-2029 (USD MILLION)
- 10.5 FOOD WASTE INDUSTRY
- 10.5.1 ABILITY TO EFFICIENTLY TRANSFER AND PROCESS ORGANIC WASTE MATERIALS TO FUEL DEMAND
- TABLE 45 FOOD WASTE INDUSTRY: PROGRESSING CAVITY PUMP MARKET, BY REGION, 2020-2023 (USD MILLION)
- TABLE 46 FOOD WASTE INDUSTRY: PROGRESSING CAVITY PUMP MARKET, BY REGION, 2024-2029 (USD MILLION)
- 10.6 BIOGAS PLANTS
- 10.6.1 INCREASING FOCUS ON RENEWABLE ENERGY SOURCES AND GOVERNMENT-LED INCENTIVES FOR BIOGAS PRODUCTION TO DRIVE DEMAND
- TABLE 47 BIOGAS PLANTS: PROGRESSING CAVITY PUMP MARKET, BY REGION, 2020-2023 (USD MILLION)
- TABLE 48 BIOGAS PLANTS: PROGRESSING CAVITY PUMP MARKET, BY REGION, 2024-2029 (USD MILLION)
- 10.7 BATTERY RECYCLING PLANTS
- 10.7.1 ENHANCEMENT OF EFFICIENCY AND EFFECTIVENESS OF BATTERY RECYCLING OPERATIONS TO DRIVE DEMAND
- TABLE 49 BATTERY RECYCLING PLANTS: PROGRESSING CAVITY PUMP MARKET, BY REGION, 2020-2023 (USD MILLION)
- TABLE 50 BATTERY RECYCLING PLANTS: PROGRESSING CAVITY PUMP MARKET, BY REGION, 2024-2029 (USD MILLION)
- 10.8 CHEMICALS & PETROCHEMICALS INDUSTRY
- 10.8.1 GROWTH OF CHEMICAL MANUFACTURING, EXPANSION OF PETROCHEMICAL FACILITIES, AND INCREASING DEMAND FOR SPECIALTY CHEMICALS TO DRIVE DEMAND
- TABLE 51 CHEMICALS & PETROCHEMICALS INDUSTRY: PROGRESSING CAVITY PUMP MARKET, BY REGION, 2020-2023 (USD MILLION)
- TABLE 52 CHEMICALS & PETROCHEMICALS INDUSTRY: PROGRESSING CAVITY PUMP MARKET, BY REGION, 2024-2029 (USD MILLION)
- 10.9 OTHERS
- TABLE 53 OTHERS: PROGRESSING CAVITY PUMP MARKET, BY REGION, 2020-2023 (USD MILLION)
- TABLE 54 OTHERS: PROGRESSING CAVITY PUMP MARKET, BY REGION, 2024-2029 (USD MILLION)
11 PROGRESSING CAVITY PUMP MARKET, BY REGION
- 11.1 INTRODUCTION
- FIGURE 37 ASIA PACIFIC PROGRESSING CAVITY PUMP MARKET TO REGISTER HIGHEST CAGR DURING FORECAST PERIOD
- FIGURE 38 ASIA PACIFIC HELD LARGEST SHARE OF PROGRESSING CAVITY PUMP MARKET IN 2023
- TABLE 55 PROGRESSING CAVITY PUMP MARKET, BY REGION, 2020-2023 (USD MILLION)
- TABLE 56 PROGRESSING CAVITY PUMP MARKET, BY REGION, 2024-2029 (USD MILLION)
- TABLE 57 PROGRESSING CAVITY PUMP MARKET, BY REGION, 2020-2023 (THOUSAND UNITS)
- TABLE 58 PROGRESSING CAVITY PUMP MARKET, BY REGION, 2024-2029 (THOUSAND UNITS)
- 11.2 ASIA PACIFIC
- 11.2.1 IMPACT OF RECESSION ON PROGRESSING CAVITY PUMP MARKET IN ASIA PACIFIC
- FIGURE 39 ASIA PACIFIC: PROGRESSING CAVITY PUMP MARKET SNAPSHOT
- 11.2.2 BY POWER RATING
- TABLE 59 ASIA PACIFIC: PROGRESSING CAVITY PUMP MARKET, BY POWER RATING, 2020-2023 (USD MILLION)
- TABLE 60 ASIA PACIFIC: PROGRESSING CAVITY PUMP MARKET, BY POWER RATING, 2024-2029 (USD MILLION)
- 11.2.3 BY PUMPING CAPACITY
- TABLE 61 ASIA PACIFIC: PROGRESSING CAVITY PUMP MARKET, BY PUMPING CAPACITY, 2020-2023 (USD MILLION)
- TABLE 62 ASIA PACIFIC: PROGRESSING CAVITY PUMP MARKET, BY PUMPING CAPACITY, 2024-2029 (USD MILLION)
- 11.2.4 BY END USER
- TABLE 63 ASIA PACIFIC: PROGRESSING CAVITY PUMP MARKET, BY END USER, 2020-2023 (USD MILLION)
- TABLE 64 ASIA PACIFIC: PROGRESSING CAVITY PUMP MARKET, BY END USER, 2024-2029 (USD MILLION)
- 11.2.5 BY COUNTRY
- TABLE 65 ASIA PACIFIC: PROGRESSING CAVITY PUMP MARKET, BY COUNTRY, 2020-2023 (USD MILLION)
- TABLE 66 ASIA PACIFIC: PROGRESSING CAVITY PUMP MARKET, BY COUNTRY, 2024-2029 (USD MILLION)
- 11.2.5.1 China
- 11.2.5.1.1 Rapid industrialization, infrastructure development, and environmental sustainability initiatives to drive market
- 11.2.5.1 China
- TABLE 67 CHINA: PROGRESSING CAVITY PUMP MARKET, BY POWER RATING, 2020-2023 (USD MILLION)
- TABLE 68 CHINA: PROGRESSING CAVITY PUMP MARKET, BY POWER RATING, 2024-2029 (USD MILLION)
- 11.2.5.2 India
- 11.2.5.2.1 Increasing applications in oil & gas, water & wastewater treatment, food & beverages, and chemicals & petrochemicals industries to drive market
- 11.2.5.2 India
- TABLE 69 INDIA: PROGRESSING CAVITY PUMP MARKET, BY POWER RATING, 2020-2023 (USD MILLION)
- TABLE 70 INDIA: PROGRESSING CAVITY PUMP MARKET, BY POWER RATING, 2024-2029 (USD MILLION)
- 11.2.5.3 Australia
- 11.2.5.3.1 Ongoing industrial developments, infrastructure investments, and increasing demand for efficient fluid handling solutions to drive market
- 11.2.5.3 Australia
- TABLE 71 AUSTRALIA: PROGRESSING CAVITY PUMP MARKET, BY POWER RATING, 2020-2023 (USD MILLION)
- TABLE 72 AUSTRALIA: PROGRESSING CAVITY PUMP MARKET, BY POWER RATING, 2024-2029 (USD MILLION)
- 11.2.5.4 Japan
- 11.2.5.4.1 Efficiency, reliability, and sustainability features of progressing cavity pumps to drive demand
- 11.2.5.4 Japan
- TABLE 73 JAPAN: PROGRESSING CAVITY PUMP MARKET, BY POWER RATING , 2020-2023 (USD MILLION)
- TABLE 74 JAPAN: PROGRESSING CAVITY PUMP MARKET, BY POWER RATING , 2024-2029 (USD MILLION)
- 11.2.5.5 Rest of Asia Pacific
- TABLE 75 REST OF ASIA PACIFIC: PROGRESSING CAVITY PUMP MARKET, BY POWER RATING, 2020-2023 (USD MILLION)
- TABLE 76 REST OF ASIA PACIFIC: PROGRESSING CAVITY PUMP MARKET, BY POWER RATING, 2024-2029 (USD MILLION)
- 11.3 NORTH AMERICA
- 11.3.1 IMPACT OF RECESSION ON PROGRESSING CAVITY PUMP MARKET IN NORTH AMERICA
- FIGURE 40 NORTH AMERICA: PROGRESSING CAVITY PUMP MARKET SNAPSHOT
- 11.3.2 BY POWER RATING
- TABLE 77 NORTH AMERICA: PROGRESSING CAVITY PUMP MARKET, BY POWER RATING, 2020-2023 (USD MILLION)
- TABLE 78 NORTH AMERICA: PROGRESSING CAVITY PUMP MARKET, BY POWER RATING, 2024-2029 (USD MILLION)
- 11.3.3 BY PUMPING CAPACITY
- TABLE 79 NORTH AMERICA: PROGRESSING CAVITY PUMP MARKET, BY PUMPING CAPACITY, 2020-2023 (USD MILLION)
- TABLE 80 NORTH AMERICA: PROGRESSING CAVITY PUMP MARKET, BY PUMPING CAPACITY, 2024-2029 (USD MILLION)
- 11.3.4 BY END USER
- TABLE 81 NORTH AMERICA: PROGRESSING CAVITY PUMP MARKET, BY END USER, 2020-2023 (USD MILLION)
- TABLE 82 NORTH AMERICA: PROGRESSING CAVITY PUMP MARKET, BY END USER, 2024-2029 (USD MILLION)
- 11.3.5 BY COUNTRY
- TABLE 83 NORTH AMERICA: PROGRESSING CAVITY PUMP MARKET, BY COUNTRY, 2020-2023 (USD MILLION)
- TABLE 84 NORTH AMERICA: PROGRESSING CAVITY PUMP MARKET, BY COUNTRY, 2024-2029 (USD MILLION)
- 11.3.5.1 US
- 11.3.5.1.1 Increasing focus on sustainability and resource management to drive demand
- 11.3.5.1 US
- TABLE 85 US: PROGRESSING CAVITY PUMP MARKET, BY POWER RATING, 2020-2023 (USD MILLION)
- TABLE 86 US: PROGRESSING CAVITY PUMP MARKET SIZE, BY POWER RATING, 2024-2029 (USD MILLION)
- 11.3.5.2 Canada
- 11.3.5.2.1 Large presence of oil sands and shale gas reserves and increasing exploration activities to drive demand
- 11.3.5.2 Canada
- TABLE 87 CANADA: PROGRESSING CAVITY PUMP MARKET, BY POWER RATING, 2020-2023 (USD MILLION)
- TABLE 88 CANADA: PROGRESSING CAVITY PUMP MARKET SIZE, BY POWER RATING, 2024-2029 (USD MILLION)
- 11.3.5.3 Mexico
- 11.3.5.3.1 Booming industrial sector and infrastructure development to drive demand
- 11.3.5.3 Mexico
- TABLE 89 MEXICO: PROGRESSING CAVITY PUMP MARKET, BY POWER RATING, 2020-2023 (USD MILLION)
- TABLE 90 MEXICO: PROGRESSING CAVITY PUMP MARKET SIZE, BY POWER RATING, 2024-2029 (USD MILLION)
- 11.4 EUROPE
- 11.4.1 IMPACT OF RECESSION ON PROGRESSING CAVITY PUMP MARKET IN EUROPE
- 11.4.2 BY POWER RATING
- TABLE 91 EUROPE: PROGRESSING CAVITY PUMP MARKET, BY POWER RATING, 2020-2023 (USD MILLION)
- TABLE 92 EUROPE: PROGRESSING CAVITY PUMP MARKET, BY POWER RATING, 2024-2029 (USD MILLION)
- 11.4.3 BY PUMPING CAPACITY
- TABLE 93 EUROPE: PROGRESSING CAVITY PUMP MARKET, BY PUMPING CAPACITY, 2020-2023 (USD MILLION)
- TABLE 94 EUROPE: PROGRESSING CAVITY PUMP MARKET, BY PUMPING CAPACITY, 2024-2029 (USD MILLION)
- 11.4.4 BY END USER
- TABLE 95 EUROPE: PROGRESSING CAVITY PUMP MARKET, BY END USER, 2020-2023 (USD MILLION)
- TABLE 96 EUROPE: PROGRESSING CAVITY PUMP MARKET, BY END USER, 2024-2029 (USD MILLION)
- 11.4.5 BY COUNTRY
- TABLE 97 EUROPE: PROGRESSING CAVITY PUMP MARKET, BY COUNTRY, 2020-2023 (USD MILLION)
- TABLE 98 EUROPE: PROGRESSING CAVITY PUMP MARKET, BY COUNTRY, 2024-2029 (USD MILLION)
- 11.4.5.1 UK
- 11.4.5.1.1 Rising offshore exploration and production activities to drive demand
- 11.4.5.1 UK
- TABLE 99 UK: PROGRESSING CAVITY PUMP MARKET, BY POWER RATING, 2020-2023 (USD MILLION)
- TABLE 100 UK: PROGRESSING CAVITY PUMP MARKET, BY POWER RATING, 2024-2029 (USD MILLION)
- 11.4.5.2 France
- 11.4.5.2.1 Expanding industrial, manufacturing, renewable energy, and food processing sectors to drive market
- 11.4.5.2 France
- TABLE 101 FRANCE: PROGRESSING CAVITY PUMP MARKET, BY POWER RATING, 2020-2023 (USD MILLION)
- TABLE 102 FRANCE: PROGRESSING CAVITY PUMP MARKET, BY POWER RATING, 2024-2029 (USD MILLION)
- 11.4.5.3 Germany
- 11.4.5.3.1 Diverse industrial base, encompassing automotive, chemical, food processing, and renewable energy industries, to fuel demand
- 11.4.5.3 Germany
- TABLE 103 GERMANY: PROGRESSING CAVITY PUMP MARKET, BY POWER RATING, 2020-2023 (USD MILLION)
- TABLE 104 GERMANY: PROGRESSING CAVITY PUMP MARKET, BY POWER RATING, 2024-2029 (USD MILLION)
- 11.4.5.4 Russia
- 11.4.5.4.1 Industrial development plans and strategic initiatives related to renewable energy initiatives to drive market
- 11.4.5.4 Russia
- TABLE 105 RUSSIA: PROGRESSING CAVITY PUMP MARKET, BY POWER RATING, 2020-2023 (USD MILLION)
- TABLE 106 RUSSIA: PROGRESSING CAVITY PUMP MARKET, BY POWER RATING, 2024-2029 (USD MILLION)
- 11.4.5.5 Italy
- 11.4.5.5.1 Rising demand for reliable and efficient fluid-handling solutions to drive demand
- 11.4.5.5 Italy
- TABLE 107 ITALY: PROGRESSING CAVITY PUMP MARKET, BY POWER RATING, 2020-2023 (USD MILLION)
- TABLE 108 ITALY: PROGRESSING CAVITY PUMP MARKET, BY POWER RATING, 2024-2029 (USD MILLION)
- 11.4.6 REST OF EUROPE
- TABLE 109 REST OF EUROPE: PROGRESSING CAVITY PUMP MARKET, BY POWER RATING, 2020-2023 (USD MILLION)
- TABLE 110 REST OF EUROPE: PROGRESSING CAVITY PUMP MARKET, BY POWER RATING, 2024-2029 (USD MILLION)
- 11.5 MIDDLE EAST & AFRICA
- 11.5.1 IMPACT OF RECESSION ON PROGRESSING CAVITY PUMP MARKET IN MIDDLE EAST & AFRICA
- 11.5.2 BY POWER RATING
- TABLE 111 MIDDLE EAST & AFRICA: PROGRESSING CAVITY PUMP MARKET, BY POWER RATING, 2020-2023 (USD MILLION)
- TABLE 112 MIDDLE EAST & AFRICA: PROGRESSING CAVITY PUMP MARKET, BY POWER RATING, 2024-2029 (USD MILLION)
- 11.5.3 BY PUMPING CAPACITY
- TABLE 113 MIDDLE EAST & AFRICA: PROGRESSING CAVITY PUMP MARKET, BY PUMPING CAPACITY, 2020-2023 (USD MILLION)
- TABLE 114 MIDDLE EAST & AFRICA: PROGRESSING CAVITY PUMP MARKET, BY PUMPING CAPACITY, 2024-2029 (USD MILLION)
- 11.5.4 BY END USER
- TABLE 115 MIDDLE EAST & AFRICA: PROGRESSING CAVITY PUMP MARKET, BY END USER, 2020-2023 (USD MILLION)
- TABLE 116 MIDDLE EAST & AFRICA: PROGRESSING CAVITY PUMP MARKET, BY END USER, 2024-2029 (USD MILLION)
- 11.5.5 BY COUNTRY
- TABLE 117 MIDDLE EAST & AFRICA: PROGRESSING CAVITY PUMP MARKET, BY COUNTRY, 2020-2023 (USD MILLION)
- TABLE 118 MIDDLE EAST & AFRICA: PROGRESSING CAVITY PUMP MARKET, BY COUNTRY, 2024-2029 (USD MILLION)
- TABLE 119 GCC: PROGRESSING CAVITY PUMP MARKET, BY COUNTRY, 2020-2023 (USD MILLION)
- TABLE 120 GCC: PROGRESSING CAVITY PUMP MARKET, BY COUNTRY, 2024-2029 (USD MILLION)
- 11.5.5.1 GCC
- TABLE 121 GCC: PROGRESSING CAVITY PUMP MARKET, BY POWER RATING, 2020-2023 (USD MILLION)
- TABLE 122 GCC: PROGRESSING CAVITY PUMP MARKET, BY POWER RATING, 2024-2029 (USD MILLION)
- 11.5.5.1.1 Saudi Arabia
- 11.5.5.1.1.1 Increased industrial activities, ambitious infrastructure projects, and growing emphasis on sustainability to drive market
- 11.5.5.1.1 Saudi Arabia
- TABLE 123 SAUDI ARABIA: PROGRESSING CAVITY PUMP MARKET, BY POWER RATING, 2020-2023 (USD MILLION)
- TABLE 124 SAUDI ARABIA: PROGRESSING CAVITY PUMP MARKET, BY POWER RATING, 2024-2029 (USD MILLION)
- 11.5.5.1.2 UAE
- 11.5.5.1.2.1 Robust demand across key industries such as oil & gas, construction, and logistics to drive market
- 11.5.5.1.2 UAE
- TABLE 125 UAE: PROGRESSING CAVITY PUMP MARKET, BY POWER RATING, 2020-2023 (USD MILLION)
- TABLE 126 UAE: PROGRESSING CAVITY PUMP MARKET, BY POWER RATING, 2024-2029 (USD MILLION)
- 11.5.5.1.3 Rest of GCC
- TABLE 127 REST OF GCC: PROGRESSING CAVITY PUMP MARKET, BY POWER RATING, 2020-2023 (USD MILLION)
- TABLE 128 REST OF GCC: PROGRESSING CAVITY PUMP MARKET, BY POWER RATING, 2024-2029 (USD MILLION)
- 11.5.5.2 South Africa
- 11.5.5.2.1 Rising exploration and production activities in oil & gas industry to create growth opportunities for market players
- 11.5.5.2 South Africa
- TABLE 129 SOUTH AFRICA: PROGRESSING CAVITY PUMP MARKET, BY POWER RATING, 2020-2023 (USD MILLION)
- TABLE 130 SOUTH AFRICA: PROGRESSING CAVITY PUMP MARKET, BY POWER RATING, 2024-2029 (USD MILLION)
- 11.5.5.3 Rest of Middle East & Africa
- TABLE 131 REST OF MIDDLE EAST & AFRICA: PROGRESSING CAVITY PUMP MARKET, BY POWER RATING, 2020-2023 (USD MILLION)
- TABLE 132 REST OF MIDDLE EAST & AFRICA: PROGRESSING CAVITY PUMP MARKET, BY POWER RATING, 2024-2029 (USD MILLION)
- 11.6 SOUTH AMERICA
- 11.6.1 IMPACT OF RECESSION ON PROGRESSING CAVITY PUMP MARKET IN SOUTH AMERICA
- 11.6.2 BY POWER RATING
- TABLE 133 SOUTH AMERICA: PROGRESSING CAVITY PUMP MARKET, BY POWER RATING, 2020-2023 (USD MILLION)
- TABLE 134 SOUTH AMERICA: PROGRESSING CAVITY PUMP MARKET, BY POWER RATING, 2024-2029 (USD MILLION)
- 11.6.3 BY PUMPING CAPACITY
- TABLE 135 SOUTH AMERICA: PROGRESSING CAVITY PUMP MARKET, BY PUMPING CAPACITY, 2020-2023 (USD MILLION)
- TABLE 136 SOUTH AMERICA: PROGRESSING CAVITY PUMP MARKET, BY PUMPING CAPACITY, 2024-2029 (USD MILLION)
- 11.6.4 BY END USER
- TABLE 137 SOUTH AMERICA: PROGRESSING CAVITY PUMP MARKET, BY END USER, 2020-2023 (USD MILLION)
- TABLE 138 SOUTH AMERICA: PROGRESSING CAVITY PUMP MARKET, BY END USER, 2024-2029 (USD MILLION)
- 11.6.5 BY COUNTRY
- TABLE 139 SOUTH AMERICA: PROGRESSING CAVITY PUMP MARKET, BY COUNTRY, 2020-2023 (USD MILLION)
- TABLE 140 SOUTH AMERICA: PROGRESSING CAVITY PUMP MARKET, BY COUNTRY, 2024-2029 (USD MILLION)
- 11.6.5.1 Brazil
- 11.6.5.1.1 Presence of vast offshore oil reserves and expanding renewable energy industry to drive demand
- 11.6.5.1 Brazil
- TABLE 141 BRAZIL: PROGRESSING CAVITY PUMP MARKET, BY POWER RATING, 2020-2023 (USD MILLION)
- TABLE 142 BRAZIL: PROGRESSING CAVITY PUMP MARKET, BY POWER RATING, 2024-2029 (USD MILLION)
- 11.6.5.2 Argentina
- 11.6.5.2.1 Presence of extensive unconventional hydrocarbon reserves to drive demand
- 11.6.5.2 Argentina
- TABLE 143 ARGENTINA: PROGRESSING CAVITY PUMP MARKET, BY POWER RATING, 2020-2023 (USD MILLION)
- TABLE 144 ARGENTINA: PROGRESSING CAVITY PUMP MARKET, BY POWER RATING, 2024-2029 (USD MILLION)
- 11.6.5.3 Chile
- 11.6.5.3.1 High demand in mining, agriculture, and renewable energy industries to drive market
- 11.6.5.3 Chile
- TABLE 145 CHILE: PROGRESSING CAVITY PUMP MARKET, BY POWER RATING, 2020-2023 (USD MILLION)
- TABLE 146 CHILE: PROGRESSING CAVITY PUMP MARKET, BY POWER RATING, 2024-2029 (USD MILLION)
- 11.6.5.4 Rest of South America
- TABLE 147 REST OF SOUTH AMERICA: PROGRESSING CAVITY PUMP MARKET, BY POWER RATING, 2020-2023 (USD MILLION)
- TABLE 148 REST OF SOUTH AMERICA: PROGRESSING CAVITY PUMP MARKET, BY POWER RATING, 2024-2029 (USD MILLION)
12 COMPETITIVE LANDSCAPE
- 12.1 OVERVIEW
- 12.2 STRATEGIES ADOPTED BY KEY PLAYERS
- TABLE 149 PROGRESSING CAVITY PUMP MARKET: OVERVIEW OF KEY STRATEGIES DEPLOYED BY TOP FIVE PLAYERS, JANUARY 2019-JUNE 2022
- 12.3 MARKET SHARE ANALYSIS, 2022
- TABLE 150 PROGRESSING CAVITY PUMP MARKET: DEGREE OF COMPETITION, 2022
- FIGURE 41 PROGRESSING CAVITY PUMP MARKET SHARE ANALYSIS, 2022
- 12.4 REVENUE ANALYSIS, 2018-2022
- FIGURE 42 PROGRESSING CAVITY PUMP MARKET: REVENUE ANALYSIS OF THREE KEY PLAYERS, 2018-2022
- 12.5 VALUATION AND FINANCIAL METRICS, 2024
- FIGURE 43 EV/EBITDA OF KEY VENDORS
- 12.6 BRAND/PRODUCT COMPARISON
- FIGURE 44 BRAND COMPARISON
- 12.7 COMPANY EVALUATION MATRIX: KEY PLAYERS, 2023
- 12.7.1 STARS
- 12.7.2 PERVASIVE PLAYERS
- 12.7.3 EMERGING LEADERS
- 12.7.4 PARTICIPANTS
- FIGURE 45 PROGRESSING CAVITY PUMP MARKET: COMPANY EVALUATION MATRIX (KEY PLAYERS), 2023
- 12.7.5 COMPANY FOOTPRINT: KEY PLAYERS, 2023
- 12.7.5.1 Pumping capacity footprint
- TABLE 151 COMPANY PUMPING CAPACITY FOOTPRINT
- 12.7.5.2 End user footprint
- TABLE 152 COMPANY END USER FOOTPRINT
- 12.7.5.3 Regional footprint
- TABLE 153 COMPANY REGION FOOTPRINT
- 12.7.5.4 Overall footprint
- TABLE 154 COMPANY OVERALL FOOTPRINT
- 12.8 COMPANY EVALUATION MATRIX: START-UPS/SMES, 2023
- 12.8.1 PROGRESSIVE COMPANIES
- 12.8.2 RESPONSIVE COMPANIES
- 12.8.3 DYNAMIC COMPANIES
- 12.8.4 STARTING BLOCKS
- FIGURE 46 PROGRESSING CAVITY PUMP MARKET: COMPANY EVALUATION MATRIX (START-UPS/SMES), 2023
- 12.8.5 COMPETITIVE BENCHMARKING: START-UPS/SMES, 2023
- 12.8.5.1 List of key start-ups/SMEs
- TABLE 155 PROGRESSING CAVITY PUMP MARKET: LIST OF KEY START-UPS/SMES
- 12.8.5.2 Competitive benchmarking of key start-ups/SMEs
- TABLE 156 PROGRESSING CAVITY PUMP MARKET: COMPETITIVE BENCHMARKING OF KEY START-UPS/SMES
- 12.9 COMPETITIVE SCENARIOS AND TRENDS
- 12.9.1 PRODUCT LAUNCHES
- TABLE 157 PROGRESSING CAVITY PUMP MARKET: PRODUCT LAUNCHES, JANUARY 2018-APRIL 2022
- 12.9.2 DEALS
- TABLE 158 PROGRESSING CAVITY PUMP MARKET: DEALS, AUGUST 2020-MARCH 2022
- 12.9.3 EXPANSIONS
- TABLE 159 PROGRESSING CAVITY PUMP MARKET: EXPANSIONS, FEBRUARY 2020-APRIL 2022
- 12.9.4 OTHERS
- TABLE 160 PROGRESSING CAVITY PUMP MARKET: OTHERS, JULY 2020
13 COMPANY PROFILES
(Business overview, Products offered, Recent Developments, MNM view)**
- 13.1 KEY PLAYERS
- 13.1.1 NETZSCH
- TABLE 161 NETZSCH: COMPANY OVERVIEW
- TABLE 162 NETZSCH: PRODUCTS OFFERED
- TABLE 163 NETZSCH: EXPANSIONS
- 13.1.2 PCM
- TABLE 164 PCM: COMPANY OVERVIEW
- TABLE 165 PCM: PRODUCTS OFFERED
- TABLE 166 PCM: DEALS
- TABLE 167 PCM: OTHERS
- 13.1.3 NOV INC.
- TABLE 168 NOV INC.: COMPANY OVERVIEW
- FIGURE 47 NOV INC.: COMPANY SNAPSHOT
- TABLE 169 NOV INC.: PRODUCTS OFFERED
- TABLE 170 NOV INC.: PRODUCT LAUNCHES
- TABLE 171 NOV INC.: DEALS
- 13.1.4 CIRCOR INTERNATIONAL
- TABLE 172 CIRCOR INTERNATIONAL: COMPANY OVERVIEW
- FIGURE 48 CIRCOR INTERNATIONAL: COMPANY SNAPSHOT
- TABLE 173 CIRCOR INTERNATIONAL: PRODUCTS OFFERED
- TABLE 174 CIRCOR INTERNATIONAL: PRODUCT LAUNCHES
- TABLE 175 CIRCOR INTERNATIONAL: EXPANSIONS
- 13.1.5 SLB
- TABLE 176 SLB: COMPANY OVERVIEW
- FIGURE 49 SLB: COMPANY SNAPSHOT
- TABLE 177 SLB: PRODUCTS OFFERED
- TABLE 178 SLB: DEALS
- TABLE 179 SLB: EXPANSIONS
- TABLE 180 SLB: OTHERS
- 13.1.6 SEEPEX GMBH (INGERSOLL RAND INC.)
- TABLE 181 SEEPEX GMBH: COMPANY OVERVIEW
- TABLE 182 SEEPEX GMBH: PRODUCTS OFFERED
- TABLE 183 SEEPEX GMBH: PRODUCT LAUNCHES
- TABLE 184 SEEPEX GMBH: DEALS
- 13.1.7 CHAMPIONX
- TABLE 185 CHAMPIONX: COMPANY OVERVIEW
- FIGURE 50 CHAMPIONX: COMPANY SNAPSHOT
- TABLE 186 CHAMPIONX: PRODUCTS OFFERED
- TABLE 187 CHAMPIONX: DEALS
- 13.1.8 SULZER
- TABLE 188 SULZER: COMPANY OVERVIEW
- FIGURE 51 SULZER: COMPANY SNAPSHOT
- TABLE 189 SULZER: PRODUCTS OFFERED
- TABLE 190 SULZER: PRODUCT LAUNCHES
- TABLE 191 SULZER: DEALS
- TABLE 192 SULZER: OTHERS
- 13.1.9 XYLEM
- TABLE 193 XYLEM: BUSINESS OVERVIEW
- FIGURE 52 XYLEM: COMPANY SNAPSHOT, 2023
- TABLE 194 XYLEM: PRODUCTS OFFERED
- TABLE 195 XYLEM: PRODUCT LAUNCHES
- TABLE 196 XYLEM: DEALS
- TABLE 197 XYLEM: OTHERS
- 13.1.10 WILO SE
- TABLE 198 WILO SE: COMPANY OVERVIEW
- FIGURE 53 WILO SE: COMPANY SNAPSHOT
- TABLE 199 WILO SE: PRODUCTS OFFERED
- TABLE 200 WILO SE: DEALS
- TABLE 201 WILO SE: EXPANSIONS
- 13.1.11 VERDER LIQUIDS
- TABLE 202 VERDER LIQUIDS: COMPANY OVERVIEW
- TABLE 203 VERDER LIQUIDS: PRODUCTS OFFERED
- TABLE 204 VERDER LIQUIDS: DEALS
- 13.1.12 VARISCO
- TABLE 205 VARISCO: COMPANY OVERVIEW
- TABLE 206 VARISCO: PRODUCTS OFFERED
- 13.1.13 DELTA PD PUMPS
- TABLE 207 DELTA PD PUMPS: COMPANY OVERVIEW
- TABLE 208 DELTA PD PUMPS: PRODUCTS OFFERED
- 13.1.14 NOVA ROTORS
- TABLE 209 NOVA ROTORS: COMPANY OVERVIEW
- TABLE 210 NOVA ROTORS: PRODUCTS OFFERED
- 13.1.15 ROTO PUMPS
- TABLE 211 ROTO PUMPS: COMPANY OVERVIEW
- FIGURE 54 ROTO PUMPS: COMPANY SNAPSHOT
- TABLE 212 ROTO PUMPS: PRODUCTS OFFERED
- 13.1.16 VOGELSANG
- TABLE 213 VOGELSANG: COMPANY OVERVIEW
- TABLE 214 VOGELSANG: PRODUCTS OFFERED
- 13.1.17 INOXPA INDIA PVT. LTD.
- TABLE 215 INOXPA INDIA PVT. LTD.: COMPANY OVERVIEW
- TABLE 216 INOXPA INDIA PVT. LTD.: PRODUCTS OFFERED
- 13.1.18 SHANGHAI GL ENVIRONMENTAL TECHNOLOGY CO., LTD.
- TABLE 217 SHANGHAI GL ENVIRONMENTAL TECHNOLOGY CO., LTD.: COMPANY OVERVIEW
- TABLE 218 SHANGHAI GL ENVIRONMENTAL TECHNOLOGY CO., LTD.: PRODUCTS OFFERED
- 13.1.19 TAPFLO
- TABLE 219 TAPFLO: COMPANY OVERVIEW
- TABLE 220 TAPFLO: PRODUCTS OFFERED
- 13.1.20 SPI PUMPS
- TABLE 221 SPI PUMPS: COMPANY OVERVIEW
- TABLE 222 SPI FLOW: PRODUCTS OFFERED
- 13.2 OTHER PLAYERS
- 13.2.1 ZHEJIANG YONJOU TECHNOLOGY CO., LTD
- 13.2.2 FRISTUM PUMPS INDIA PVT. LTD.
- 13.2.3 PSP PUMPS
- 13.2.4 SPX FLOW, INC.
- 13.2.5 GEA GERMANY GMBH
- *Details on Business overview, Products/Services/Solutions offered, Recent Developments, MNM view might not be captured in case of unlisted companies.
14 APPENDIX
- 14.1 INSIGHTS FROM INDUSTRY EXPERTS
- 14.2 DISCUSSION GUIDE
- 14.3 KNOWLEDGESTORE: MARKETSANDMARKETS' SUBSCRIPTION PORTAL
- 14.4 CUSTOMIZATION OPTIONS
- 14.5 RELATED REPORTS
- 14.6 AUTHOR DETAILS

