|
|
市場調査レポート
商品コード
1733556
多特異性抗体の世界市場:薬剤売上、用量、価格、臨床試験動向(2030年)Global Multispecific Antibodies Market, Drug Sales, Dosage, Price & Clinical Trials Insight 2030 |
||||||
|
|||||||
|
|||||||

| 多特異性抗体の世界市場:薬剤売上、用量、価格、臨床試験動向(2030年) |
|
出版日: 2025年05月01日
発行: KuicK Research
ページ情報: 英文 1200 Pages
納期: 即日から翌営業日
|

全表示
- 概要
- 図表
- 目次
多特異性抗体の世界市場、薬剤売上、用量、価格、臨床試験動向(2030年)レポートのハイライト
- 世界の多特異性抗体市場の2030年までの機会:500億米ドル以上
- 世界の多特異性抗体市場の2024年の売上:120億米ドル超
- 承認済みの多特異性抗体の数:18個
- 世界の動向と地域の動向
- 承認済み抗体の世界、地域、年間および四半期別売上
- 承認済み抗体の用法・用量と価格に関する洞察
- 臨床試験中の全抗体の企業別、国別、適応症別、相別の包括的動向
- 臨床試験中の多特異性抗体の数:700超
当レポートは、世界の多特異性抗体市場に関する包括的な1次調査と2次調査の結果をまとめたもので、18の承認済み医薬品を網羅し、価格設定、用量設定、販売データを詳細に分析しています。市場規模、販売薬の地域別売上分析、最近の動向も含まれています。多特異性抗体の価格と市場実績に関する分析の正確性と信頼性を確保するため、企業報告書、取引所への提出書類、年次・四半期報告書、公式プレスリリースなど、広範な情報源を活用しました。
- 700以上の多特異性抗体に関する包括的な臨床試験情報については、1万0以上のウェブリンクを調査しました。
- 年次、四半期、世界、地域別の売上分析については、SEC文書、企業報告書、宣言書、プレスリリースを分析しました。
- FDAが指定した希少疾病用医薬品の適応症と優先順位を検証するため、オープンソースおよび独自の情報源にアクセスしました。
- 複数の医薬品専用ウェブサイトや各種ニュース、企業のプレスリリースを調査し、詳細な薬価や用量に関する情報を収集しました。
多特異性抗体市場は、治療上のブレークスルーと、複数の経路を同時に標的とすることで複雑な病態を治療する能力が認められつつあることから、バイオ医薬品ビジネスにおいて世界的に最も精力的で急成長している分野の一つです。2025年5月現在、18の多重特異性抗体が世界的に承認されており、そのすべてが二重特異性抗体です。この拡大するポートフォリオには、二重特異性抗体として初めて承認済みのBlincytoや、二重特異性抗体として初めてがん以外の適応症で承認済みのHemlibraのような先駆的な医薬品があります。この治療薬パイプラインへの最新の参入は、2025年4月に多発性骨髄腫の治療薬として製造販売承認を取得したリジェネロンのLynozyficであり、この分野での継続的な勢いを示しています。
承認済みの多特異性抗体の種類は、様々な適応症や患者層に対するこの治療法の柔軟性を反映しています。一方、中国を拠点とするAkesoのCadonilimabは、2つの免疫チェックポイントを同時に標的とする二重特異性抗体として唯一承認され、中国で開発された二重特異性抗体として初めて承認されました。開発におけるこのような地域差は、成熟した製薬市場と新興国バイオテクノロジーセンターの両方からの情報により、この分野における技術革新の世界的性質を強調しています。
規制環境は現在も急ピッチで変化しており、近い将来さらなる承認が見込まれています。FDAはまた、オドロネクスタマブとリンボセルタマブの販売申請を評価しています。オドロネクスタマブは濾胞性リンパ腫、リンボセルタマブはびまん性大細胞型B細胞リンパ腫、多発性骨髄腫を適応症としてEUですでに承認されています。このような大西洋を越えた規制当局の前進は、世界の規制当局が多特異性抗体技術を受け入れ、信頼を深めていることを反映しています。
市場の業績は極めて好調で、2024年の世界の多特異性抗体市場の売上高は126億米ドルを超え、次いで2025年第1四半期の売上高は34億6,000万米ドルを超えます。米国がこの売上高に最も貢献しており、この主要地域における市場の成熟度と受容性を浮き彫りにしています。ロシュの成熟製品であるHemlibraとVabysmoが市場シェアの半分以上を占めており、この競争市場における先行者利益と効果的な市場参入戦略の価値を強調しています。
開発のためのパイプラインはさらに大変なもので、すでに900以上の多特異性抗体がさまざまな開発段階にあります。多特異性抗体開発の伝統的な優先順位と、がん治療における大きなアンメット・メディカル・ニーズの両方により、がん領域がこのパイプラインをリードしています。しかし、パイプラインの多様性はがん領域だけにとどまらず、自己免疫疾患や炎症性疾患、神経疾患でも有望な候補が同定されており、市場機会を劇的に拡大する可能性を秘めた治療領域の広がりを示しています。
この技術革新を支えている主な業界参入企業は、Amgen、AstraZeneca、Genentech、Regeneronといった大手製薬会社や、ABL Bio、Harbour BioMed、Innovent Biologics、Merus、Zymeworksといった新興バイオテクノロジー企業です。このような老舗企業と新興企業の組み合わせは、継続的な技術革新と技術進歩を確実にする活気ある競合情勢を提供しています。
2025年4月のBoehringer IngelheimとCue Biopharmaによる、ウイルス特異的メモリーT細胞を介して病原性B細胞を攻撃する二重特異性候補薬CUE-501の開発提携のように、戦略的提携は市場開拓に影響を与え続けています。この提携は、契約一時金1,200万米ドルと最大3億4,500万米ドルのマイルストーン支払いを伴うもので、特に既存の治療法では不十分な自己免疫疾患において、企業が多特異性抗体技術を推進するために多額の資金を投入していることを示しています。
再発または難治性の多発性骨髄腫に対するイクノス・グレンマーク・イノベーションの三特異性T細胞エンゲージメントの治験薬であるISB 2001が、2025年4月にFDAからファスト・トラックに指定されたことは、重要なアンメット・メディカル・ニーズを治療する多特異性抗体技術の前進に対する規制当局の継続的な熱意を反映しています。このような継続的な技術革新の結果、世界の多特異性抗体市場は急成長が期待され、製薬業界において最も重要な分野のひとつになろうとしています。
当レポートは、世界の多特異性抗体市場について調査し、市場の概要とともに、薬剤動向、臨床試験動向、地域別動向、および市場に参入する企業の競合情勢などを提供しています。
目次
第1章 次世代多重特異性抗体のイントロダクション
第2章 次世代多重特異性抗体の現在の臨床開発と将来の商業化の見通し
- 現在の市場概要
- 将来の商業化の機会
- コラボレーション、ライセンス契約、投資、買収
- 次世代多重特異性抗体の企業独自の技術
第3章 次世代多重特異性抗体の臨床動向、適応症別
- がん
- 血液疾患
- 微生物感染症
- 自己免疫疾患および炎症性疾患
- 眼疾患
第4章 次世代多重特異性抗体の臨床開発と地域別市場動向
- 米国
- 欧州連合
- 中国
- 英国
- 日本
- オーストラリア
- 韓国
- カナダ
第5章 承認済みの多重特異性抗体- 臨床概要、価格設定および用量の考察
- 概要
- 臨床概要、価格設定、用量に関する考察
第6章 承認済みの多重特異性抗体- 販売動向(2020年~2025年第1四半期)
第7章 世界の重特異性抗体臨床試験の概要
第8章 世界の二重特異性抗体臨床試験:企業別、適応症別、相別
- 調査
- 前臨床
- 第I相
- 第I/II相
- 第II相
- 第II/III相
- 第III相
- 事前登録
- 登録済み
第9章 上市済みの二重特異性抗体の臨床的洞察:企業別、適応症別、相別
第10章 世界の三重特異性抗体臨床試験:企業別、適応症別、相別
- 調査
- 前臨床
- 第I相
- 第I/II相
- 第II/III相
第11章 三重特異性抗臨床試験の洞察:企業、国、適応症、相別
- 前臨床
- 第I相
- 第I/II相
- 第II相
第12章 競合情勢
- AbbVie
- ABL Bio
- Abzyme Therapeutics
- Affimed Therapeutics
- Akeso Biopharma
- Alligator Bioscience
- Amgen
- Antibody Therapeutics
- APITBIO
- Astellas Pharma
- AstraZeneca
- Aptevo Therapeutics
- BioAtla
- Biocytogen Pharmaceuticals
- Biosion
- EpimAb Biotherapeutics
- FutureGen Biopharmaceutical
- Genentech
- Genmab
- Genor Biopharma
- Gensun Biopharma
- Harbour BioMed
- IGM Biosciences
- I-MAB Biopharma
- ImmuneOnco Biopharma
- ImmunoPrecise Antibodies
- Innate Pharma
- Innovent Biologics
- Invenra
- Johnson & Johnson
- Kenjockety Biotechnology
- LaNova Medicines Limited
- Light Chain Bioscience
- Linton Pharm
- Lyvgen Biopharma
- MacroGenics
- Merck
- Merus
- ModeX Therapeutics (OPKO Health)
- Molecular Partners
- NovaRock Biotherapeutics
- Numab
- OPKO Health
- Pfizer
- Regeneron Pharmaceuticals
- Revitope
- Roche
- Sanofi
- Sichuan Baili Pharmaceutical
- SystImmune
- Virtuoso Therapeutics
- Xencor
- Y-Biologics
- Zhejiang Shimai Pharmaceutical
- Zymeworks
List of Figures
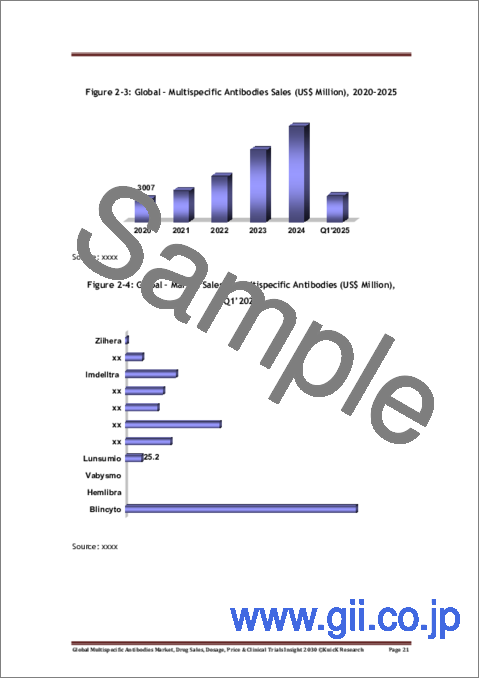
- Figure 2-1: Global - Multispecific Antibodies Sales (US$ Million), 2020-2025
- Figure 2-2: Global - Market Sales by Multispecific Antibodies (US$ Million), Q1'2025
- Figure 2-3: Global -Market Sales by Multispecific Antibodies (%), Q1'2025
- Figure 2-4: Global - Market Sales by Multispecific Antibodies (US$ Million), 2024
- Figure 2-5: Global -Market Sales by Multispecific Antibodies (%),2024
- Figure 2-6: Global - Multispecific Antibodies Quarterly Sales (US$ Million), Q1-Q4'2024
- Figure 2-7: US - Multispecific Antibodies Quarterly Sales (US$ Million), Q1-Q4'2024
- Figure 2-8: ROW - Multispecific Antibodies Quarterly Sales (US$ Million), Q1-Q4'2024
- Figure 2-9: Global - Multispecific Antibody Market Opportunity Assessment (US$ Billion), 2025 - 2030
- Figure 2-10: Grabody I Platform - Mechanism of Action 1
- Figure 2-11: Grabody I Platform - Mechanism of Action 2
- Figure 2-12: Abz2 Bispecific Platform
- Figure 2-13: Abz2 Bispecifics - Benefits
- Figure 2-14: Neo-X-Prime Bispecific Mechanism
- Figure 2-15: BiTE - Structure
- Figure 2-16: BiTE Molecule
- Figure 2-17: ADAPTIR Bispecific Structure
- Figure 2-18: ADAPTIR-FLEX
- Figure 2-19: BioAtla CABs - Features
- Figure 2-20: BioAtla CABs - Benefits
- Figure 2-21: FIT-Ig - Proprietary Bispecific Platform
- Figure 2-22: 3-Step DuoBody Production Process
- Figure 2-23: DuoHexaBody Molecules - Schematic
- Figure 2-24: BEAT Platform - Multispecific Antibodies
- Figure 2-25: IMBiologic Bispecific Antibodies - Strategy
- Figure 2-26: IMBiologic Bispecific Antibodies - Mechanism of Action
- Figure 2-27: ANKET(R) Platform - Innate Pharma
- Figure 2-28: B-Body Bispecific Antibody - Structre
- Figure 2-29: iTAb - Patented Structure
- Figure 2-30: iTAb - Mechanism of Action
- Figure 2-31: xLinkBsAb - Structure
- Figure 2-32: Multiclonics - Distinctive Characteristics
- Figure 2-33: Biclonics - Format
- Figure 2-34: Merus - Triclonics Platform
- Figure 2-35: STEALTH - ModeX Therapeutics
- Figure 2-36: MSTAR - ModeX Therapeutics
- Figure 2-37: MSTAR - Features
- Figure 2-38: DARPin Platform - Molecular Partners
- Figure 2-39: Novel HBICE
- Figure 2-40: HBICE - Mechanism of Action 1
- Figure 2-41: HBICE - Mechanism of Action 2
- Figure 2-42: Numab Therapeutics - Technology
- Figure 2-43: Phanes Therapeutics - PACbody Platform
- Figure 2-44: Phanes Therapeutics - SPECpair Platform
- Figure 2-45: Phanes Therapeutics - ATACCbody
- Figure 2-46: Purple Biotech - Tribody Antibody Platform
- Figure 2-47: PrecisionGATE Bispecific Antibody - Structure
- Figure 2-48: Sanyou Super Trillion Common Light Chain Antibody Discovery Platform
- Figure 2-49: GNC Antibodies - Sichuan Baili Pharmaceutical/SystImmune
- Figure 2-50: Synimmune - Proprietary Bispecific Antibody Format
- Figure 2-51: ALiCE - Characteristics
- Figure 2-52: ALiCE - Schematic Diagram & Mechanism of Action
- Figure 2-53: BiClone format
- Figure 2-54: Zyngenia Technology Approach
- Figure 3-1: Odronextamab (ELM-1) Phase I (NCT02290951) Study - Initiation & Completion Year
- Figure 3-2: Odronextamab (ELM-1) Phase II (NCT03888105) Study - Initiation & Completion Year
- Figure 3-3: Linvoseltamab (LINKER-MM1) Phase I/II (NCT03761108) Study - Initiation & Completion Year
- Figure 3-4: PIT565 Phase I (NCT05397496) Study - Initiation & Completion Year
- Figure 3-5: JNJ-79635322 Phase I (NCT05652335) Study - Initiation & Completion Year
- Figure 3-6: GNC-038 Phase I/II (NCT05192486) Study - Initiation & Completion Year
- Figure 3-7: GNC-038 Phase I/II (NCT05485753) Study - Initiation & Completion Year
- Figure 3-8: IPH6501 Phase I/II (NCT06088654) Study - Initiation & Completion Year
- Figure 3-9: AFM13 Phase I/II (NCT04074746) Study - Initiation & Completion Year
- Figure 3-10: NM32-2668 Phase I (NCT06299163) Study - Initiation & Completion Year
- Figure 3-11: GB263T Phase I/II (NCT05332574) Study - Initiation & Completion Year
- Figure 3-12: GNC-039 Phase I (NCT04794972) Study - Initiation & Completion Year
- Figure 3-13: Emicizumab (AHAEmi) Phase II (NCT05345197) Study - Initiation & Completion Year
- Figure 3-14: Emicizumab Phase II/III (NCT06155955) Study - Initiation & Completion Year
- Figure 3-15: Emicizumab (BCDI-XII) Phase I (NCT05500807) Study - Initiation & Completion Year
- Figure 3-16: HMB-001 Phase I/II (NCT06211634) Study - Initiation & Completion Year
- Figure 3-17: YBSW015 Early Phase I (NCT05369754) Study - Initiation & Completion Year
- Figure 3-18: CLN-978 (CLN-978-SL-101) Phase I (NCT06613360) Study - Initiation & Completion Year
- Figure 3-19: Vabysmo - Approval Year by Indication
- Figure 3-20: Faricimab (MAGIC) Phase II (NCT05681884) Study - Initiation & Completion Year
- Figure 3-21: Restoret (EYE103) - Tetravalent, Trispecific Antibody Binding Sites
- Figure 3-22: Restoret (BRUNELLO) Phase II/III (NCT06571045) Study - Initiation & Completion Year
- Figure 3-23: Restoret (BAROLO) Phase II/III (NCT06957080) Study - Initiation & Completion Year
- Figure 4-1: US - Approved Multispecific Antibodies
- Figure 4-2: EU - Approved Multispecific Antibodies
- Figure 4-3: Japan - Approved Multispecific Antibodies
- Figure 4-4: Chugai Pharmaceutical - Multispecific Antibody Clinical Pipeline
- Figure 4-5: SAIL66 Phase I (NCT05735366) Study - Initiation & Completion Year
- Figure 4-6: ONO-4685 (ONO-4685-05) Phase I (NCT06547528) Study - Initiation & Completion Year
- Figure 4-7: ABL Bio - Bispecific Antibody Pipeline
- Figure 4-8: ZW171 (ZWI-ZW171-101) Phase I (NCT06523803) Study - Initiation & Completion Year
- Figure 5-1: Blincyto - Approval Year by Region
- Figure 5-2: Blincyto - Patent Filing & Expiration Year
- Figure 5-3: Blincyto - Treatment Regimen Cycles (Weeks)
- Figure 5-4: Blincyto - Duration of Treatment Phase & Resting Phase in Induction & Consolidation Cycles for Treatment of MRD-Positive B-cell precursor (Days)
- Figure 5-5: Blincyto - Recommended Number of Induction & Consolidation Treatment Cycle for Relapsed B-Cell Precursor ALL
- Figure 5-6: Blincyto - Duration of Single Induction, Consolidation, Continued Cycle & Full Treatment for Relapsed B-Cell Precursor ALL (Weeks)
- Figure 5-7: Hemlibra - Approval Years by Region
- Figure 5-8: Hemlibra - Cost per Unit & Supply of 30 mg/mL Subcutaneous Injection of Different Volumes (US$), May'2025
- Figure 5-9: Hemlibra - Cost per Unit & Supply of 150 mg/mL Subcutaneous Injection of Different Volumes (US$), May'2025
- Figure 5-10: Hemlibra - Recommended Loading & Maintenance Dose for Treatment of Hemophilia (mg/kg/Week)
- Figure 5-11: Rybrevant - Price per Unit & Supply of Intravenous Solution (US$), May'2025
- Figure 5-12: Rybrevant - Recommended Dose per Cycle by Body Weight (mg)
- Figure 5-13: Rybrevant - Dose Reduction in Patients with Weight less than 80 kg (mg)
- Figure 5-14: Rybrevant - Dose Reduction in Patients with Weight more than 80 Kg (mg)
- Figure 5-15: Vabysmo - First Approval Year by Region
- Figure 5-16: Vabysmo - Price per Unit & Supply of Intravitreal Solution (US$), May'2025
- Figure 5-17: Lunsumio - Approval Years by Region
- Figure 5-18: US - Price per Unit & Supply of Lunsumio Intravenous Solution (US$), May'2025
- Figure 5-19: EU - Price per Unit & Supply of Lunsumio Intravenous Solution (US$), May'2025
- Figure 5-20: Tecvayli - Approval Years by Region
- Figure 5-21: Tecvayli - Patent Acceptance & Expiration Years
- Figure 5-22: US - Cost per Unit & Supply of Tecvayli Subcutaneous Solution (US$), May'2025
- Figure 5-23: EU - Cost per Unit & Supply of Tecvayli Subcutaneous Solution (US$), May'2025
- Figure 5-24: Columvi - Approval Year by Region
- Figure 5-25: US - Price per Unit & Supply of Columvi Intravenous Solution (US$), May'2025
- Figure 5-26: EU - Price per Unit & Supply of Columvi Intravenous Solution (US$), May'2025
- Figure 5-27: Epkinly - Approval Year by Region
- Figure 5-28: US - Cost per Unit & Supply of Epkinly Subcutaneous Solution (US$), May'2025
- Figure 5-29: EU - Cost per Unit & Supply of Epkinly Subcutaneous Solution (US$), May'2025
- Figure 5-30: Talvey - Approval Year by Region
- Figure 5-31: Talquetamab - FDA & EMA Designation Year
- Figure 5-32: Talvey - Patent Acceptance & Expiration Year
- Figure 5-33: US - Price per Unit & Supply of Talvey Intravenous Solution (US$), May'2025
- Figure 5-34: EU - Price per Unit & Supply of Talvey Intravenous Solution (US$), February'2024
- Figure 5-35: Elrexfio - Approval Years by Region
- Figure 5-36: Elranatamab - FDA & EMA Designation Year
- Figure 5-37: US - Price per Unit & Supply of Elrexfio Subcutaneous Solution (US$), May'2025
- Figure 5-38: Imdelltra - Approval Years by Region
- Figure 5-39: Imdelltra - Price per Unit & Supply of Intravenous Powder (US$), May'2025
- Figure 5-40: US - Price Per Unit & Supply Of Ziihera (US$), May'2025
- Figure 5-41: Zenocutuzumab - Active Patents
- Figure 6-1: Global - Annual Blincyto Sales (US$ Million), 2020-2025
- Figure 6-2: Regional - Blincyto Sales (US$ Million), Q1'2025
- Figure 6-3: Regional - Blincyto Sales Quarterly (%), Q1'2025
- Figure 6-4: Blincyto - Sales By Region (US$ Million), 2024
- Figure 6-5: Blincyto - Sales By Region (%), 2024
- Figure 6-6: US - Blincyto Sales ((US$ Million), 2020-2025
- Figure 6-7: US - Blincyto Sales Quarterly (US$ Million), 2024
- Figure 6-8: ROW - Blincyto Sales (US$ Million), 2020-2025
- Figure 6-9: ROW - Blincyto Sales Quarterly (US$ Million), 2024
- Figure 6-10: Global - Annual Hemlibra Sales (US$ Million), 2020-2024
- Figure 6-11: Regional - US v/s ROW Sales (US$ Million), Q1'2025
- Figure 6-12: Global - Hemlibra Sales by Region (US$ Million), Q1'2025
- Figure 6-13: Global - Hemlibra Sales by Region (%), Q1'2025
- Figure 6-14: Regional - US v/s ROW Sales (US$ Million), 2024
- Figure 6-15: Global - Hemlibra Sales by Region (US$ Million), 2024
- Figure 6-16: Global - Hemlibra Sales by Region (%),'2024
- Figure 6-17: Global - Hemlibra Sales Quarterly (US$ Million), 2024
- Figure 6-18: US - Annual Hemlibra Sales (US$ Million), 2020-2025
- Figure 6-19: US - Hemlibra Sales Quarterly (US$ Million), 2024
- Figure 6-20: Europe - Annual Hemlibra Sales (US$ Million), 2020-2025
- Figure 6-21: Europe - Hemlibra Sales Quarterly (US$ Million), 2024
- Figure 6-22: Japan - Annual Hemlibra Sales (US$ Million), 2020-2025
- Figure 6-23: Japan - Hemlibra Sales Quarterly (US$ Million), 2024
- Figure 6-24: ROW - Hemlibra Sales (US$ Million), 2020-2025
- Figure 6-25: ROW - Hemlibra Sales Quarterly (US$ Million), 2024
- Figure 6-26: Global - Annual Vabysmo Sales (US$ Million), 2022-2025
- Figure 6-27: Global - Vabysmo US v/s ROW Sales (US$ Million), Q1'2025
- Figure 6-28: Global - Vabysmo Sales by Region (US$ Million), Q1'2025
- Figure 6-29: Global - Vabysmo Annual Sales by Region (%), Q1'2025
- Figure 6-30: Global - Vabysmo US v/s ROW Sales (US$ Million), 2024
- Figure 6-31: Global - Vabysmo Sales by Region (US$ Million), 2024
- Figure 6-32: Global - Vabysmo Annual Sales by Region (%), 2024
- Figure 6-33: Global - Vabysmo Sales Quarterly (US$ Million), 2024
- Figure 6-34: US - Vabysmo Sales (US$ Million), 2022-2025
- Figure 6-35: US - Vabysmo Sales Quarterly (US$ Million), 2024
- Figure 6-36: Europe - Vabysmo Sales (US$ Million), 2022-2025
- Figure 6-37: Europe - Vabysmo Sales Quarterly (US$ Million), 2024
- Figure 6-38: Japan - Vabysmo Sales (US$ Million), 2022-2025
- Figure 6-39: Japan - Vabysmo Sales Quarterly (US$ Million), 2024
- Figure 6-40: ROW - Vabysmo Sales (US$ Million), 2022-2025
- Figure 6-41: ROW - Vabysmo Sales Quarterly (US$ Million), 2024
- Figure 6-42: Global - Annual Lunsumio Sales (US$ Million), 2022-2025
- Figure 6-43: Global - Lunsumio US v/s ROW Sales (US$ Million), Q1'2025
- Figure 6-44: Global - Lunsumio Sales by Region (US$ Million), Q1'2025
- Figure 6-45: Global - Lunsumio Annual Sales by Region (%), Q1'2025
- Figure 6-46: Global - Lunsumio US v/s ROW Sales (US$ Million), 2024
- Figure 6-47: Global - Lunsumio Sales by Region (US$ Million), 2024
- Figure 6-48: Global - Lunsumio Annual Sales by Region (%), 2024
- Figure 6-49: Global - Lunsumio Sales Quarterly (US$ Million), 2024
- Figure 6-50: US - Lunsumio Sales (US$ Million), 2022-2025
- Figure 6-51: US - Lunsumio Sales Quarterly (US$ Million), 2024
- Figure 6-52: Europe - Lunsumio Sales (US$ Million), 2022-2025
- Figure 6-53: Europe - Lunsumio Sales Quarterly (US$ Million), 2024
- Figure 6-54: ROW - Lunsumio Sales (US$ Million), 2022-2025
- Figure 6-55: ROW - Lunsumio Sales Quarterly (US$ Million), 2024
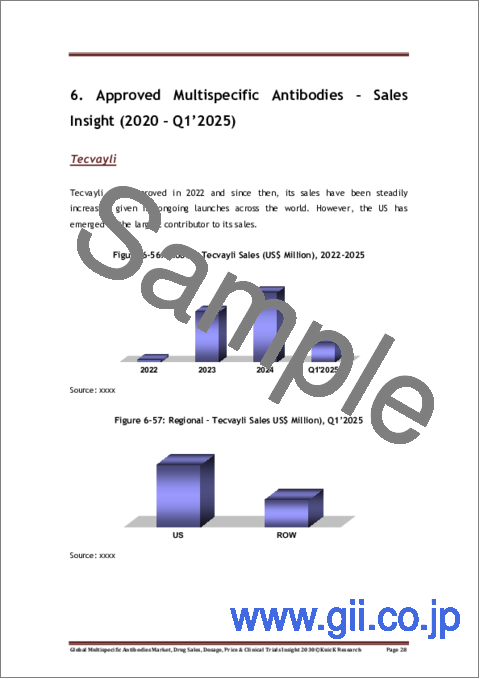
- Figure 6-56: Global - Tecvayli Sales (US$ Million), 2022-2025
- Figure 6-57: Regional - Tecvayli Sales US$ Million), Q1'2025
- Figure 6-58: Regional - Tecvayli Sales (%), Q1'2025
- Figure 6-59: Global - Tecvayli Sales Quarterly (US$ Million), 2024
- Figure 6-60: Regional - Tecvayli Sales (US$ Million), 2024
- Figure 6-61: Regional - Tecvayli Sales (%), 2024
- Figure 6-62: US - Tecvayli Sales (US$ Million), 2022-2025
- Figure 6-63: US - Tecvayli Sales Quaterly (US$ Million), 2024
- Figure 6-64: ROW - Tecvayli Sales (US$ Million), 2022-2025
- Figure 6-65: ROW - Tecvayli Sales Quarterly (US$ Million), 2024
- Figure 6-66: Global - Annual Columvi Sales (US$ Million), 2023-2025
- Figure 6-67: Regional - US v/s ROW Sales (US$ Million), Q1'2025
- Figure 6-68: Global - Columvi Sales by Region (US$ Million), Q1'2025
- Figure 6-69: Global - Columvi Sales by Region (%), Q1'2025
- Figure 6-70: Regional - US v/s ROW Sales (US$ Million), 2024
- Figure 6-71: Global - Columvi Sales by Region (US$ Million), 2024
- Figure 6-72: Global - Columvi Sales by Region (%),'2024
- Figure 6-73: Global - Columvi Sales Quarterly (US$ Million), 2024
- Figure 6-74: US - Annual Columvi Sales (US$ Million), 2023-2025
- Figure 6-75: US - Columvi Sales Quarterly (US$ Million), 2024
- Figure 6-76: Europe - Annual Columvi Sales (US$ Million), 2023-2025
- Figure 6-77: Europe - Columvi Sales Quarterly (US$ Million), 2024
- Figure 6-78: ROW - Columvi Sales (US$ Million), 2023-2025
- Figure 6-79: ROW - Columvi Sales Quarterly (US$ Million), 2024
- Figure 6-80: Global - Annual Epkinly Sales (US$ Million), 2023-2025
- Figure 6-81: Global - Columvi Sales Quarterly Reported by AbbVie (US$ Million), 2024
- Figure 6-82: US - Columvi Sales Quarterly Reported by AbbVie (US$ Million), 2024
- Figure 6-83: ROW - Columvi Sales Quarterly Reported by AbbVie (US$ Million), 2024
- Figure 6-84: Annual - Cadonilimab Sales (US$ Million), 2022-2024
- Figure 6-85: Global - Annual Talvey Sales (US$ Million), 2025
- Figure 6-86: Regional - Talvey Sales (US$ Million), Q1'2025
- Figure 6-87: Regional - Talvey Sales Quarterly (%), Q1'2025
- Figure 6-88: Global - Elrexfio Sales (US$ Million), 2023-2025
- Figure 6-89: Global - Annual Elrexfio Sales (US$ Million), 2025
- Figure 6-90: Regional - Elrexfio Sales (US$ Million), Q1'2025
- Figure 6-91: Regional - Elrexfio Sales Quarterly (%), Q1'2025
- Figure 6-92: US - Elrexfio Sales (US$ Million), 2023-2025
- Figure 6-93: ROW - Elrexfio Sales (US$ Million), 2023-2025
- Figure 6-94: Global - Imdelltra Sales (US$ Million), 2024-2025
- Figure 6-95: Regional - Imdelltra Sales (US$ Million), Q1'2025
- Figure 6-96: Regional - Imdelltra Sales Quarterly (%), Q1'2025
- Figure 6-97: Global - Imdelltra Sales Quarterly (US$ Million), 2024
- Figure 6-98: US - Imdelltra Sales (US$ Million), 2024-2025
- Figure 6-99: US - Imdelltra Sales (US$ Million), 2024-2025
- Figure 6-100: ROW - Imdelltra Sales (US$ Million), 2024-2025
- Figure 6-101: Global - Ordspono Sales (US$ Million), 2022-2024
- Figure 6-102: Global - Ordspono Sales Quarterly (US$ Million), 2024
- Figure 6-103: Global - Ziihera Sales (US$ Million), 2024
- Figure 7-1: Global - Multispecific Antibodies Clinical Trials by Phase (Numbers), 2025 till 2030
- Figure 7-2: Global - Bispecific Antibodies Clinical Trials by Phase (Numbers), 2025 till 2030
- Figure 7-3: Global - Tetraspecific Antibodies Clinical Trials By Phase (Number Of Antibodies), 2025 till 2030
- Figure 7-4: Global - Trispecific Antibodies Clinical Trials by Phase, 2025 till 2030
List of Tables
- Table 2-1: Estimated Total Cancer Cases, 2022 & 2040
- Table 2-2: Multispecific Antibodies Under Regulatory Review
- Table 3-1: Hematological Cancers - Approved Multispecific Antibodies
- Table 3-2: Hematological Malignancies - Estimated Total Cancer Cases, 2022 & 2040
- Table 3-3: Solid Cancers - Approved Multispecific Antibodies
- Table 3-4: Solid Cancers - Estimated Total Cancer Cases, 2022 & 2040
- Table 4-1: US - Multispecific Antibodies in Clinical Trials
- Table 4-2: EU - Multispecific Antibodies in Clinical Trials
- Table 4-3: UK - Multispecific Antibodies in Clinical Trials
- Table 4-4: Japan - Multispecific Antibodies in Clinical Trials
- Table 4-5: Australia - Multispecific Antibodies in Clinical Trials
- Table 4-6: South Korea - Multispecific Antibodies in Clinical Trials
- Table 4-7: Canada - Multispecific Antibodies in Clinical Trials
- Table 5-1: Approved Multispecific Antibodies
- Table 5-2: Blincyto - Active Patents
- Table 5-3: Blincyto - Recommended Dosage & Schedule for the Treatment of MRD-positive B-cell Precursor ALL
- Table 5-4: Blincyto - Recommended Dosage & Schedule for Treatment of Relapsed or Refractory B-cell Precursor ALL
- Table 5-5: Blincyto - Recommended Dosage & Schedule for Treatment of Relapsed or Refractory B-cell Precursor ALL
- Table 5-6: Rybrevant - Premedication
- Table 5-7: Rybrevant - Dose Reductions for Adverse Reactions
- Table 5-8: Rybrevant - Recommended Dosage Modifications for Adverse Reactions
- Table 5-9: Lunsumio - Recommended Treatment Cycles
- Table 5-10: Lunsumio - Recommended Premedications
- Table 5-11: Lunsumio - Recommendations for Management of Cytokine Release Syndrome
- Table 5-12: Tecvayli - Dosing Schedule
- Table 5-13: Tecvayli - Recommended Dosage Modifications for Adverse Reactions
- Table 5-14: Columvi - Dosing Schedule (21-Day Treatment Cycles)
- Table 5-15: Columvi - Premedications to be Administered
- Table 5-16: Columvi - Recommendations for Management of Cytokine Release Syndrome
- Table 5-17: Columvi - Recommended Dosage Modification for Neurologic Toxicity (Including ICANS)
- Table 5-18: Columvi - Recommended Dosage Modifications for Other Adverse Reactions
- Table 5-19: Epkinly - Dosage Schedule
- Table 5-20: Epkinly - Recommendations for Management of Cytokine Release Syndrome
- Table 5-21: Epkinly - Recommendations for Management of Immune Effector Cell-Associated Neurotoxicity Syndrome (ICANS)
- Table 5-22: Epkinly - Recommended Dosage Modifications for Other Adverse Reactions
- Table 5-23: Talvey - Weekly Dosing Schedule
- Table 5-24: Talvey - Biweekly Dosing Schedule
- Table 5-25: Talvey - Recommendations for Management of CRS
- Table 5-26: Talvey - Recommendations for Management of Immune Effector Cell-Associated Neurotoxicity Syndrome (ICANS)
- Table 5-27: Talvey - Recommendations for Management of Neurologic Toxicity (excluding ICANS)
- Table 5-28: Talvey - Recommended Dosage Modifications for Other Adverse Reactions
- Table 5-29: Elrexfio - Dosing Schedule
- Table 5-30: Elrexfio - Recommendations for Management of CRS
- Table 5-31: Elrexfio - Recommended Dosage Modifications for Other Adverse Reactions
- Table 5-32: Kaitani - Recommended Dose modifications
- Table 5-33: Imdelltra - Recommended Concomitant Medications for Administration for Cycle 1
- Table 5-34: Imdelltra - Recommended Dosage and Schedule
- Table 5-35: Imdelltra - Recommendations for Restarting Therapy After Dosage Delay
- Table 5-36: Imdelltra - Guidelines for Grading & Dosage Modification & Management of Cytokine Release Syndrome
- Table 5-37: Imdelltra - Guidelines for Management of Neurologic Toxicity including Immune Effector Cell-Associated Neurotoxicity Syndrome
- Table 5-38: Ordspono - Recommended dose
- Table 5-39: Ordspono - Premedications & post-medications for patients with r/r FL or r/r DLBCL
- Table 5-40: Ziihera - Dosage Modifications For Adverse Reactions
- Table 5-41: Bizengri - Premedications Prior To Infusions
- Table 5-42: Bizengri - Recommended Dosage Modifications & Management For Adverse Reactions
- Table 5-43: Lynozyfic - Recommended Posology
Global Multispecific Antibodies Market, Drug Sales, Dosage, Price & Clinical Trials Insight 2030 Report Highlights:
- Global Multispecific Antibodies Market Opportunity By 2030: > USD 50 Billion
- Global Multispecific Antibodies Market Sales In 2024: > USD 12 Billion
- Number Of Approved Multispecific Antibodies: 18
- Global & Regional Trends Insight
- Approved Antibodies Global, Regional, Annual & Quarterly Sales Insight
- Approved Antibodies Dosage & Pricing Insight
- Comprehensive Insight On All Antibodies In Clinical Trials By Company, Country, Indication & Phase
- Number Of Multispecific Antibodies: In Clinical Trials: > 700
Research Methodology
At Kuick Research, we begin by outlining the foundation of our research methodology, which is driven by an integrated approach that combines multiple data dimensions. In our work, we ensure that the report captures market estimation, regional analysis, and a carefully constructed competitive landscape. We take pride in the detailed inclusion of key components such as the assessment of available information, clinical trial data, and the nuances of dosing and pricing. Every piece of data is purposefully gathered and validated to ensure that our findings are as robust as possible, reflecting the multifaceted nature of the market landscape.
This report on the global multispecific antibodies market is the result of comprehensive primary and secondary research, encompassing 18 approved drugs, alongside in-depth analysis of their pricing, dosing, and sales data. Market size, marketed drugs regional sales analysis and recent trends are also included in the report. To ensure the accuracy and reliability of our analysis on multispecific antibodies pricing and market performance, we leveraged an extensive array of sources, including company reports, exchange filings, annual and quarterly reports, and official press releases.
- Over 10000 distinct web links were reviewed for comprehensive clinical trial information on more than 700 multispecific antibodies.
- For annual, quarterly, global and regional sales analysis, SEC documents, company reports, declarations, press releases were analyzed.
- Open source and proprietary sources were accessed to validate FDA designated orphan drug indications & priority status.
- Multiple drug specific website and various news, company press releases were examined to gather detailed drug pricing and dosage information
Multispecific antibodies market globally has been one of the most energetic and fast growing sectors in the biopharmaceutical business as a result of therapeutic breakthroughs and growing acceptance of their ability to treat complicated pathologies by targeting multiple pathways simultaneously. As of May 2025, 18 multispecific antibodies have gained regulatory approval globally, all of which are bispecific constructs, a monumental milestone in the history of targeted therapeutics. This expanding portfolio boasts trailblazing drugs like Blincyto, the first bispecific antibody to gain approval, and Hemlibra, which was the first bispecific antibody to be approved for a non-cancer indication. The latest entrant to this therapeutic pipeline is Regeneron's Lynozyfic, which received marketing approval in April 2025 for the treatment of multiple myeloma, with evidence of ongoing momentum in the segment.
The range of approved multispecific antibodies mirrors the flexibility of this therapeutic modality across various disease indications and patient bases. Rybrevant is another key breakthrough as the first bispecific antibody for a solid tumor, whereas China based Akeso's Cadonilimab is especially noteworthy for being solely approved bispecific antibody intended to target two immune checkpoints at once and becoming the first China developed bispecific antibody to gain regulatory approval. This regional variation in development emphasizes the world nature of innovation in this sector, with input from both mature pharmaceutical markets and developing biotechnology centers.
The regulatory environment is still changing at a rapid pace, with further approvals expected in the near future. The FDA is also evaluating marketing applications for Odronextamab and Linvoseltamab, both of which have already received approval in the EU for follicular lymphoma and diffuse large B-cell lymphoma, and multiple myeloma, respectively. Such transatlantic regulatory advancements reflect the growing acceptability and trust in multispecific antibody technologies by global regulatory bodies.
Market performance has been extremely strong, with global multispecific antibodies market sales in 2024 amounting to over US$ 12.6 Billion, followed by first quarter 2025 sales of over US$ 3.46 Billion. The US is the largest contributor to these sales, highlighting the maturity and acceptance of the market in this prime geography. Roche's mature products, Hemlibra and Vabysmo, lead the market share, with over half of total sales, emphasizing the value of first mover benefit and effective market entry strategies in this competitive market.
The pipeline for development is an even more daunting picture, with more than 900 multispecific antibodies already in various stages of development. Oncology is leading this pipeline, both due to the traditional priority of multispecific antibody development and due to the large unmet medical needs in cancer treatment. However, pipeline diversity is not confined to oncology alone with promising candidates being identified in autoimmune and inflammatory diseases and neurological disorders as well, indicating an expanding therapeutic horizon that has the potential to dramatically expand market opportunities.
Major industry players behind this innovation are well established pharma giants like Amgen, AstraZeneca, Genentech, and Regeneron, as well as new biotech firms like ABL Bio, Harbour BioMed, Innovent Biologics, Merus, and Zymeworks. This combination of well established and new players provides a vibrant competitive landscape that ensures ongoing innovation and technological progress.
Strategic alliances continue to influence the development of the market, such as in the April 2025 alliance of Boehringer Ingelheim and Cue Biopharma for the development of CUE-501, a bispecific candidate that attacks pathogenic B cells via virus-specific memory T cells. The alliance, involving a US$ 12 Million upfront payment and possible milestone payments of up to US$ 345 Million, illustrates the high financial investment that companies are undertaking to drive multispecific antibody technologies, specifically in autoimmune indications where existing treatments are still inadequate.
Regulatory encouragement of innovation continues to be robust, with the FDA's April 2025 fast track designation of ISB 2001, an Ichnos Glenmark Innovation investigational trispecific T-cell engager for relapsed or refractory multiple myeloma, reflecting ongoing regulatory enthusiasm for moving multispecific antibody technologies forward that treat important unmet medical needs. As a result of these ongoing innovations, the global multispecific antibody market is expected to grow rapidly and is on track to become one of the most important segments within the pharmaceutical industry.
Table of Contents
1. Introduction to Next Generation Multispecific Antibodies
2. Next Generation Multispecific Antibody Current Clinical Development & Future Commercialization Outlook
- 2.1 Current Market Overview
- 2.2 Future Commercialization Opportunity
- 2.3 Collaborations, License Agreements, Investments & Acquisitions
- 2.4 Next Generation Multispecific Antibody Proprietary Technologies By Company
3. Next Generation Multispecific Antibody Clinical Trends by Indication
- 3.1 Cancer
- 3.2 Hematological Disorders
- 3.3 Microbial Infections
- 3.4 Autoimmune & Inflammatory Disorders
- 3.5 Ocular Diseases
4. Next Generation Multispecific Antibody Clinical Development & Market Trends by Region
- 4.1 US
- 4.2 EU
- 4.3 China
- 4.4 UK
- 4.5 Japan
- 4.6 Australia
- 4.7 South Korea
- 4.8 Canada
5. Approved Multispecific Antibodies - Clinical Overview, Pricing & Dosage Insight
- 5.1 Overview
- 5.2 Clinical Overview, Pricing & Dosage Insight
6. Approved Multispecific Antibodies - Sales Insight (2020 - Q1'2025)
7. Global Multispecific Antibodies Clinical Trials Overview
8. Global Bispecific Antibodies Clinical Trials By Company, Indication & Phase
- 8.1 Research
- 8.2 Preclinical
- 8.3 Phase-I
- 8.4 Phase-I/II
- 8.5 Phase-II
- 8.6 Phase-II/III
- 8.7 Phase-III
- 8.8 Preregistration
- 8.9 Registered
9. Marketed Bispecific Antibodies Clinical Insight By Company, Country & Indication
10. Global Trispecific Antibodies Clinical Trials Insight By Company, Country, Indication & Phase
- 10.1 Research
- 10.2 Preclinical
- 10.3 Phase I
- 10.4 Phase I/II
- 10.5 Phase II/III
11. Tetraspecific Antibodies Clinical Trials Insight By Company, Country, Indication & Phase
- 11.1 Preclinical
- 11.2 Phase I
- 11.3 Phase I/II
- 11.4 Phase II
12. Competitive Landscape
- 12.1 AbbVie
- 12.2 ABL Bio
- 12.3 Abzyme Therapeutics
- 12.4 Affimed Therapeutics
- 12.5 Akeso Biopharma
- 12.6 Alligator Bioscience
- 12.7 Amgen
- 12.8 Antibody Therapeutics
- 12.9 APITBIO
- 12.10 Astellas Pharma
- 12.11 AstraZeneca
- 12.12 Aptevo Therapeutics
- 12.13 BioAtla
- 12.14 Biocytogen Pharmaceuticals
- 12.15 Biosion
- 12.16 EpimAb Biotherapeutics
- 12.17 FutureGen Biopharmaceutical
- 12.18 Genentech
- 12.19 Genmab
- 12.20 Genor Biopharma
- 12.21 Gensun Biopharma
- 12.22 Harbour BioMed
- 12.23 IGM Biosciences
- 12.24 I-MAB Biopharma
- 12.25 ImmuneOnco Biopharma
- 12.26 ImmunoPrecise Antibodies
- 12.27 Innate Pharma
- 12.28 Innovent Biologics
- 12.29 Invenra
- 12.30 Johnson & Johnson
- 12.31 Kenjockety Biotechnology
- 12.32 LaNova Medicines Limited
- 12.33 Light Chain Bioscience
- 12.34 Linton Pharm
- 12.35 Lyvgen Biopharma
- 12.36 MacroGenics
- 12.37 Merck
- 12.38 Merus
- 12.39 ModeX Therapeutics (OPKO Health)
- 12.40 Molecular Partners
- 12.41 NovaRock Biotherapeutics
- 12.42 Numab
- 12.43 OPKO Health
- 12.44 Pfizer
- 12.45 Regeneron Pharmaceuticals
- 12.46 Revitope
- 12.47 Roche
- 12.48 Sanofi
- 12.49 Sichuan Baili Pharmaceutical
- 12.50 SystImmune
- 12.51 Virtuoso Therapeutics
- 12.52 Xencor
- 12.53 Y-Biologics
- 12.54 Zhejiang Shimai Pharmaceutical
- 12.55 Zymeworks

