|
|
市場調査レポート
商品コード
1366583
CD19抗体の世界市場、臨床パイプラインの見通し(2028年)Global CD19 Antibody Market & Clinical Pipeline Outlook 2028 |
||||||
|
|
|||||||
|
|||||||


| CD19抗体の世界市場、臨床パイプラインの見通し(2028年) |
|
出版日: 2023年10月01日
発行: KuicK Research
ページ情報: 英文 420 Pages
納期: 即日から翌営業日
|

- 全表示
- 概要
- 図表
- 目次
世界のCD19抗体の市場規模は、2028年までに100億米ドルを超えると予測されています。
CD19標的療法は、過去10年間に免疫療法のもう一つの革命的なクラスとして出現しました。モノクローナル抗体、二特異性抗体、抗体薬物複合体、キメラ抗原受容体T細胞(CAR-T)療法からなるこれらの療法は、世界の製薬業界の臨床・商業の両分野から注目を集めています。これらの治療に対する患者や医師の反応も良好で、CD19標的治療薬の市場が2021年には50%近く、2022年には40%増加するという事実からもうかがい知ることができます。これは、規制当局の承認が急速に進んだことに起因しており、CD19標的治療薬の現在のパイプラインは、この市場規模がさらに急増する可能性を示しています。
CD19標的療法は、癌治療の臨床状況に大きな影響を与えています。CD19標的療法は、主に非ホジキンリンパ腫(NHL)や急性リンパ性白血病(ALL)、大細胞型B細胞リンパ腫(LBCL)などのB細胞性悪性腫瘍の治療に用いられています。これらの療法、特にKymriahやYescartaのようなCAR-T療法の臨床効果は目覚ましく、かなりの割合の患者で高い奏効率と寛解の延長をもたらし、有望な治療選択肢となっています。しかし、CAR-T療法に課題がないわけではありません。サイトカイン放出症候群(CRS)や神経毒性はCAR-T療法にしばしば関連しますが、研究者たちはこれらを管理する方法を見出しています。
いくつかの従来の治療法とは異なり、CD19を標的とする治療法は長期にわたる奏効の可能性を示しています。寛解に至った患者は長期間無病状態を維持することができ、QOLが大幅に改善します。さらに、CD19標的療法は個別化医療への大きな一歩でもあります。CD19標的療法は、各患者固有の免疫系と癌細胞の特徴に合わせて調整されるため、高度に個別化された治療法となります。
これらの治療薬の市場での継続的な成功は、医薬品市場の研究開発部門にとって励みとなり、その結果、いくつかの新しいCD19標的治療薬が開発および臨床試験パイプラインに入っています。これらの大半はCD19を標的とするCAR-T療法で、非ホジキンリンパ腫の中でも急性リンパ性白血病(ALL)や慢性リンパ性白血病(CLL)などの血液癌を対象に開発が進められています。さらに、全身性エリテマトーデス(SLE)、シェーグレン症候群、全身性強皮症などの自己免疫疾患など、免疫系の疾患もこれに続いています。
市場では最近、革新的なCD19標的治療薬の研究開発のための共同研究も行われており、承認済みCD19標的治療薬では前例のない特徴を有していることから、承認されれば市場での優位性が期待されます。これには、これらの治療法の開発に費やされるコストと時間を削減するのに役立つ独自のプラットフォームの使用も含まれます。
当レポートでは、世界のCD19抗体市場について調査し、市場の概要とともに、CD19抗体の作用機序、癌治療における役割、地域別動向、臨床試験動向、および市場に参入する企業の競合動向などを提供しています。
目次
第1章 調査手法
第2章 承認済みCD19標的療法
第3章 世界のCD19抗体市場力学
- 現在の市場動向と発展
- 将来の成長の道筋
第4章 CD19標的療法の臨床試験と市場洞察、適応症別
- 血液癌
- 白血病
- リンパ腫
- 固形癌
- 免疫系疾患
第5章 CD19標的療法市場力学、地域別
- 米国
- 中国
- EU
- カナダ
- オーストラリア
第6章 世界のCD19市場の売上と価格に関する洞察、承認薬別
- Blincyto-初のCD19標的療法
- キムリア- 初の抗CD19 CAR T細胞療法
- イエスカルタ
- Uplizna-初の抗CD19モノクローナル抗体
- テカルトス
- Monjuvi
- ブレヤンジ
- Zynlonta-初のCD19標的ADC療法
- カルテイバ
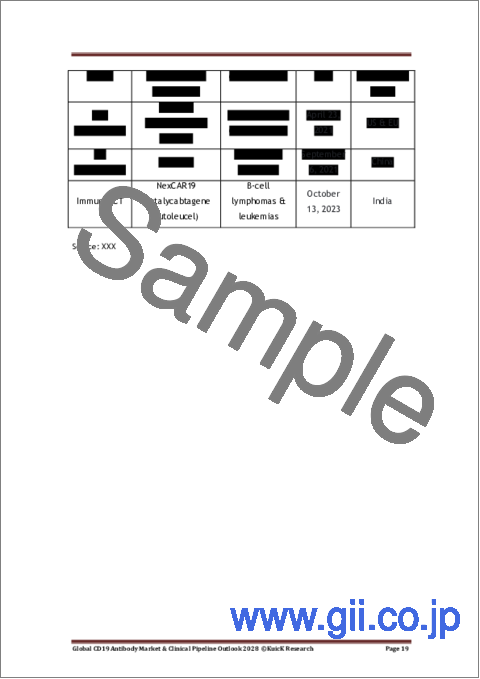
- NexCAR19-初のCD19標的CAR T細胞療法
第7章 世界のCD19抗体臨床試験の概要
- 国別
- 適応症別
- 相別
- 治療クラス別
第8章 世界のCD19抗体臨床試験、企業別、適応症別、相別
- 研究
- 前臨床
- 第I相
- 第I/II相
- 第II相
- 第III相
- 事前登録
- 登録済み
第9章 商業的に承認済みのCD19抗体の臨床的洞察
第10章 競合情勢
- AbbVie
- Aleta Biotherapeutics
- Autolus
- Bristol-Myers Squibb
- Cabaret Biotech
- Cellectis
- Cellular Biomedicine Group
- Chongqing Precision Biotech Co., Ltd
- CRISPR Therapeutics
- Eureka Therapeutics
- EXUMA Biotech
- Fate Therapeutics
- Galapagos NV
- Gilead Sciences
- Gracell Biotechnology
- Guangzhou Bio-gene Technology
- Hebei Senlang Biotechnology
- ImmPACT Bio
- Immvira Pharma
- Innovative Cellular Therapeutics
- Juventas Cell Therapy
- Kite Pharma
- Kyverna Therapeutics
- MedTherapy
- Memorial Sloan-Kettering Cancer Center
- Nanjing Bioheng Biotech
- Nanjing IASO Biotherapeutics
- Poseida Therapeutics
- Precision Biosciences
- Sana Biotechnology
List of Tables
- Table 2-1: Globally Approved CD19 Targeting Therapies
- Table 3-1: Global - CD19 Antibodies Sales By Brand Name (US$ Million), 2019-2023
- Table 3-2: Global - CD19 Antibodies Quarterly Sales (US$ Million), 2022
- Table 4-1: Hematological Cancers - Approved CD19 Targeting Therapies & Mechanism of Action
- Table 4-2: Immune System Diseases - Approved CD19 targeting therapies & Mechanism of Action
- Table 5-1: US - FDA Designations for CD19 Targeting Therapies, October'2023
- Table 5-2: US - FDA IND Applications Accepted for CD19 Targeting Therapies, October'2023
- Table 5-3: China - NMPA IND Applications Accepted for CD19 Targeting Therapies, October'2023
- Table 6-1: Blincyto - Recommended Dosage & Schedule for the Treatment of MRD-positive B-cell Precursor ALL
- Table 6-2: Blincyto - Recommended Dosage & Schedule for Treatment of Relapsed or Refractory B-cell Precursor ALL
- Table 6-3: Blincyto - Recommended Dose Modifications
- Table 6-4: Uplizna - Premedication Prior to Each Infusion
- Table 6-5: Monjuvi - Dosing Schedule
- Table 6-6: Monjuvi - Dosage Modifications for Adverse Reactions
List of Figures
- Figure 3-1: Global - CD19 Antibodies Sales (US$ Million), 2019-2023
- Figure 3-2: Global - CD19 Antibodies Sales by Brand Name (US$ Million), H1'2023
- Figure 3-3: Global - CD19 Antibodies Quarterly Sales (US$ Million), 2023
- Figure 3-4: Global - CD19 Antibodies Sales by Brand Name (US$ Million), 2022
- Figure 3-5: Global - CD19 Antibodies Quarterly Sales (US$ Million), 2022
- Figure 3-6: Global - CD19 Antibodies Sales (US$ Million), 2022 - 2028
- Figure 4-1: CD19 Expression in B-Cell Malignancies (%)
- Figure 4-2: Leukemia - Global CD19 Targeting Therapies Sales Values (US$ Million), 2021-2023
- Figure 4-3: NCT05020392 Phase III Study - Initiation & Completion Years
- Figure 4-4: NCT05020392 Phase III Study - Initiation & Completion Years
- Figure 4-5: OSU-13031 Phase II Study - Initiation & Completion Years
- Figure 4-6: BIM-HEM-I Phase II Study - Initiation & Completion Years
- Figure 4-7: Lymphoma - Global CD19 Targeting Therapies Sales Values (US$ Million), 2021-2023
- Figure 4-8: IKS03-01 Phase I Study - Initiation & Completion Years
- Figure 4-9: NCT05149391 Phase I Study - Initiation & Completion Years
- Figure 4-10: MPCT-012L Phase I/II Study - Initiation & Completion Years
- Figure 4-11: NCT05583149 Phase II Study - Initiation & Completion Years
- Figure 4-12: NKX019-101 Phase I Study - Initiation & Completion Years
- Figure 4-13: MOR208C310 Phase III Study - Initiation & Completion Years
- Figure 4-14: TG-1801-102 Phase I Study - Initiation & Completion Years
- Figure 4-15: CF33-CD19 - Combination of CF33 OV & CAR T Cell Therapy
- Figure 4-16: CF33-CD19-101 Phase I Study - Initiation & Completion Years
- Figure 4-17: STRIvE-01 Phase I Study - Initiation & Completion Years
- Figure 4-18: STRIvE-02 Phase I Study - Initiation & Completion Years
- Figure 4-19: Inebilizumab - Proposed Mechanism of Action
- Figure 4-20: NCT05549258 Phase II Study - Initiation & Completion Years
- Figure 4-21: ExTINGUISH Phase II Study - Initiation & Completion Years
- Figure 4-22: NCT04524273 Phase III Study - Initiation & Completion Years
- Figure 4-23: INDIGO Phase III Study - Initiation & Completion Years
- Figure 4-24: SApHiAre Phase III Study - Initiation & Completion Years
- Figure 4-25: CD19/BCMA-003 Phase I Study - Initiation & Completion Years
- Figure 4-26: CD19/BCMA-002 Phase I Study - Initiation & Completion Years
- Figure 4-27: JWCAR029012 Phase I Study - Initiation & Completion Years
- Figure 5-1: US - Approval Years of CD19 Targeting Therapies
- Figure 5-2: US - Blincyto Patent Filing & Expiration Years
- Figure 5-3: China - Approval Years of CD19 Targeting Therapies
- Figure 5-4: EU - Approval Years of CD19 Targeting Therapies
- Figure 5-5: Canada - Approval Years of CD19 Targeting Therapies
- Figure 5-6: Canada - Blincyto Patents Approval & Expiration Years
- Figure 5-7: Canada - Kymriah Patents Approval & Expiration Years
- Figure 5-8: Australia - Approval Years of CD19 Targeting Therapies
- Figure 6-1: Blincyto - Approval Years by Region
- Figure 6-2: Blincyto - US Patent Acceptance & Expiration Years
- Figure 6-3: Blincyto - EU Patent Expiration Years
- Figure 6-4: US - Cost Of Single Blincyto Supply (US$), October'2023
- Figure 6-5: Blincyto - Treatment Course of MRD-Positive B-cell precursor ALL
- Figure 6-6: Blincyto - Duration of Treatment Phase & Resting Phase in Induction & Consolidation Cycles for Treatment of MRD-Positive B-cell precursor (Days)
- Figure 6-7: Blincyto - Cost of Single Cycle & Treatment Course for the Treatment of MRD-positive B-cell Precursor ALL
- Figure 6-8: Blincyto - Recommended Number of Induction & Consolidation Treatment Cycle for Relapsed B-Cell Precursor ALL
- Figure 6-9: Blincyto - Duration of Single Induction, Consolidation, Continued Cycle & Full Treatment for Relapsed B-Cell Precursor ALL (Weeks)
- Figure 6-10: Blincyto - Cost of Single Cycle & Treatment Course for Treatment for Relapsed B-Cell Precursor ALL
- Figure 6-11: Global - Blincyto Annual Sales Value (US$ Million), 2019-2023
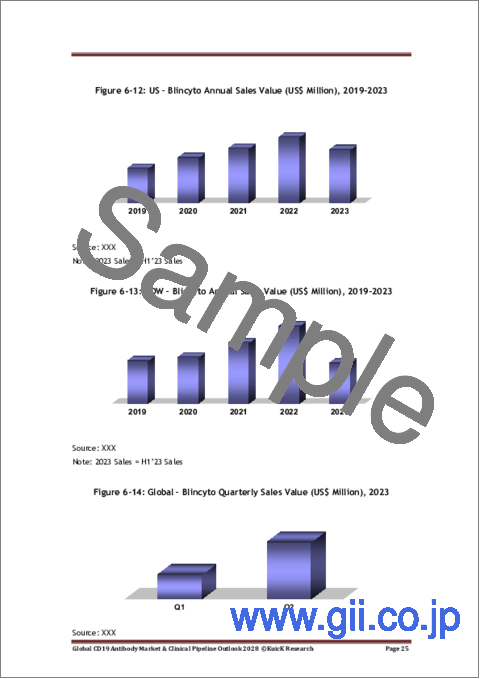
- Figure 6-12: US - Blincyto Annual Sales Value (US$ Million), 2019-2023
- Figure 6-13: ROW - Blincyto Annual Sales Value (US$ Million), 2019-2023
- Figure 6-14: Global - Blincyto Quarterly Sales Value (US$ Million), 2023
- Figure 6-15: US - Blincyto Quarterly Sales Value (US$ Million), 2023
- Figure 6-16: ROW - Blincyto Quarterly Sales Value (US$ Million), 2023
- Figure 6-17: Global - Blincyto Quarterly Sales Value (US$ Million), 2022
- Figure 6-18: US - Blincyto Quarterly Sales Value (US$ Million), 2022
- Figure 6-19: ROW - Blincyto Quarterly Sales Value (US$ Million), 2022
- Figure 6-20: US - Kymriah Approval Years by Indications
- Figure 6-21: Kymriah - Approval Years by Region
- Figure 6-22: US - Kymriah Suspension Cost (US$), October'2023
- Figure 6-23: Global - Kymriah Annual Sales Value (US$ Million), 2019-2023
- Figure 6-24: Global - Kymriah Quarterly Sales Value (US$ Million), 2023
- Figure 6-25: Global - Kymriah Quarterly Sales Value (US$ Million), 2022
- Figure 6-26: US - Kymriah Quarterly Sales Value (US$ Million), 2022
- Figure 6-27: ROW - Kymriah Quarterly Sales Value (US$ Million), 2022
- Figure 6-28: US - Yescarta Approval Years by Indications
- Figure 6-29: Yescarta - Approval Years by Region
- Figure 6-30: Yescarta - US Patent Approval & Expiration Year
- Figure 6-31: US - Yescarta List Price (US$), October'2023
- Figure 6-32: Global - Yescarta Annual Sales Value (US$ Million), 2019-2023
- Figure 6-33: US - Yescarta Annual Sales Value (US$ Million), 2019-2023
- Figure 6-34: EU - Yescarta Annual Sales Value (US$ Million), 2019-2023
- Figure 6-35: ROW - Yescarta Annual Sales Value (US$ Million), 2019-2023
- Figure 6-36: Global - Yescarta Quarterly Sales Value (US$ Million), 2023
- Figure 6-37: US - Yescarta Quarterly Sales Value (US$ Million), 2023
- Figure 6-38: EU - Yescarta Quarterly Sales Value (US$ Million), 2023
- Figure 6-39: ROW - Yescarta Quarterly Sales Value (US$ Million), 2023
- Figure 6-40: Global - Yescarta Quarterly Sales Value (US$ Million), 2022
- Figure 6-41: US - Yescarta Quarterly Sales Value (US$ Million), 2022
- Figure 6-42: EU - Yescarta Quarterly Sales Value (US$ Million), 2022
- Figure 6-43: ROW - Yescarta Quarterly Sales Value (US$ Million), 2022
- Figure 6-44: Uplizna - Approval Years by Region
- Figure 6-45: US - Unit & Supply Cost of Uplizna (US$), October'2023
- Figure 6-46: Global - Uplizna Annual Sales Value (US$), 2021-2023
- Figure 6-47: Global - Uplizna Quarterly Sales Value (US$ Million), 2023
- Figure 6-48: Global - Uplizna Quarterly Sales Value (US$ Million), 2022
- Figure 6-49: US - Tecartus Approval Years by Indications
- Figure 6-50: Tecartus - Approval Years by Region
- Figure 6-51: US - Tecartus List Price (US$), October'2023
- Figure 6-52: Global - Tecartus Annual Sales Value (US$ Million), 2020-2023
- Figure 6-53: US - Tecartus Annual Sales Value (US$ Million), 2020-2023
- Figure 6-54: EU - Tecartus Annual Sales Value (US$ Million), 2020-2023
- Figure 6-55: ROW - Tecartus Annual Sales Value (US$ Million), 2020-2023
- Figure 6-56: Global - Tecartus Quarterly Sales Value (US$ Million), 2023
- Figure 6-57: US - Tecartus Quarterly Sales Value (US$ Million), 2023
- Figure 6-58: EU - Tecartus Quarterly Sales Value (US$ Million), 2023
- Figure 6-59 ROW - Tecartus Quarterly Sales Value (US$ Million), 2023
- Figure 6-60: Global - Tecartus Quarterly Sales Value (US$ Million), 2022
- Figure 6-61: US - Tecartus Quarterly Sales Value (US$ Million), 2022
- Figure 6-62: EU - Tecartus Quarterly Sales Value (US$ Million), 2022
- Figure 6-63 ROW - Tecartus Quarterly Sales Value (US$ Million), 2022
- Figure 6-64: Monjuvi - Approval Years by Region
- Figure 6-65: Monjuvi - Patent Expiry Years by Region
- Figure 6-66: US - Supply Cost of Monjuvi (US$), October'2023
- Figure 6-67: Global - Monjuvi Annual Sales Value (US$ Million), 2020-2023
- Figure 6-68: US - Monjuvi Annual Sales Value (US$ Million), 2020-2023
- Figure 6-69: ROW - Monjuvi Annual Sales Value (US$ Million), 2020-2023
- Figure 6-70: Global - Monjuvi Quarterly Sales Value (US$ Million), 2023
- Figure 6-71: US - Monjuvi Quarterly Sales Value (US$ Million), 2023
- Figure 6-72: ROW - Monjuvi Quarterly Sales Value (US$ Million), 2023
- Figure 6-73: Global - Monjuvi Quarterly Sales Value (US$ Million), 2022
- Figure 6-74: US - Monjuvi Quarterly Sales Value (US$ Million), 2022
- Figure 6-75: ROW - Monjuvi Quarterly Sales Value (US$ Million), 2022
- Figure 6-76: Breyanzi - Approval Years by Region
- Figure 6-77: Breyanzi - Estimated Minimum Market Exclusivity Years
- Figure 6-78: US - Supply Cost of Breyanzi (US$), October'2023
- Figure 6-79: Global - Breyanzi Annual Sales Value (US$ Million), 2021-2023
- Figure 6-80: US - Breyanzi Annual Sales Value (US$ Million), 2021-2023
- Figure 6-81: ROW - Breyanzi Annual Sales Value (US$ Million), 2021-2023
- Figure 6-82: Global - Breyanzi Quarterly Sales Value (US$ Million), 2023
- Figure 6-83: US - Breyanzi Quarterly Sales Value (US$ Million), 2023
- Figure 6-84: ROW - Breyanzi Quarterly Sales Value (US$ Million), 2023
- Figure 6-85: Global - Breyanzi Quarterly Sales Value (US$ Million), 2022
- Figure 6-86: US - Breyanzi Quarterly Sales Value (US$ Million), 2022
- Figure 6-87: ROW - Breyanzi Quarterly Sales Value (US$ Million), 2022
- Figure 6-88: Zynlonta - Approval Years by Region
- Figure 6-89: Zynlonta - Recommended Dose for Initial & Subsequent Cycles (mg/kg)
- Figure 6-90: Zynlonta - Single Cycle & Annual Treatment Cost (US$)
- Figure 6-91: Global - Zynlonta Annual Sales Value (US$ Million), 2021-2023
- Figure 6-92: Global - Zynlonta Quarterly Sales Value (US$ Million), 2023
- Figure 6-93: Global - Zynlonta Quarterly Sales Value (US$ Million), 2022
- Figure 6-94: Carteyva - NMPA Approval Years by Indication
- Figure 6-95: Global - Carteyva Annual Sales Value (US$ Million), 2021-2023
- Figure 6-96: Global - Carteyva Half-Yearly Sales Values (US$ Million), 2021-2023
- Figure 7-1: Global - CD19 Antibodies Trials by Country (Numbers), 2023 Till 2028
- Figure 7-2: Global - CD19 Antibodies Trials by Indication (Numbers), 2023 Till 2028
- Figure 7-3: Global - CD19 Antibodies Trials by Phase (Numbers), 2023 Till 2028
- Figure 7-4: Global - CD19 Antibodies Trials by Therapy Class (Numbers), 2023 Till 2028
“Global CD19 Antibody Market & Clinical Pipeline Outlook 2028” Report Highlights:
- Global CD19 Antibody Market Opportunity: > USD 10 Billion By 2028
- Commercially Approved CD19 Antibodies: 10 Antibodies
- Annual, Quarterly & Regional Sales Insight On Approved CD19 Antibodies
- Dosage & Price Insight On Approved CD19 Antibodies
- Comprehensive Insights On CD19 Antibodies In Clinical Trials: > 190 Antibodies
- Global CD19 Antibodies Clinical Trials By Company, Indication & Phase
- Competitive Landscape: Insight On 30 companies
CD19 targeting therapies have emerged as another revolutionary class of immunotherapies in the past decade. These therapies, which consist of monoclonal antibodies, a bispecific antibody, an antibody-drug conjugate and chimeric antigen receptor T-cell (CAR-T) therapies, have captured the attention of both the clinical and commercial spheres in the global pharmaceutical industry. The patient and physician response to these therapies has been favorable as well, which can be gathered from the fact that the market of CD19-targeting therapies increased by almost 50% in 2021, and 40% in 2022. This can be attributed to the rapid regulatory approvals, and the current pipeline of investigational CD19-targeting therapies shows potential for a further surge of this market cap.
CD19-targeting therapies have made a significant impact on the clinical landscape of cancer treatment. They are primarily used for treating B-cell malignancies such as non-Hodgkin lymphoma (NHL) like acute lymphocytic leukemia (ALL), and large B-cell lymphoma (LBCL). The clinical efficacy of these therapies, especially CAR-T therapies like Kymriah and Yescarta, has been remarkable, leading to high response rates and prolonged remissions in a substantial proportion of patients, making them a promising treatment options. However, CAR-T therapies are not without challenges. Cytokine release syndrome (CRS) and neurotoxicity are often associated with CAR-T therapies; however, researchers have found ways to manage these.
Unlike some traditional therapies, CD19-targeting therapies have shown the potential for long-lasting responses. Patients who achieve remission can remain disease-free for extended periods, significantly improving their quality of life. Moreover, CD19-targeting therapies also represent a big step towards personalized medicine. They are tailored to each patient's unique immune system and the characteristics of their cancer cells, making them a highly individualized treatment.
CD19-targeting therapies have also become a focal point for pharmaceutical companies. The pharmaceutical industry has seen intense competition in the development and commercialization of CD19-targeting therapies. Established giants like Novartis, Amgen, and Gilead have played a significant role but smaller biotech firms are also entering the market now, bringing with them innovative treatments. An example of this is Uplizna, which was developed by Viela Bio, though now a part of Amgen.
At present, nine CD19-targeting therapies have received approval from the regulatory bodies. These are the bispecific antibody Blincyto, the monoclonal antibodies Uplizna and Monjuvi, the antibody-drug conjugate Zynlonta, and the CAR-T therapies Kymriah, Yescarta, Tecartus, Breyanzi, and Carteyva. While the first eight have FDA approvals, Carteyva only has a regional approval in China, where JW Therapeutics markets it.
The continued success of these therapies in the market has been encouraging for the research and development sector of the pharmaceutical market, and as a result, several new CD19-targeting therapies have entered the development and clinical trial pipelines. A majority of these are CD19-targeting CAR-T therapies, which are being developed for hematological cancers such as acute lymphocytic leukemia (ALL) and chronic lymphocytic leukemia (CLL) among other non-Hodgkin lymphomas. This is closely followed by disorders of the immune system, such as autoimmune diseases like systemic lupus erythematosus (SLE) Sjogren's syndrome and systemic scleroderma.
The regulatory bodies have also been instrumental in encouraging the development of CD19-targeting therapies by granting several of them special drug designations. The FDA, for instance, granted the Fast Track designation to KYV-101, IMPT-314 and CABA-201, which have been developed by Kyverna Therapeutics, ImmPACT Bio' and Cabaletta Bio, respectively. In addition, the FDA also accepted the IND applications of many candidates recently, with the newest being Kyverna's KYV-101 for the treatment of diffuse cutaneous systemic sclerosis in October 2023.
The market has also seen some collaborations happening lately for the research and development of innovative CD19-targeting therapies, having characteristics unprecedented by the approved CD19-targeting therapies, which are anticipated to give these an edge in the market upon approval. This includes the use of proprietary platforms to help cut down on the cost and time spent in the development of these therapies.
Thus, the market of CD19-targeting therapies is quite vibrant and dynamic, and is currently being driven by several factors. Moreover, as research finds use of CD19-targeting therapies in newer indications, it is obvious that the therapeutic potential of the CD19 protein remains to be fully uncovered. New market entrants have been increasing the competition within the market, which is expected to be one of the major factors driving innovation at present.
Table of Contents
1. Research Methodology
2. Approved CD19 Targeting Therapies
3. Global CD19 Antibodies Market Dynamics
- 3.1. Current Market Trends & Developments
- 3.2. Future Growth Avenues
4. CD19 Targeting Therapies Clinical Trials & Market Insight by Indication
- 4.1. Hematological Cancers
- 4.1.1. Leukemia
- 4.1.2. Lymphoma
- 4.2. Solid Cancers
- 4.3. Immune System Diseases
5. CD19 Targeting Therapies Market Dynamics by Region
- 5.1. US
- 5.2. China
- 5.3. EU
- 5.4. Canada
- 5.5. Australia
6. Global CD19 Market Sales & Price insight By Approved Drugs
- 6.1. Blincyto - 1st CD19 Targeting Therapy
- 6.1.1. Overview & Patent Insight
- 6.1.2. Pricing & Dosage Insight
- 6.1.3. Sales Analysis
- 6.2. Kymriah - 1st Anti-CD19 CAR T Cell Therapy
- 6.2.1. Overview
- 6.2.2. Pricing & Dosage Insight
- 6.2.3. Sales Analysis
- 6.3. Yescarta
- 6.3.1. Overview & Patent Insight
- 6.3.2. Pricing & Dosage
- 6.3.3. Sales Analysis
- 6.4. Uplizna - 1st Anti-CD19 Monoclonal Antibody
- 6.4.1. Overview & Patent Insight
- 6.4.2. Pricing & Dosage
- 6.4.3. Sales Analysis
- 6.5. Tecartus
- 6.5.1. Overview
- 6.5.2. Pricing & Dosage
- 6.5.3. Sales Analysis
- 6.6. Monjuvi
- 6.6.1. Overview & Patent Insight
- 6.6.2. Pricing & Dosage
- 6.6.3. Sales Analysis
- 6.7. Breyanzi
- 6.7.1. Overview & Patent Insight
- 6.7.2. Pricing & Dosage
- 6.7.3. Sales Analysis
- 6.8. Zynlonta - 1st CD19-Targeted ADC Therapy
- 6.8.1. Overview & Patent Insight
- 6.8.2. Pricing & Dosage
- 6.8.3. Sales Analysis
- 6.9. Carteyva
- 6.9.1. Overview & Patent Insight
- 6.9.2. Sales Analysis
- 6.10. NexCAR19 - 1st CD19 Targeting CAR T Cell Therapy
7. Global CD19 Antibodies Clinical Trials Overview
- 7.1. By Country
- 7.2. Indication
- 7.3. Phase
- 7.4. Therapy Class
8. Global CD19 Antibodies Clinical Trials By Company, Indication & Phase
- 8.1. Research
- 8.2. Preclinical
- 8.3. Phase-I
- 8.4. Phase-I/II
- 8.5. Phase-II
- 8.6. Phase-III
- 8.7. Preregistration
- 8.8. Registered
9. Commercially Approved CD19 Antibodies Clinical Insight
10. Competitive Landscape
- 10.1. AbbVie
- 10.2. Aleta Biotherapeutics
- 10.3. Autolus
- 10.4. Bristol-Myers Squibb
- 10.5. Cabaret Biotech
- 10.6. Cellectis
- 10.7. Cellular Biomedicine Group
- 10.8. Chongqing Precision Biotech Co., Ltd
- 10.9. CRISPR Therapeutics
- 10.10. Eureka Therapeutics
- 10.11. EXUMA Biotech
- 10.12. Fate Therapeutics
- 10.13. Galapagos NV
- 10.14. Gilead Sciences
- 10.15. Gracell Biotechnology
- 10.16. Guangzhou Bio-gene Technology
- 10.17. Hebei Senlang Biotechnology
- 10.18. ImmPACT Bio
- 10.19. Immvira Pharma
- 10.20. Innovative Cellular Therapeutics
- 10.21. Juventas Cell Therapy
- 10.22. Kite Pharma
- 10.23. Kyverna Therapeutics
- 10.24. MedTherapy
- 10.25. Memorial Sloan-Kettering Cancer Center
- 10.26. Nanjing Bioheng Biotech
- 10.27. Nanjing IASO Biotherapeutics
- 10.28. Poseida Therapeutics
- 10.29. Precision Biosciences
- 10.30. Sana Biotechnology
