|
|
市場調査レポート
商品コード
1359152
CD3抗体の世界市場:用量、薬価、売上、臨床試験動向(2028年)Global CD3 Antibodies Market, Dosage, Price, Sales & Clinical Trials Insight 2028 |
||||||
|
|
|||||||
|
|||||||


| CD3抗体の世界市場:用量、薬価、売上、臨床試験動向(2028年) |
|
出版日: 2023年10月01日
発行: KuicK Research
ページ情報: 英文 470 Pages
納期: 即日から翌営業日
|

- 全表示
- 概要
- 図表
- 目次
世界のCD3抗体の市場規模は、2028年までに50億米ドルを超えると予測されています。
CD3は細胞内シグナル伝達の重要な構成要素であり、抗原の認識とT細胞応答の下流刺激において重要な役割を担っています。免疫系、その活性化と抑制、そして様々な疾患におけるその後の影響に関する研究者の知識が深まるにつれ、CD3タンパク質は様々な疾患において重要な治療可能性を持つ有望なターゲットとして浮上してきました。長年にわたり、CD3の活性を調節することによる治療効果を評価するために、いくつかのCD3抗体や抗CD3抗体が開発され、承認済み適応症で良好な成績を収めているCD3抗体や抗CD3抗体の市場参入につながっています。CD3抗体の市場は、癌を適応症とするものが多いが、非常にダイナミックであり、未発見の可能性も多く、開拓すべき領域です。
最初に承認済みCD3抗体はMuromonab-CD3で、これに続いてRemovab(Catumaxomab)が承認されました。しかし、これらのCD3抗体はいずれも臨床的、商業的に異なる理由で市場から撤退しましたが、それでもCD3抗体市場のパイオニアとしての地位を確立しました。これらの後に市場に登場した新しいCD3抗体は、様々な改良が加えられ、異なる技術基盤に基づいていたため、先発品と同じ運命を避けることができました。その結果、FDAとEMAから承認を受けている抗体は9種類となっています。
CD3抗体の臨床開発に関しては、様々な癌の適応症が優位を占めています。承認済みCD3抗体は、多発性骨髄腫、リンパ腫、ぶどう膜黒色腫、白血病の治療薬として承認されており、開発中のCD3抗体候補についても同様の動向が見られます。さらに、これらの候補の大部分は、Blincytoや癌への使用が承認されている他のCD3抗体と同様の作用機序に従う二重特異性抗体(正確にはT細胞エンゲイジャー)として開発されています。
現在の商業的動向からすると、CD3抗体市場は様々な要因が市場に好影響を与えており、活況を呈しているように見えます。その中でもCD3抗体の世界市場規模は、新しい抗体が承認され市場に導入されるにつれて四半期ごとに増加しています。もう一つの要因は、重要な製薬企業が関与していることで、CD3抗体のトップに関連する成功の可能性と経済的リターンを高めています。独自のCD3 T細胞エンゲージャーの開発を可能にする独自のプラットフォームの発明と使用により、開発者は希少な適応症のための新規抗体を構築することができ、オーファンドラッグ指定などの規制上の利点がもたらされました。全体として、世界のCD3抗体市場は巨大な可能性を秘めていますが、その多くはまだ比較的未開拓な状態となっています。
当レポートは、世界のCD3抗体市場について調査し、市場の概要とともに、薬剤動向、臨床試験動向、地域別動向、および市場に参入する企業の競合情勢などを提供しています。
目次
第1章 調査手法
第2章 CD3指向性薬剤のイントロダクション
第3章 CD3抗体の作用機序
- 免疫抑制療法として
- 免疫活性化療法として
第4章 CD3抗体の適用、適応症別
- 癌
- 炎症および自己免疫疾患
第5章 世界のCD3抗体市場と臨床試験の見通し
- 現在の市場動向、開発、臨床試験の評価
- 売上分析
- 将来の市場機会
第6章 CD3標的抗体市場情勢、地域別
- 米国
- EU
- カナダ
- 英国
- 日本
第7章 承認済みCD3抗体の用量、特許、価格および販売に関する洞察
第8章 世界のCD3抗体臨床試験の概要
- 会社別
- 国別
- 適応症別
- 相別
- 患者セグメント別
第9章 企業、適応症、相別の世界のCD3抗体臨床試験の洞察
- 研究
- 前臨床
- 第I相
- 第I/II相
- 第Ⅱ相
- 第III相
- 事前登録
第10章 企業別および適応症別の市販CD3抗体の臨床洞察
第11章 世界のCD3阻害剤市場力学
- 促進要因と機会
- 課題と抑制要因
第12章 競合情勢
- Abpro Therapeutics
- Adagene
- Amgen
- Astellas Pharma
- Beijing Mabworks Biotech
- BioAtla
- Genentech
- Genmab
- Harbour BioMed
- Harpoon Therapeutics
- IGM Biosciences
- Immunocore
- Integral Molecular
- ITabMed
- Janssen Research & Development
- Janux Therapeutics
- KeyMed Biosciences
- Light Chain Bioscience
- Linton Pharm
- MacroGenics
- Memorial Sloan-Kettering Cancer Center
- Pfizer
- Qilu Pharmaceutical
- Regeneron Pharmaceuticals
- Roche
- Sichuan Baili Pharmaceutical
- SystImmune
- Takeda
- Xencor
- Zymeworks
List of Tables
- Table 7-1: Blincyto - Recommended Dosage & Schedule for the Treatment of MRD-positive B-cell Precursor ALL
- Table 7-2: Blincyto - Recommended Dosage & Schedule for Treatment of Relapsed or Refractory B-cell Precursor ALL
- Table 7-3: Blincyto - Recommended Dose Modifications
- Table 7-4: Kimmtrak - Recommended Dosage for Treatment of Unresectable or Metastatic Uveal Melanoma
- Table 7-5: Kimmtrak - Dose Modifications for Adverse Reactions
- Table 7-6: Tecvayli - Dosing Schedule
- Table 7-7: Tecvayli - Recommended Dosage Modifications for Adverse Reactions
- Table 7-8: Tzield - Recommended Dosage and Administration
- Table 7-9: Lunsumio - Recommended Dose & Schedule for 21-Day Treatment Cycles
- Table 7-10: Lunsumio - Recommendations for Management of Cytokine Release Syndrome
- Table 7-11: Lunsumio - Recommendations for Management of Neurologic Toxicity (Including ICANS)
- Table 7-12: Lunsumio - Recommended Dosage Modification for Adverse Reactions
- Table 7-13: Columvi - Dosing Schedule (21-Day Treatment Cycles)
- Table 7-14: Columvi - Recommendations for Management of Cytokine Release Syndrome
- Table 7-15: Columvi - Recommendations for Management of Neurologic Toxicity (Including ICANS)
- Table 7-16: Columvi - Recommended Dosage Modification for Adverse Reactions
- Table 7-17: Epkinly - Dosage Schedule
- Table 7-18: Epkinly - Recommendations for Management of Cytokine Release Syndrome
- Table 7-19: Epkinly - Recommendations for Management of Immune Effector Cell- Associated Neurotoxicity Syndrome (ICANS)
- Table 7-20: Epkinly - Recommended Dosage Modifications for Other Adverse Reactions
- Table 7-21: Talvey - Weekly Dosing Schedule
- Table 7-22: Talvey - Biweekly Dosing Schedule
- Table 7-23: Talvey - Recommendations for Management of CRS
- Table 7-24: Talvey - Recommendations for Management of Immune Effector Cell-Associated Neurotoxicity Syndrome (ICANS)
- Table 7-25: Talvey - Recommendations for Management of Neurologic Toxicity (excluding ICANS)
- Table 7-26: Talvey - Recommended Dosage Modifications for Other Adverse Reactions
- Table 7-27: Elrexfio - Dosing Schedule
- Table 7-28: Elrexfio - Recommendations for Management of CRS
- Table 7-29: Elrexfio - Recommended Dosage Modifications for Other Adverse Reactions
List of Figures
- Figure 2-1: TCR-CD3 Structure
- Figure 2-2: BiTE - Amgen
- Figure 2-3: Development & Evolution of CD3 Targeting Antibodies
- Figure 3-1: Bispecific T cell Engaging Antibody
- Figure 4-1: Elranatamab Phase III MAGNETISMM-5 Study - Initiation & Completion Years
- Figure 4-2: Elranatamab Phase III MagnetisMM-7 Study - Initiation & Completion Years
- Figure 4-3: Elranatamab Phase III MagnetisMM-6 Study - Initiation & Completion Years
- Figure 4-4: Epcoritamab Phase III EPCORE DLBCL-1 Study - Initiation & Completion Years
- Figure 4-5: Epcoritamab Phase III EPCORE FL-1 Study - Initiation & Completion Years
- Figure 4-6: Epcoritamab Phase III Study - Initiation & Completion Years
- Figure 4-7: Talquetamab Phase III MonumenTAL-3 Study - Initiation & Completion Years
- Figure 4-8: Glofitamab Phase III Study - Initiation & Completion Years
- Figure 4-9: LINKER-MM3 Phase III Study - Initiation & Completion Years
- Figure 4-10: Tzield - Mechanism of Action
- Figure 5-1: Global - CD3 Antibodies Sales (US$ Million), 2019 - 2023
- Figure 5-2: Global - CD3 Antibodies Sales Shares (US$ Million), H1'2023
- Figure 5-3: Global - CD3 Antibodies Sales Shares (%), H1'2023
- Figure 5-4: Global - CD3 Antibodies Sales (US$ Million), 2023 - 2028
- Figure 6-1: US vs ROW - CD3 Antibodies Market By Region (US$ Million), 2022-2023
- Figure 6-2: US vs ROW - CD3 Antibodies Market By Region (%), H1'2023
- Figure 6-3: US vs ROW - CD3 Antibodies Market By Region (%), 2022
- Figure 6-4: US vs ROW - CD3 Antibodies Market By Region (US$ Million), 2021
- Figure 6-5: US vs ROW - CD3 Antibodies Market By Region (%), 2021
- Figure 7-1: Blincyto - Approval Years by Region
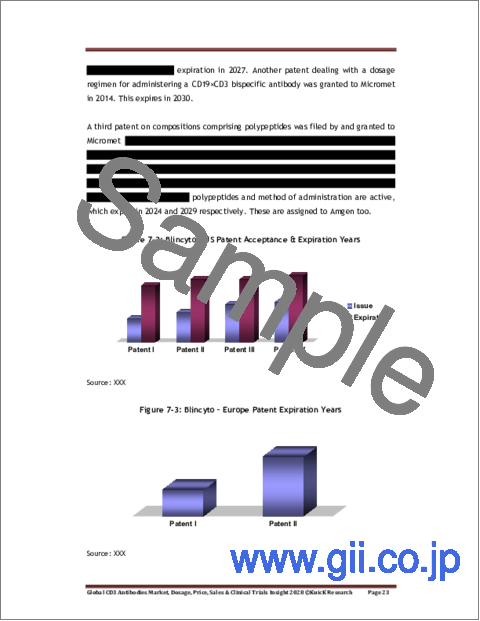
- Figure 7-2: Blincyto - US Patent Acceptance & Expiration Years
- Figure 7-3: Blincyto - Europe Patent Expiration Years
- Figure 7-4: Blincyto - Treatment Course of MRD-Positive B-cell precursor ALL
- Figure 7-5: Blincyto - Duration of Treatment Phase & Resting Phase in Induction & Consolidation Cycles for Treatment of MRD-Positive B-cell precursor (Days)
- Figure 7-6: Blincyto - Cost of Single Cycle & Treatment Course for the Treatment of MRD-positive B-cell Precursor ALL
- Figure 7-7: Blincyto - Recommended Number of Induction & Consolidation Treatment Cycle for Relapsed B-Cell Precursor ALL
- Figure 7-8: Blincyto - Duration of Single Induction, Consolidation, Continued Cycle & Full Treatment for Relapsed B-Cell Precursor ALL (Weeks)
- Figure 7-9: Blincyto - Cost of Single Cycle & Treatment Course for Treatment for Relapsed B-Cell Precursor ALL
- Figure 7-10: Global - Blincyto Sales (US$ Million), 2019-2023
- Figure 7-11: US - Blincyto Sales (US$ Million), 2019-2023
- Figure 7-12: ROW - Blincyto Sales (US$ Million), 2019-2023
- Figure 7-13: Global - Quarterly Blincyto Sales (US$ Million), H1'2023
- Figure 7-14: US - Quarterly Blincyto Sales (US$ Million), H1'2023
- Figure 7-15: ROW - Quarterly Blincyto Sales (US$ Million), H1'2023
- Figure 7-16: Global - Quarterly Blincyto Sales (US$ Million), 2022
- Figure 7-17: US - Quarterly Blincyto Sales (US$ Million), 2022
- Figure 7-18: ROW - Quarterly Blincyto Sales (US$ Million), 2022
- Figure 7-19: Kimmtrak - Approval Years by Region
- Figure 7-20: Kimmtrak - Cost Per Unit & Per Vial (US$), October'2023
- Figure 7-21: Global - Kimmtrak Sales (US$ Million), 2022-H1'2023
- Figure 7-22: Global - Quarterly Kimmtrak Sales (US$ Million), H1'2023
- Figure 7-23: Kimmtrak - Sales by Region (US$ Million), H1'2023
- Figure 7-24: US - Quarterly Kimmtrak Sales (US$ Million), H1'2023
- Figure 7-25: EU - Quarterly Kimmtrak Sales (US$ Million), H1'2023
- Figure 7-26: ROW - Quarterly Kimmtrak Sales (US$ Million), H1'2023
- Figure 7-27: Global - Quarterly Kimmtrak Sales (US$ Million), 2022
- Figure 7-28: Kimmtrak - Sales by Region (US$ Million), 2022
- Figure 7-29: US - Quarterly Kimmtrak Sales (US$ Million), 2022
- Figure 7-30: EU - Quarterly Kimmtrak Sales (US$ Million), 2022
- Figure 7-31: ROW - Quarterly Kimmtrak Sales (US$ Million), 2022
- Figure 7-32: Tecvayli - Approval Years by Region
- Figure 7-33: Tecvayli - Patent Acceptance & Expiration Years
- Figure 7-34: US - Cost Of 10 mg/ ml Tecvayli Vial (US$), October'2023
- Figure 7-35: US - Cost Of 90 mg/mL Vial Tecvayli (US$), October'2023
- Figure 7-36: EU - Cost of 1 mg/ml Vial Tecvayli (EUR v/s US$), October'2023
- Figure 7-37: EU - Cost of 90 mg/mL Vial Tecvayli (EUR v/s US$), October'2023
- Figure 7-38: Tzield - Approval Years by Region
- Figure 7-39: Tzield - Cost Of 2 ml Vial (US$), October'2023
- Figure 7-40: Tzield - Cost Of 20 ml Vial (US$), October'2023
- Figure 7-41: Tzield - Cost Of 28 ml Vial (US$), October'2023
- Figure 7-42: Lunsumio - Approval Years by Region
- Figure 7-43: US - Cost Of 1 mg/ml Lunsumio Vial (US$), October'2023
- Figure 7-44: US - Cost Of 30 mg/30 ml Lunsumio Vial (US$), October'2023
- Figure 7-45: EU - Cost of 1 mg/ml Lunsumio Vial (EUR v/s US$), October'2023
- Figure 7-46: EU - Cost Of 30 mg/30 ml Lunsumio Vial (EUR v/s US$), October'2023
- Figure 7-47: Global - Lunsumio Sales (US$ Million), 2022-2023
- Figure 7-48: Regional - Lunsumio Quarterly Sales (US$ Million), H1'2023
- Figure 7-49: Regional - Lunsumio Quarterly Sales (US$ Million), H1'2023
- Figure 7-50: Lunsumio - Quarterly Sales (US$ Million), Q3-Q4'2022
- Figure 7-51: Columvi - Approval Years by Region
- Figure 7-52: EU - Cost of 2.5 mg/2.5 mL Columvi Vial (EUR v/s US$), October'2023
- Figure 7-53: EU - Cost 10 mg/10 mL Columvi Vial (EUR v/s US$), October'2023
- Figure 7-54: Epkinly - Approval Years by Region
- Figure 7-55: US - Cost of Epkinly (US$), October'2023
- Figure 7-56: EU - Cost of Epkinly (EUR v/s US$), October'2023
- Figure 7-57: Global - Epkinly Sales (US$ Million), 2023
- Figure 7-58: Global - Quarterly Epkinly Sales (US$ Million), 2023
- Figure 7-59: Talvey - Approval Years by Region
- Figure 7-60: Talquetamab - FDA & EMA Designation Years
- Figure 7-61: Talvey - Patent Acceptance & Expiration Years
- Figure 7-62: Elrexfio - Approval Years by Region
- Figure 7-63: Elranatamab - FDA & EMA Designation Years
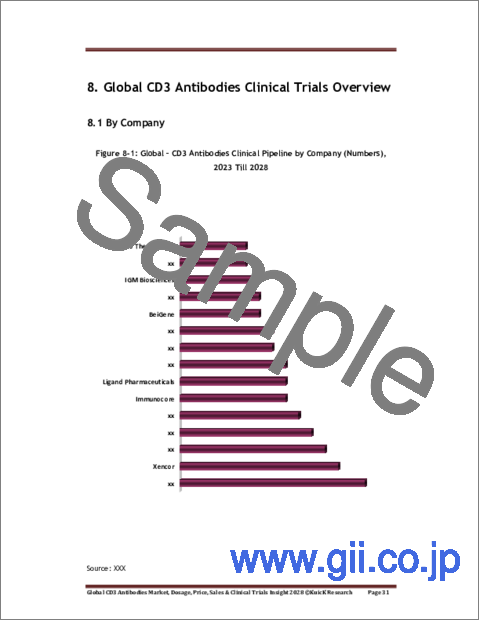
- Figure 8-1: Global - CD3 Antibodies Clinical Pipeline by Company (Numbers), 2023 Till 2028
- Figure 8-2: Global - CD3 Antibodies Clinical Pipeline by Country (Numbers), 2023 Till 2028
- Figure 8-3: Global - CD3 Antibodies Clinical Pipeline by Indication (Numbers), 2023 Till 2028
- Figure 8-4: Global - CD3 Antibodies Clinical Pipeline by Phase (Numbers), 2023 Till 2028
- Figure 8-5: Global - CD3 Antibodies Clinical Pipeline by Patient Segment (Numbers), 2023 Till 2028
“Global CD3 Antibodies Market, Dosage, Price, Sales & Clinical Trials Insight 2028” Report Highlights:
- Global CD3 Antibodies Market Opportunity: > USD 5 Billion By 2028
- Global & Regional Market Trends Analysis
- Current Market Trends, Developments & Clinical Trials Assessment
- CD3 Antibodies Clinical Trials Insight By Company, Country, Indication & Phase
- Clinical Insight On 250 CD3 Antibodies In Clinical Trials
- Dosage, Patent, Pricing & Sales Insight on Approved Antibodies
- Clinical Insight On 9 Commercially Approved CD3 Antibodies
- Clinical Trials, Dosage, Price & Sales Analysis Representations In 100 Graphs & Tables
CD3 is an important component of intracellular signaling and has a critical role in recognition of antigens and the downstream stimulation of T cell response. With the deepening of researchers' knowledge about the immune system, its activation and suppression, and the subsequent effects in different diseases, CD3 protein has emerged as a promising target that has significant therapeutic potential in various diseases. Over the years, several CD3 antibodies and anti-CD3 antibodies have been developed to assess the therapeutic effects of regulating the activity of CD3, which has led to the market entry of several CD3 antibodies and anti-CD3 antibodies that are performing well in their approved indications. The market for CD3 antibodies, though leans more towards cancer indications, is quite dynamic, with a lot of undiscovered potential, making it a domain to explore.
The first CD3 antibody to receive approval was Muromonab-CD3; this was followed by the approval of Removab (Catumaxomab). However, both these CD3 antibodies were withdrawn from the market for different clinical and commercial reasons, but, nevertheless, positioned themselves as pioneers of the CD3 antibodies market. Newer CD3 antibodies that entered the market after these had various modifications and were based on different technological platforms, which enabled them to avoid the same fate as their predecessors. As a result, there are nine antibodies, which have regulatory approvals from the FDA and EMA.
Among these nine, Blincyto (CD19 × CD3) was the first to receive approval; it was approved in 2014 and entered the market in 2015, which allowed it to have a head start in the global CD3 antibodies market in terms of commercial performance. Sales of Blincyto have been increasing year because of its increasing uptake, which has been attributed to the drug being one of the most effective immunotherapies for acute lymphoblastic leukemia. Blincyto collected revenue of US$ 583 million in the year 2022, and in the first half of 2023, the drug has already generated a revenue of US$ 400 million, making it a dominating player in the global CD3 antibodies market.
It is also important to mention that the remaining eight CD3 antibodies were all approved in the years 2022 and 2023, and are only approved in limited regions, which has been disadvantageous for their sales and their share in the global CD3 antibodies market. All these were approved under the FDA's accelerated approval program and the EMA's conditional marketing approval program, and their continued approvals are awaited. Nevertheless, their developers are seeking approvals in other regions, which will help them generate more revenues in the market, potentially giving competition to Blincyto's stance in the global market.
In terms of the clinical development of CD3 antibodies, different cancer indications are dominating. The approved CD3 antibodies have been approved to treat multiple myeloma, lymphoma, uveal melanoma and leukemia, and the same trend is being seen for CD3 antibody candidates in development. Moreover, a majority of these candidates are being developed as bispecific antibodies - T cell engagers to be precise - following a similar mechanism of action as Blincyto and other CD3 antibodies approved for use in cancer. Lindis Biotech, BioAtla, AstraZeneca, Regeneron, and Amgen are some pharmaceutical companies that have CD3 bispecific T cell engagers in development.
Based on current commercial trends, the market for CD3 antibodies appears to be thriving, with various factors favorably influencing the market. Among these is the global market value of CD3 antibodies, which has been increasing every quarter as new antibodies are approved and introduced into the market. Another factor is the involvement of important pharmaceutical corporations, which boosts the likelihood of success and financial returns associated with top CD3 antibodies. The invention and use of proprietary platforms, which enabled the development of unique CD3 T cell engagers, allowed developers to construct novel antibodies for rare indications, which came with regulatory benefits such as orphan drug designation. Overall, the global CD3 antibody market has enormous potential, much of which is yet relatively untapped.
Table of Contents
1. Research Methodology
2. Introduction To CD3 Directed Drugs
- 2.1. Overview
- 2.2. History & Evolution of CD3 Directed Drugs
3. Mechanism of Action of CD3 Antibodies
- 3.1. As Immunosuppressive Therapy
- 3.2. As Immune Activation Therapy
4. Application of CD3 Antibodies By Indication
- 4.1. Cancer
- 4.2. Inflammatory & Autoimmune Conditions
5. Global CD3 Antibodies Market & Clinical Trials Outlook
- 5.1. Current Market Trends, Developments & Clinical Trials Assessment
- 5.2. Sales Analysis
- 5.3. Future Market Opportunities
6. CD3 Targeting Antibodies Market Landscape by Region
- 6.1. US
- 6.2. EU
- 6.3. Canada
- 6.4. UK
- 6.5. Japan
7. Approved CD3 Antibody Dosage, Patent, Price & Sales Insight
- 7.1. Blincyto - 1st Approved CD3 Antibody
- 7.2. Kimmtrak - 2nd Approved CD3 Antibody
- 7.3. Tecvayli - 3rd Approved CD3 Antibody
- 7.4. Others (6 More CD3 Antibodies)
8. Global CD3 Antibodies Clinical Trials Overview
- 8.1. By Company
- 8.2. By Country
- 8.3. By Indication
- 8.4. By Phase
- 8.5. By Patient Segment
9. Global CD3 Antibodies Clinical Trials Insight By Company, Indication & Phase
- 9.1. Research
- 9.2. Preclinical
- 9.3. Phase-I
- 9.4. Phase-I/II
- 9.5. Phase-II
- 9.6. Phase-III
- 9.7. Preregistration
10. Marketed CD3 Antibodies Clinical Insight By Company & Indication
11. Global CD3 Inhibitors Market Dynamics
- 11.1. Drivers & Opportunities
- 11.2. Challenges & Restraints
12. Competitive Landscape
- 12.1. Abpro Therapeutics
- 12.2. Adagene
- 12.3. Amgen
- 12.4. Astellas Pharma
- 12.5. Beijing Mabworks Biotech
- 12.6. BioAtla
- 12.7. Genentech
- 12.8. Genmab
- 12.9. Harbour BioMed
- 12.10. Harpoon Therapeutics
- 12.11. IGM Biosciences
- 12.12. Immunocore
- 12.13. Integral Molecular
- 12.14. ITabMed
- 12.15. Janssen Research & Development
- 12.16. Janux Therapeutics
- 12.17. KeyMed Biosciences
- 12.18. Light Chain Bioscience
- 12.19. Linton Pharm
- 12.20. MacroGenics
- 12.21. Memorial Sloan-Kettering Cancer Center
- 12.22. Pfizer
- 12.23. Qilu Pharmaceutical
- 12.24. Regeneron Pharmaceuticals
- 12.25. Roche
- 12.26. Sichuan Baili Pharmaceutical
- 12.27. SystImmune
- 12.28. Takeda
- 12.29. Xencor
- 12.30. Zymeworks
