
|
市場調査レポート
商品コード
1393959
細胞・遺伝子治療の資金調達と資本取引の分析:資金調達、提携、企業合併・買収 (M&A)、技術移転、IPO/SPAC、その他の取引 (2021年~2023年)Cell and Gene Therapy Funding and Deals Analysis: Financings, Partnering, M&A, Tech Transfers, IPOs/SPACs, Other Deals, 2021-2023 |
||||||
|
|||||||

| 細胞・遺伝子治療の資金調達と資本取引の分析:資金調達、提携、企業合併・買収 (M&A)、技術移転、IPO/SPAC、その他の取引 (2021年~2023年) |
|
出版日: 2023年12月08日
発行: Kalorama Information
ページ情報: 英文 290 Pages
納期: 即日から翌営業日
|

- 全表示
- 概要
- 目次
遺伝子治療や細胞治療の概念は何十年も前から研究されてきましたが、初期には大きな課題が存在していました。段階的な進歩を経て、CRISPRや次世代シーケンサー (NGS) のような実現可能なツールが徐々に導入されたことで、細胞・遺伝子治療は非常に活発な分野に浮上しました。現在では、実績のある多くの治療法が承認されています。
技術進歩により業界への参入障壁が低くなったため、1,500社を超える治療薬やツールの企業がこの分野に参入しています。
当レポートでは、2021年以降の細胞・遺伝子治療 (CGT) の取引活動を追跡しています。2021年から2023年までの四半期ごとの動向をグラフで提供しているほか、2022年第1四半期から2023年第3四半期までをカバーする2,000件以上の資本取引の具体的な詳細を掲載しています。最近、細胞・遺伝子治療 (CGT) 関連分野に多くの注目と資金が集まっています。追跡したCGT投資・買収やその他の案件は、2023年第1四半期から第3四半期にかけて200億米ドル以上に達しました。最も急成長している市場の1つであるCGTのビジネスチャンスをどう生かすか、そのためには、どのような案件がどのくらい行われているのか、誰がどのような案件をどのくらい行っているのか、案件の詳細を理解することが重要です。
当レポートの分析内容 (一部):
- 四半期ごとの資金調達額 (2021年~2023年)
- CGT分野の資本取引の詳細情報 (2022年~2023年):全2000件以上
- ベンチャーキャピタル (JV)/民間資金の件数 (四半期別)
- 複数のカテゴリー (VC、M&A、その他の分野) に分けて時系列で動向を紹介
- 種類別の資本取引動向:技術/調査/戦略的提携、ベンチャーキャピタル/民間投資、企業合併・買収 (M&A)・戦略的投資、ライセンス契約、株式公開/SPAC、製造・サプライチェーン、公的支援・慈善活動、教育、流通、共同マーケティング、スピンアウト、再編、ディールの完了/終了、ジョイントベンチャー、訴訟の和解
- 資本取引が最も活発な企業 (ディールのタイプ別 (企業合併・買収 (M&A)、戦略的投資、総合的取引、提携))
- 資本取引の地域別内訳 (%、北米・欧州・アジア太平洋・その他の地域)
- 最も頻繁に行われた資本調達の種類 (四半期ベース、カテゴリー別) (技術/調査/戦略的コラボレーション、ベンチャーキャピタル/民間投資、企業合併・買収 (M&A)・戦略的投資、ライセンス契約、株式公開/SPAC、製造・サプライチェーン)(総数)
細胞・遺伝子治療は非常に競争の激しい市場となりつつあるため、当レポートでは1000社以上の企業について具体的に言及しています。
目次
第1章 エグゼクティブサマリー
- イントロダクション
- 2023年の最初の9か月間で271億米ドルの投資
- 四半期ごとの資金調達額
- 四半期ごとの資金調達額:カテゴリー別シェア (2021年第1四半期~2023年第3四半期)
- 四半期ごとの取引件数:カテゴリー別 (2021年第1四半期~2023年第3四半期)
- コラボレーション・製造/サプライチェーン取引・ライセンス契約・流通/共同マーケティングの拡大が、細胞・遺伝子治療の活動を強調
- 頻度の低いCGT取引タイプの概要
- 最も活発な企業
第2章 ベンチャーキャピタル (VC) と民間資金
- 流動的なVC/民間資金
第3章 戦略的投資
- 細胞・遺伝子治療への戦略的投資
第4章 IPO・FPO・SPAC
- 北米では収益の大部分がIPO・FPO・SPACから得られる
第5章 企業合併・買収 (M&A)
- 平均金額は低下するも、M&A件数は増加
第6章 技術/調査/戦略コラボレーション
- CGT市場では幅広いコラボレーションが見られる
第7章 ライセンス契約
- 細胞・遺伝子治療市場におけるライセンス契約の安定的レベル
第8章 製造・サプライチェーン
- CGTにおける製造・サプライチェーン管理活動の大幅な成長
第9章 公的支援・教育、慈善活動
- CGT市場は公的支援、患者/消費者/研修生の教育、慈善活動にあまり焦点を当てていない
第10章 流通・共同マーケティング
- CGTの流通・共同マーケティング取引の概要
第11章 その他:JV、再編、解散、スピンオフ
- 細胞・遺伝子治療に影響を与える、その他の種類の取引の概略
While the concepts of gene therapy and cell therapy have been investigated for decades, there were major challenges in the early years. Through incremental progress, and the gradual introduction of enabling tools such as CRISPR and next-generation sequencing (NGS), cell and gene therapy has emerged into a highly active area. There are now many approved therapies with proven track records.
As the technologies have lowered the barriers to entry for the industry, over 1,500 therapy or tools companies have been created or have become involved in this field.
This report, Kalorama's “Cell and Gene Therapy Funding and Deals Analysis: Financings, Partnering, M&A, Tech Transfers, IPOs/SPACs, Other Deals, 2021-2023”, tracks the dealmaking activities in cell and gene therapy since 2021. The report provides informative graphs of quarterly trends from 2021-2023, and also includes the specific details of over 2,000 deals covering the Q1 2022-Q3 2023 period. A lot of attention and funding is being given to the areas related to cell and gene therapy (CGT) recently. Kalorama's tracked CGT investments, acquisitions, and other deals amounted to more than $20 billion in the first three quarters of 2023. Understanding the volumes of deals that have been made, who is making which type and how many, and the deals' details, is critical to finding how to take advantage of the opportunities in one of the fastest-growing markets.
Kalorama's report is designed to provide companies entering or already in this market with knowledge of the trends in deals that will shape future growth and competition.
The following is just some of the information in this report:
- Quarterly Funding Amounts 2021-2023
- Specific details of 2000+ CGT Deals from 2022-2023
- Venture Capital/Private Funding Round Amounts, By Quarter
- Chronological Trends Presented in Multiple Categories (VC, M&A, Other Areas)
- Deals by Type - Technology/Research/Strategic Collaboration; Venture Capital/Private Investment; Acquisition, Merger, Strategic Investment; Licensing; Public Offering/SPAC; Manufacturing, Supply Chain; Outreach, Philanthropy, Education; Distribution, Co-Marketing; Spinout, Restructure; Conclude/Terminate Deal; Joint Venture; and Settle Litigation
- Most Active Deal-Making Companies, by Type of Deal (Acquisition/Merger/ Strategic Investment, Overall Deals, Collaborations)
- Regional Breakdown of Dealmaking [North America, Europe, APAC, Rest of World] (%)
- Most Frequent Types of Deals, by Quarter, by Category [Technology/Research/Strategic Collaboration; Venture Capital/Private Investment; Acquisition, Merger, Strategic Investment; Licensing; Public Offering/SPAC; and Manufacturing, Supply Chain] (Total number)
No report published by a major market research publisher has tackled the current Cell and Gene Therapy dealmaking space more comprehensively.
There isn't a more comprehensive exploration of the current Cell and Gene Therapy dealmaking landscape by any major market research publisher. As Cell and Gene Therapy is becoming a highly competitive marketplace, over a thousand companies are specifically referenced in this report.
Table of Contents
Chapter 1: Executive Summary
- Introduction
- $27.1 Billion in Investment in First Nine Months of 2023
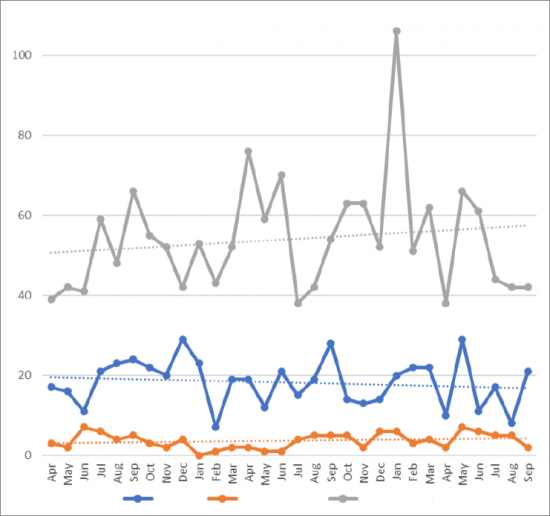
- Figure 1-1: Total Deals per Month, Apr 2021-Sep 2023 (count)
- Figure 1-2: Total Deals per Month by Type, Apr 2021-Sep 2023 [VC/Private, IPO/FPO/SPAC; and All Other Deals] (count)
- Quarterly Funding Amounts
- Table 1-1: Total Quarterly Funding, by Type, Q1-Q3 2023 [M&A; Venture Capital/Private; IPO/FPO; Collab; SPAC; and Strat inv] ($M)
- Table 1-2: Total Quarterly Funding, by Type, 2022 [M&A; Venture Capital/Private; IPO/FPO; Collab; SPAC; and Strat inv] ($M)
- Table 1-3: Total Quarterly Funding, by Type, 2021 [M&A; Venture Capital/Private; IPO/FPO; Collab; SPAC; and Strat inv] ($M)
- Figure 1-3: Total Quarterly Funding, Q1 2021- Q3 2023 ($M)
- Figure 1-4: Total Quarterly Funding, by Type, Q1 2021-Q3 2023 [M&A; Venture Capital/Private; IPO/FPO; Collab; SPAC; and Strat inv] ($M)
- Quarterly Funding Category Shares, Q1 2021 Through Q3 2023
- Table 1-4: Total Quarterly Funding Share, by Type, 2023 [M&A; Venture Capital/Private; IPO/FPO; Collab; SPAC; and Strat inv] (%)
- Table 1-5: Total Quarterly Funding Share, by Type, 2022 [M&A; Venture Capital/Private; IPO/FPO; Collab; SPAC; and Strat inv] (%)
- Table 1-6: Total Quarterly Funding Share, by Type, 2021 [M&A; Venture Capital/Private; IPO/FPO; Collab; SPAC; and Strat inv] ($M)
- Figure 1-5: Total Quarterly Funding Share, by Type, Q1 2021-Q3 2023 [M&A; Venture Capital/Private; IPO/FPO; Collab; SPAC; and Strat inv] (%)
- Figure 1-6: 2021 Funding Share, by Type of Funding [M&A; Venture Capital/Private; IPO/FPO; Collab; SPAC; and Strat inv] (%)
- Figure 1-7: 2022 Funding Share, by Type of Funding [M&A; Venture Capital/Private; IPO/FPO; Collab; SPAC; and Strat inv] (%)
- Figure 1-8: 2023 Funding Share, by Type of Funding [M&A; Venture Capital/Private; IPO/FPO; Collab; SPAC; and Strat inv] (%)
- Quarterly Deal Counts by Category, Q1 2021 - Q3 2023
- Table 1-7: Quarterly Count of Deals, By 2023 Quarter, By Category [Technology/Research/Strategic Collaboration; Venture Capital/Private Investment; Acquisition, Merger, Strategic Investment; Licensing; Public Offering/SPAC; Manufacturing, Supply Chain; Outreach, Philanthropy, Education; Distribution, Co-Marketing; Spinout, Restructure; Conclude/Terminate Deal; Joint Venture; and Settle Litigation] (total number) (%)
- Table 1-8: Quarterly Count of Deals, by 2022 Quarter, By Category [Technology/Research/Strategic Collaboration; Venture Capital/Private Investment; Acquisition, Merger, Strategic Investment; Licensing; Public Offering/SPAC; Manufacturing, Supply Chain; Outreach, Philanthropy, Education; Distribution, Co-Marketing; Spinout, Restructure; Conclude/Terminate Deal; Joint Venture; and Settle Litigation] (total number) (%)
- Table 1-9: Quarterly Count of Deals, by 2021 Quarter, By Category [Technology/Research/Strategic Collaboration; Venture Capital/Private Investment; Acquisition, Merger, Strategic Investment; Licensing; Public Offering/SPAC; Manufacturing, Supply Chain; Outreach, Philanthropy, Education; Distribution, Co-Marketing; Spinout, Restructure; Conclude/Terminate Deal; Joint Venture; and Settle Litigation] (total number) (%)
- Table 1-10: Yearly Shares of Number of Deals, By Category [Technology/Research/Strategic Collaboration; Venture Capital/Private Investment; Acquisition, Merger, Strategic Investment; Licensing; Public Offering/SPAC; Manufacturing, Supply Chain; Outreach, Philanthropy, Education; Distribution, Co-Marketing; Spinout, Restructure; Conclude/Terminate Deal; Joint Venture; and Settle Litigation], 2021-2023 partial (%)
- Growth in Collaborations, Manufacturing/Supply Chain Deals, Licensing, Distribution/ Co-Marketing Highlight Activity in Cell and Gene Therapy
- Figure 1-9: Yearly Shares of Number of Deals, By Category [Technology/Research/Strategic Collaboration; Venture Capital/Private Investment; Acquisition, Merger, Strategic Investment; Licensing; Public Offering/SPAC; Manufacturing, Supply Chain; Outreach, Philanthropy, Education; Distribution, Co-Marketing; Spinout, Restructure; Conclude/Terminate Deal; Joint Venture; and Settle Litigation], 2021-2023 partial (%)
- Figure 1-10: Most Frequent Types of Deals, by Quarter, by Category [Technology/Research/Strategic Collaboration; Venture Capital/Private Investment; Acquisition, Merger, Strategic Investment; Licensing; Public Offering/SPAC; and Manufacturing, Supply Chain], 2021-2023 partial (Total number)
- A Look at Less Frequent CGT Deal Types
- Figure 1-11: Lower Frequency Deal Types, by Quarter, by Category [Outreach, Philanthropy, Education; Distribution, Co-Marketing; Spinout, Restructure; Conclude/Terminate Deal; Joint Venture; and Settle Litigation] (total number)
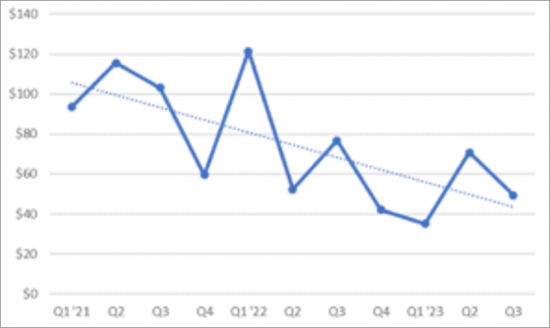
- Figure 1-12: Merger/ Acquisition Amount, by Quarter [Q1 2021 - Q3 2023] ($M)
- Figure 1-13: Venture Capital/Private Funding Round Amount, by Quarter [Q1 2021-Q3 2023] ($M)
- Figure 1-14: IPO/FPO Amount, by Quarter [Q1 2021-Q3 2023] ($M)
- Figure 1-15: SPAC Portion Amount, by Year 2021-2023 ($M)
- Most Active Companies
- Table 1-11: Most Active Companies in CGT Deals, Collaborations, Overall 2021-2023
- Figure 1-16: Most Active Companies in CGT Deals, Collaborations, Overall 2021-2023
Chapter 2: Venture Capital & Private Funding
- VC/Private Funding in Flux
- Figure 2-1: Total Number of VC/Private Funding Deals by Month, Jan 2021-Sep 2023 (count)
- Figure 2-2: Average VC/Private Funding Round Amount, by Quarter Q1 2021- Q1 2023 ($M)
- Table 2-1: Regional Venture Capital/Private Funding, by Quarter Q1 2021-Q3 2023, by Region[North America, Europe, APAC, Rest of World] ($M) (%)
- Figure 2-3: Quarterly Venture Capital/Private Total Funding, Q1 2021- Q1 2023, by Region [North America, Europe, APAC, Rest of World] ($M)
- Table 2-2: Regional Venture Capital/Private Funding Shares, by Quarter Q1 2021-Q3 2023, [North America, Europe, APAC, Rest of World] (%)
- Figure 2-4: Regional Venture Capital/Private Funding Shares, by Quarter Q1 2021-Q3 2023, by Region [North America, Europe, APAC, Rest of World] (%)
- Figure 2-5: Venture Capital/Private Funding Round Amounts, By Quarter [Q1 2021-Q3 2023] ($M)
- Figure 2-6: Scaled Venture Capital/Private Funding Round Amounts, By Quarter [Q1 2021-Q3 2023] ($M)
- Table 2-3: Venture Capital/Private Fundraising Deals, Q3 2023
- Table 2-4: Venture Capital/Private Fundraising Deals, Q2 2023
- Table 2-5: Venture Capital/Private Fundraising Deals, Q1 2023
- Table 2-6: Venture Capital/Private Fundraising Deals, Q4 2022
- Table 2-7: Venture Capital/Private, Q3 2022
- Table 2-8: Venture Capital/Private Fundraising Deals, Q2 2022
- Table 2-9: Venture Capital/Private Fundraising Deals, Q1 2022
Chapter 3: Strategic Investments
- Strategic Investments in Cell and Gene Therapy
- Figure 3-1: Total Number of Strategic Investments, By Quarter [Q1 2021-Q3 2023] (count)
- Figure 3-2: Average Strategic Investment Amount, By Quarter [Q1 2021-Q3 2023] ($M)
- Figure 3-3: Total Strategic Investments, By Quarter [Q1 2021-Q3 2023] ($M)
- Table 3-1: Strategic Investment Total Amounts, Counts, and Averages by Quarter, Q1 2021-Q3 2023, ($M)
- Table 3-2: Strategic Investments, January 2021-September 2023
- Table 3-3: Most Active in Acquisition/Merger/Strategic Investment, 2021-2023
- Figure 3-4: Most Active in Acquisition/Merger/ Strategic Investment, 2021-2023
Chapter 4: IPOs, FPOs, & SPACs
- North America Sees the Majority of Proceeds from IPOs, FPOs, SPACs
- Figure 4-1: Total Number of IPOs/ FPOs, By Month [Jan 2021-Sep 2023] (count)
- Figure 4-2: Average IPO/FPO Proceeds, By Quarter [Q1 2021-Q3 2023] ($M)
- Table 4-1: Quarterly IPO/FPO Total Funding, Q1 2021-Q3 2023, by Region [North America, Europe, APAC] ($M)
- Figure 4-3: Total IPO/FPO Funding, By Quarter [Q1 2021-Q3 2023], by Region [North America, Europe, APAC] ($M)
- Table 4-2: Regional IPO/FPO Funding Shares, by Quarter, Q1 2021-Q3 2023, by Region [North America, Europe, APAC] (%)
- Figure 4-4: Regional IPO/FPO Funding Shares, By Quarter, Q1 2021-Q3 2023, by Region [North America, APAC, and Europe) (%)
- Figure 4-5: IPO/FPO Amounts, By Quarter [Q1 2021-Q3 2023] ($M)
- Table 4-3: Quarterly SPAC Funding Portion, Q1 2021-Q3 2023 ($M)
- Figure 4-6: Quarterly SPAC Funding Portion Total and Average, Q1 2021-Q3 2023 ($M)
- Table 4-4: IPO/FPO Deals, Q3 2023
- Table 4-5: IPO/FPO Deals, Q2 2023
- Table 4-6: IPO/FPO Deals, Q1 2023
- Table 4-7: IPO/FPO Deals, Q4 2022
- Table 4-8: IPO/FPO Deals, Q3 2022
- Table 4-9: IPO/FPO Deals, Q2 2022
- Table 4-10: IPO/FPO Deals, Q1 2022
- Table 4-11: SPAC Portion, January 2021-September 2023 ($M)
- Figure 4-7: SPAC Portion Amount, by Year, 2021-2023 ($M)
Chapter 5: Mergers & Acquisitions (M&A)
- Growing Numbers of M&A, Despite Lower Average Value
- Figure 5-1: Total Number of Mergers and Acquisitions, By Month [Jan 2021-Sep 2023] (count)
- Figure 5-2: Average Merger/Acquisition Amount, By Quarter [Q1 2021-Q3 2023] ($M)
- Table 5-1: Quarterly Merger and Acquisition Values, Counts, and Averages, Q1 2021-Q3 2023 ($M) (Total count)
- Figure 5-3: Merger/Acquisition Transactions Global Total, By Quarter [Q1 2022- Q3 2023] ($M)
- Figure 5-4: Merger/Acquisition Amounts, by Quarter [Q1 2021-Q3 2023] ($M)
- Table 5-2: Mergers and Acquisitions Announcements, Q3 2023 ($M)
- Table 5-3: Mergers and Acquisitions Announcements, Q2 2023 ($M)
- Table 5-4: Mergers and Acquisitions Announcements, Q1 2023 ($M)
- Table 5-5: Mergers and Acquisitions, Q4 2022 ($M)
- Table 5-6: Mergers and Acquisitions, Q3 2022 ($M)
- Table 5-7: Mergers and Acquisitions, Q2 2022 ($M)
- Table 5-8: Mergers and Acquisitions, Q1 2022 ($M)
- Table 5-9: Most Active in Acquisition/Merger/Strategic Investment, 2021-2023 (count)
- Figure 5-5: Most Active in Acquisition/Merger/Strategic Investment, 2021-2023
Chapter 6: Technology/Research/Strategic Collaborations
- CGT Market Sees a Broad Variety of Collaborations
- Figure 6-1: Total Number of Tech/Research/Strategic Collaborations, By Month [Jan 2021-Sep 2023] (count)
- Figure 6-2: Total Number of Collaborations with Upfront and/or Milestone Payments, By Quarter [Q1 2021-Q3 2023] ($M)
- Table 6-1: Collaboration Upfront and Future/Milestone Payments, Counts, Averages, Q1 2021-Q3 2023 ($M) (count)
- Figure 6-3: Average Collaboration Upfront Payment, By Quarter [Q1 2021-Q3 2023] ($M)
- Figure 6-4: Research Collaboration Upfront Payments, By Quarter [Q1 2021-Q3 2023] ($M)
- Figure 6-5: Average Collaboration Future/Milestone Payments, By Quarter [Q1 2021-Q3 2023] ($M)
- Figure 6-6: Total Collaboration Future/Milestone Payments, By Quarter [Q2 2021-Q3 2023] ($M)
- Table 6-2: Technology/Research/Strategic Collaboration Deals, Q3 2023
- Table 6-3: Technology/Research/Strategic Collaboration Deals, Q2 2023
- Table 6-4: Technology/Research/Strategic Collaboration Deals, Q1 2022-Q3 2023
- Table 6-5: Most Active in Research/Strategic Collaborations, 2021-2023 (count)
- Figure 6-7: Most Active in Research/Strategic Collaborations, 2021-2023 (count)
Chapter 7: Licensing
- Stable Levels of Licensing in the Cell and Gene Therapy Market
- Figure 7-1: Total Number of Licensing Deals, By Month [Jan 2021-Sep 2023] (count)
- Table 7-1: Licensing Deals, Q3 2023
- Table 7-2: Licensing Deals, Q2 2023
- Table 7-3: Licensing Deals, Q1 2022-Q1 2023
- Table 7-4: Most Active Companies in Licensing Deals, 2021-2023 (count)
- Figure 7-2: Most Active Companies in Licensing Deals, 2021-2023 (count)
Chapter 8: Manufacturing and Supply Chain
- Major Growth in Manufacturing and Supply Chain Management Activity in CGT
- Figure 8-1: Total Number of Supply/ Manufacturing Deals, By Month [Jan 2021-Sep 2023] (count)
- Table 8-1: Manufacturing and Supply Chain Deals, Q3 2023
- Table 8-2: Manufacturing and Supply Chain Deals, Q2 2023
- Table 8-3: Manufacturing and Supply Chain Deals, Q1 2022-Q3 2023
- Table 8-4: Most Active Companies in Manufacturing/ Supply Deals, 2021-2023 (count)
- Figure 8-2: Most Active Companies in Manufacturing/ Supply Deals, 2021-2023 (count)
Chapter 9: Public Outreach, Education, & Philanthropy
- CGT Market Focusing Less on Public Outreach, Patient/ Consumer/ Trainee Education, and Philanthropy
- Figure 9-1: Total Number of Outreach/ Philanthropy/ Education Deals, By Month [Jan 2021-Sep 2023] (count)
- Table 9-1: Outreach, Education, & Philanthropy Deals, January 2022-Aug 2023
Chapter 10: Distribution & Co-Marketing
- A Look at CGT Distribution and Co-Marketing Deals
- Figure 10-1: Total Number of Distribution/ Co-Marketing Deals, by Month [Jan 2021-Sep 2023] (count)
- Table 10-1: Distribution & Co-Marketing Deals, Q3 2023
- Table 10-2: Distribution & Co-Marketing Deals, Q2 2023
- Table 10-3: Distribution & Co-Marketing Deals, Q1 2022-Q1 2023
Chapter 11: Other - JV, Restructuring, Termination, Spinoffs
- A Look at Other Types of Deals Impacting Cell and Gene Therapy
- Figure 11-1: Total Number of JV, Restructuring, Termination, By Month [Jan 2021-Sep 2023] (Total count)
- Table 11-1: Restructuring, JV, Termination, Spinoffs, January 2022-Sep 2023
