|
|
市場調査レポート
商品コード
1767811
振動モニタリングの世界市場規模、シェア、動向分析:プロセス別、コンポーネント別、産業別、地域別、展望と予測、2025年~2032年Global Vibration Monitoring Market Size, Share & Trends Analysis Report By Process (Online and Portable), By Component, By Industry, By Regional Outlook and Forecast, 2025 - 2032 |
||||||
|
|||||||
|
|||||||

| 振動モニタリングの世界市場規模、シェア、動向分析:プロセス別、コンポーネント別、産業別、地域別、展望と予測、2025年~2032年 |
|
出版日: 2025年04月30日
発行: KBV Research
ページ情報: 英文 279 Pages
納期: 即納可能
|

全表示
- 概要
- 図表
- 目次
振動モニタリング市場規模は、予測期間中に7.1%のCAGRで市場成長し、2032年までに28億8,000万米ドルに達すると予想されています。
KBV Cardinal matrix- 振動モニタリング市場の競合分析
KBV Cardinal matrixに示された分析に基づくと、Honeywell International, Inc.は振動モニタリング市場の先駆者です。TE Connectivity Ltd.やParker Hannifin Corporationといった企業は、振動モニタリング市場における主要なイノベーターです。2024年4月、Parker Hannifinの一部門であるParker Lordは、Bell Textronと提携し、米国陸軍の将来型長距離強襲航空機(FLRAA)向けにエラストマー製ローター部品を提供します。これにより、航空攻撃能力が向上し、航空宇宙分野における騒音・振動・ハーシュネス(NVH)制御が強化されます。
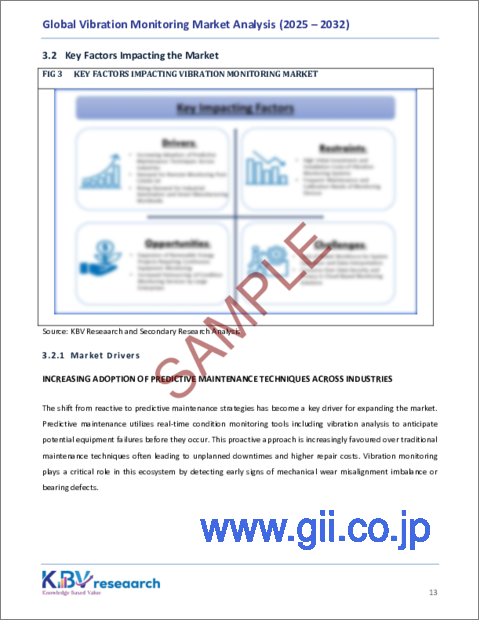
市場成長要因
事後対応型メンテナンスから予知型メンテナンスへの戦略の転換は、市場拡大の重要な原動力となっています。予知型メンテナンスは、振動解析を含むリアルタイムの状態監視ツールを活用し、機器の潜在的な故障を事前に予測します。このプロアクティブなアプローチは、従来のメンテナンス手法よりもますます好まれており、予知型メンテナンスは、しばしば計画外のダウンタイムや修理コストの増加につながります。その結果、世界中の産産業において事後対応型メンテナンスよりも予知型メンテナンスへの関心が高まっていることを背景に、市場は力強い成長を遂げています。
さらに、COVID-19パンデミックは現場の産業オペレーションに大きな混乱をもたらし、企業は健康と安全のプロトコルを遵守しながら重要な資産をどのように維持管理するかを再検討せざるを得なくなりました。工場フロアへの物理的な立ち入りが最小限に抑えられたため、リモート監視ツールへの依存が劇的に高まりました。状態基準保全の基盤となる振動モニタリングは、リモート診断と機械の健全性監視に不可欠なソリューションとして浮上しました。これにより、振動モニタリングの採用が大幅に増加し、COVID後の回復力のある産業オペレーションの重要な推進力として位置付けられました。
市場抑制要因
しかし、振動モニタリングシステムの普及を阻む大きな制約の一つは、導入に必要な高額な初期投資です。これらのシステムには、高度なセンサー、データ収集ハードウェア、分析ソフトウェアの購入、そして既存のITインフラとの統合が必要となる場合が多く、多くの中小企業にとって、このような包括的なソリューションの導入は財政的に大きな負担となる可能性があります。結果として、特に価格に敏感な地域や利益率の低い産業の企業は、導入を遅らせたり、全く避けたりする可能性があり、これが振動モニタリング技術の市場全体の成長を鈍化させています。
プロセスの展望
プロセス別に見ると、市場はオンライン振動モニタリングとポータブル振動モニタリングに分類されます。ポータブルモニタリングセグメントは、2024年に市場収益シェアの31%を獲得しました。このセグメントは、その柔軟性と費用対効果の高さから、特に定期メンテナンスや抜き取り検査を求める組織で人気が高まっています。ハンドヘルドアナライザーやデータコレクターなどのポータブル振動モニタリングデバイスは、重要度の低いアプリケーションや、機械設置面積が小さい施設での機器検査に広く利用されています。
コンポーネントの展望
市場はコンポーネント別に、ハードウェア、ソフトウェア、サービスに分類されます。ソフトウェアセグメントは2024年に市場の38%の収益シェアを獲得しました。振動モニタリングソフトウェアは、ハードウェアデバイスによって収集された生データの解釈を支援し、実用的な洞察を提供し、タイムリーな意思決定を可能にします。産産業は、これらのソフトウェアソリューションを活用して、運用効率の向上、保守スケジュールの最適化、予期せぬ機械故障の削減に取り組んでいます。さらに、振動解析ソフトウェアに人工知能(AI)と機械学習(ML)を統合することで、予測機能が向上し、様々なエンドユーザーセクターでその魅力がさらに高まっています。
産業展望
産業別に見ると、市場は石油・ガス、発電、鉱業・金属、化学、自動車、航空宇宙、食品・飲料、その他に分類されています。発電セグメントは2024年に市場全体の収益シェアの14%を占めました。発電所はタービン、発電機、および補機の確実な稼働に依存しており、少しでも故障が発生すると、大幅なダウンタイムと発電量の損失につながる可能性があります。振動モニタリングソリューションは、機器の状態に関するリアルタイムの洞察を提供し、予知保全を支援し、計画外の停止を削減することで、重要な保護層を提供します。
地域展望
地域別に見ると、市場は北米、欧州、アジア太平洋、ラテンアメリカ・中東・アフリカにおいて分析されています。欧州セグメントは、2024年に市場収益の31%を占めました。発電、自動車、航空宇宙などの欧州の産業は、機械の信頼性を高め、効率的なメンテナンスを通じて二酸化炭素排出量を削減するために、状態監視技術を積極的に導入しています。
市場競争と特性
振動モニタリング市場は、多数の地域企業や中規模企業の存在により、依然として競争が激しい状況にあります。これらの企業はニッチな用途に特化し、製造、エネルギー、輸送といった産業向けに、費用対効果の高い革新的なソリューションを提供しています。市場は、技術の進歩、ワイヤレスモニタリングの動向、そして様々な分野における予知保全ソリューションの需要の高まりを背景に、健全な競合が続いています。
目次
第1章 市場範囲と調査手法
- 市場の定義
- 目的
- 市場範囲
- セグメンテーション
- 調査手法
第2章 市場要覧
- 主なハイライト
第3章 市場概要
- イントロダクション
- 概要
- 市場構成とシナリオ
- 概要
- 市場に影響を与える主な要因
- 市場促進要因
- 市場抑制要因
- 市場機会
- 市場の課題
第4章 競合分析:世界
- KBV Cardinal Matrix
- 最近の産業全体の戦略的展開
- パートナーシップ、コラボレーション、および契約
- 製品の発売と製品の拡大
- 買収と合併
- 市場シェア分析、2024年
- 主要成功戦略
- 主な戦略
- 主要な戦略的動き
- ポーターファイブフォース分析
第5章 世界市場:プロセス別
- 世界のオンライン市場:地域別
- 世界のポータブル市場:地域別
第6章 世界市場:コンポーネント別
- 世界のハードウェア市場:地域別
- 世界のソフトウェア市場:地域別
- 世界のサービス市場:地域別
第7章 世界市場:産業別
- 世界の石油・ガス市場:地域別
- 世界の発電市場:地域別
- 世界の鉱業・金属市場:地域別
- 世界の化学品市場:地域別
- 世界の自動車市場:地域別
- 世界の航空宇宙市場:地域別
- 世界のその他の産業市場:地域別
第8章 世界市場:地域別
- 北米
- 北米の市場:国別
- 米国
- カナダ
- メキシコ
- その他北米地域
- 北米の市場:国別
- 欧州
- 欧州の市場:国別
- ドイツ
- 英国
- フランス
- ロシア
- スペイン
- イタリア
- その他欧州地域
- 欧州の市場:国別
- アジア太平洋地域
- アジア太平洋の市場:国別
- 中国
- 日本
- インド
- 韓国
- シンガポール
- マレーシア
- その他アジア太平洋地域
- アジア太平洋の市場:国別
- ラテンアメリカ・中東・アフリカ
- ラテンアメリカ・中東・アフリカの市場:国別
- ブラジル
- アルゼンチン
- アラブ首長国連邦
- サウジアラビア
- 南アフリカ
- ナイジェリア
- その他ラテンアメリカ・中東・アフリカ地域
- ラテンアメリカ・中東・アフリカの市場:国別
第9章 企業プロファイル
- Honeywell International, Inc
- Emerson Electric Co
- SKF Group
- Schaeffler AG
- Parker Hannifin Corporation
- Analog Devices, Inc
- Teledyne FLIR LLC(Teledyne Technologies Incorporated)
- Rockwell Automation, Inc
- Baker Hughes Company
- TE Connectivity Ltd
第10章 振動モニタリング市場の成功必須条件
LIST OF TABLES
- TABLE 1 Global Vibration Monitoring Market, 2021 - 2024, USD Million
- TABLE 2 Global Vibration Monitoring Market, 2025 - 2032, USD Million
- TABLE 3 Partnerships, Collaborations and Agreements- Vibration Monitoring Market
- TABLE 4 Product Launches And Product Expansions- Vibration Monitoring Market
- TABLE 5 Acquisition and Mergers- Vibration Monitoring Market
- TABLE 6 Global Vibration Monitoring Market by Process, 2021 - 2024, USD Million
- TABLE 7 Global Vibration Monitoring Market by Process, 2025 - 2032, USD Million
- TABLE 8 Global Online Market by Region, 2021 - 2024, USD Million
- TABLE 9 Global Online Market by Region, 2025 - 2032, USD Million
- TABLE 10 Global Portable Market by Region, 2021 - 2024, USD Million
- TABLE 11 Global Portable Market by Region, 2025 - 2032, USD Million
- TABLE 12 Global Vibration Monitoring Market by Component, 2021 - 2024, USD Million
- TABLE 13 Global Vibration Monitoring Market by Component, 2025 - 2032, USD Million
- TABLE 14 Global Hardware Market by Region, 2021 - 2024, USD Million
- TABLE 15 Global Hardware Market by Region, 2025 - 2032, USD Million
- TABLE 16 Global Software Market by Region, 2021 - 2024, USD Million
- TABLE 17 Global Software Market by Region, 2025 - 2032, USD Million
- TABLE 18 Global Services Market by Region, 2021 - 2024, USD Million
- TABLE 19 Global Services Market by Region, 2025 - 2032, USD Million
- TABLE 20 Global Vibration Monitoring Market by Industry, 2021 - 2024, USD Million
- TABLE 21 Global Vibration Monitoring Market by Industry, 2025 - 2032, USD Million
- TABLE 22 Global Oil & Gas Market by Region, 2021 - 2024, USD Million
- TABLE 23 Global Oil & Gas Market by Region, 2025 - 2032, USD Million
- TABLE 24 Global Power Generation Market by Region, 2021 - 2024, USD Million
- TABLE 25 Global Power Generation Market by Region, 2025 - 2032, USD Million
- TABLE 26 Global Mining & Metals Market by Region, 2021 - 2024, USD Million
- TABLE 27 Global Mining & Metals Market by Region, 2025 - 2032, USD Million
- TABLE 28 Global Chemicals Market by Region, 2021 - 2024, USD Million
- TABLE 29 Global Chemicals Market by Region, 2025 - 2032, USD Million
- TABLE 30 Global Automotive Market by Region, 2021 - 2024, USD Million
- TABLE 31 Global Automotive Market by Region, 2025 - 2032, USD Million
- TABLE 32 Global Aerospace Market by Region, 2021 - 2024, USD Million
- TABLE 33 Global Aerospace Market by Region, 2025 - 2032, USD Million
- TABLE 34 Global Other Industry Market by Region, 2021 - 2024, USD Million
- TABLE 35 Global Other Industry Market by Region, 2025 - 2032, USD Million
- TABLE 36 Global Vibration Monitoring Market by Region, 2021 - 2024, USD Million
- TABLE 37 Global Vibration Monitoring Market by Region, 2025 - 2032, USD Million
- TABLE 38 North America Vibration Monitoring Market, 2021 - 2024, USD Million
- TABLE 39 North America Vibration Monitoring Market, 2025 - 2032, USD Million
- TABLE 40 North America Vibration Monitoring Market by Process, 2021 - 2024, USD Million
- TABLE 41 North America Vibration Monitoring Market by Process, 2025 - 2032, USD Million
- TABLE 42 North America Online Market by Region, 2021 - 2024, USD Million
- TABLE 43 North America Online Market by Region, 2025 - 2032, USD Million
- TABLE 44 North America Portable Market by Region, 2021 - 2024, USD Million
- TABLE 45 North America Portable Market by Region, 2025 - 2032, USD Million
- TABLE 46 North America Vibration Monitoring Market by Component, 2021 - 2024, USD Million
- TABLE 47 North America Vibration Monitoring Market by Component, 2025 - 2032, USD Million
- TABLE 48 North America Hardware Market by Country, 2021 - 2024, USD Million
- TABLE 49 North America Hardware Market by Country, 2025 - 2032, USD Million
- TABLE 50 North America Software Market by Country, 2021 - 2024, USD Million
- TABLE 51 North America Software Market by Country, 2025 - 2032, USD Million
- TABLE 52 North America Services Market by Country, 2021 - 2024, USD Million
- TABLE 53 North America Services Market by Country, 2025 - 2032, USD Million
- TABLE 54 North America Vibration Monitoring Market by Industry, 2021 - 2024, USD Million
- TABLE 55 North America Vibration Monitoring Market by Industry, 2025 - 2032, USD Million
- TABLE 56 North America Oil & Gas Market by Country, 2021 - 2024, USD Million
- TABLE 57 North America Oil & Gas Market by Country, 2025 - 2032, USD Million
- TABLE 58 North America Power Generation Market by Country, 2021 - 2024, USD Million
- TABLE 59 North America Power Generation Market by Country, 2025 - 2032, USD Million
- TABLE 60 North America Mining & Metals Market by Country, 2021 - 2024, USD Million
- TABLE 61 North America Mining & Metals Market by Country, 2025 - 2032, USD Million
- TABLE 62 North America Chemicals Market by Country, 2021 - 2024, USD Million
- TABLE 63 North America Chemicals Market by Country, 2025 - 2032, USD Million
- TABLE 64 North America Automotive Market by Country, 2021 - 2024, USD Million
- TABLE 65 North America Automotive Market by Country, 2025 - 2032, USD Million
- TABLE 66 North America Aerospace Market by Country, 2021 - 2024, USD Million
- TABLE 67 North America Aerospace Market by Country, 2025 - 2032, USD Million
- TABLE 68 North America Other Industry Market by Country, 2021 - 2024, USD Million
- TABLE 69 North America Other Industry Market by Country, 2025 - 2032, USD Million
- TABLE 70 North America Vibration Monitoring Market by Country, 2021 - 2024, USD Million
- TABLE 71 North America Vibration Monitoring Market by Country, 2025 - 2032, USD Million
- TABLE 72 US Vibration Monitoring Market, 2021 - 2024, USD Million
- TABLE 73 US Vibration Monitoring Market, 2025 - 2032, USD Million
- TABLE 74 US Vibration Monitoring Market by Process, 2021 - 2024, USD Million
- TABLE 75 US Vibration Monitoring Market by Process, 2025 - 2032, USD Million
- TABLE 76 US Vibration Monitoring Market by Component, 2021 - 2024, USD Million
- TABLE 77 US Vibration Monitoring Market by Component, 2025 - 2032, USD Million
- TABLE 78 US Vibration Monitoring Market by Industry, 2021 - 2024, USD Million
- TABLE 79 US Vibration Monitoring Market by Industry, 2025 - 2032, USD Million
- TABLE 80 Canada Vibration Monitoring Market, 2021 - 2024, USD Million
- TABLE 81 Canada Vibration Monitoring Market, 2025 - 2032, USD Million
- TABLE 82 Canada Vibration Monitoring Market by Process, 2021 - 2024, USD Million
- TABLE 83 Canada Vibration Monitoring Market by Process, 2025 - 2032, USD Million
- TABLE 84 Canada Vibration Monitoring Market by Component, 2021 - 2024, USD Million
- TABLE 85 Canada Vibration Monitoring Market by Component, 2025 - 2032, USD Million
- TABLE 86 Canada Vibration Monitoring Market by Industry, 2021 - 2024, USD Million
- TABLE 87 Canada Vibration Monitoring Market by Industry, 2025 - 2032, USD Million
- TABLE 88 Mexico Vibration Monitoring Market, 2021 - 2024, USD Million
- TABLE 89 Mexico Vibration Monitoring Market, 2025 - 2032, USD Million
- TABLE 90 Mexico Vibration Monitoring Market by Process, 2021 - 2024, USD Million
- TABLE 91 Mexico Vibration Monitoring Market by Process, 2025 - 2032, USD Million
- TABLE 92 Mexico Vibration Monitoring Market by Component, 2021 - 2024, USD Million
- TABLE 93 Mexico Vibration Monitoring Market by Component, 2025 - 2032, USD Million
- TABLE 94 Mexico Vibration Monitoring Market by Industry, 2021 - 2024, USD Million
- TABLE 95 Mexico Vibration Monitoring Market by Industry, 2025 - 2032, USD Million
- TABLE 96 Rest of North America Vibration Monitoring Market, 2021 - 2024, USD Million
- TABLE 97 Rest of North America Vibration Monitoring Market, 2025 - 2032, USD Million
- TABLE 98 Rest of North America Vibration Monitoring Market by Process, 2021 - 2024, USD Million
- TABLE 99 Rest of North America Vibration Monitoring Market by Process, 2025 - 2032, USD Million
- TABLE 100 Rest of North America Vibration Monitoring Market by Component, 2021 - 2024, USD Million
- TABLE 101 Rest of North America Vibration Monitoring Market by Component, 2025 - 2032, USD Million
- TABLE 102 Rest of North America Vibration Monitoring Market by Industry, 2021 - 2024, USD Million
- TABLE 103 Rest of North America Vibration Monitoring Market by Industry, 2025 - 2032, USD Million
- TABLE 104 Europe Vibration Monitoring Market, 2021 - 2024, USD Million
- TABLE 105 Europe Vibration Monitoring Market, 2025 - 2032, USD Million
- TABLE 106 Europe Vibration Monitoring Market by Process, 2021 - 2024, USD Million
- TABLE 107 Europe Vibration Monitoring Market by Process, 2025 - 2032, USD Million
- TABLE 108 Europe Online Market by Country, 2021 - 2024, USD Million
- TABLE 109 Europe Online Market by Country, 2025 - 2032, USD Million
- TABLE 110 Europe Portable Market by Country, 2021 - 2024, USD Million
- TABLE 111 Europe Portable Market by Country, 2025 - 2032, USD Million
- TABLE 112 Europe Vibration Monitoring Market by Component, 2021 - 2024, USD Million
- TABLE 113 Europe Vibration Monitoring Market by Component, 2025 - 2032, USD Million
- TABLE 114 Europe Hardware Market by Country, 2021 - 2024, USD Million
- TABLE 115 Europe Hardware Market by Country, 2025 - 2032, USD Million
- TABLE 116 Europe Software Market by Country, 2021 - 2024, USD Million
- TABLE 117 Europe Software Market by Country, 2025 - 2032, USD Million
- TABLE 118 Europe Services Market by Country, 2021 - 2024, USD Million
- TABLE 119 Europe Services Market by Country, 2025 - 2032, USD Million
- TABLE 120 Europe Vibration Monitoring Market by Industry, 2021 - 2024, USD Million
- TABLE 121 Europe Vibration Monitoring Market by Industry, 2025 - 2032, USD Million
- TABLE 122 Europe Oil & Gas Market by Country, 2021 - 2024, USD Million
- TABLE 123 Europe Oil & Gas Market by Country, 2025 - 2032, USD Million
- TABLE 124 Europe Power Generation Market by Country, 2021 - 2024, USD Million
- TABLE 125 Europe Power Generation Market by Country, 2025 - 2032, USD Million
- TABLE 126 Europe Mining & Metals Market by Country, 2021 - 2024, USD Million
- TABLE 127 Europe Mining & Metals Market by Country, 2025 - 2032, USD Million
- TABLE 128 Europe Chemicals Market by Country, 2021 - 2024, USD Million
- TABLE 129 Europe Chemicals Market by Country, 2025 - 2032, USD Million
- TABLE 130 Europe Automotive Market by Country, 2021 - 2024, USD Million
- TABLE 131 Europe Automotive Market by Country, 2025 - 2032, USD Million
- TABLE 132 Europe Aerospace Market by Country, 2021 - 2024, USD Million
- TABLE 133 Europe Aerospace Market by Country, 2025 - 2032, USD Million
- TABLE 134 Europe Other Industry Market by Country, 2021 - 2024, USD Million
- TABLE 135 Europe Other Industry Market by Country, 2025 - 2032, USD Million
- TABLE 136 Europe Vibration Monitoring Market by Country, 2021 - 2024, USD Million
- TABLE 137 Europe Vibration Monitoring Market by Country, 2025 - 2032, USD Million
- TABLE 138 Germany Vibration Monitoring Market, 2021 - 2024, USD Million
- TABLE 139 Germany Vibration Monitoring Market, 2025 - 2032, USD Million
- TABLE 140 Germany Vibration Monitoring Market by Process, 2021 - 2024, USD Million
- TABLE 141 Germany Vibration Monitoring Market by Process, 2025 - 2032, USD Million
- TABLE 142 Germany Vibration Monitoring Market by Component, 2021 - 2024, USD Million
- TABLE 143 Germany Vibration Monitoring Market by Component, 2025 - 2032, USD Million
- TABLE 144 Germany Vibration Monitoring Market by Industry, 2021 - 2024, USD Million
- TABLE 145 Germany Vibration Monitoring Market by Industry, 2025 - 2032, USD Million
- TABLE 146 UK Vibration Monitoring Market, 2021 - 2024, USD Million
- TABLE 147 UK Vibration Monitoring Market, 2025 - 2032, USD Million
- TABLE 148 UK Vibration Monitoring Market by Process, 2021 - 2024, USD Million
- TABLE 149 UK Vibration Monitoring Market by Process, 2025 - 2032, USD Million
- TABLE 150 UK Vibration Monitoring Market by Component, 2021 - 2024, USD Million
- TABLE 151 UK Vibration Monitoring Market by Component, 2025 - 2032, USD Million
- TABLE 152 UK Vibration Monitoring Market by Industry, 2021 - 2024, USD Million
- TABLE 153 UK Vibration Monitoring Market by Industry, 2025 - 2032, USD Million
- TABLE 154 France Vibration Monitoring Market, 2021 - 2024, USD Million
- TABLE 155 France Vibration Monitoring Market, 2025 - 2032, USD Million
- TABLE 156 France Vibration Monitoring Market by Process, 2021 - 2024, USD Million
- TABLE 157 France Vibration Monitoring Market by Process, 2025 - 2032, USD Million
- TABLE 158 France Vibration Monitoring Market by Component, 2021 - 2024, USD Million
- TABLE 159 France Vibration Monitoring Market by Component, 2025 - 2032, USD Million
- TABLE 160 France Vibration Monitoring Market by Industry, 2021 - 2024, USD Million
- TABLE 161 France Vibration Monitoring Market by Industry, 2025 - 2032, USD Million
- TABLE 162 Russia Vibration Monitoring Market, 2021 - 2024, USD Million
- TABLE 163 Russia Vibration Monitoring Market, 2025 - 2032, USD Million
- TABLE 164 Russia Vibration Monitoring Market by Process, 2021 - 2024, USD Million
- TABLE 165 Russia Vibration Monitoring Market by Process, 2025 - 2032, USD Million
- TABLE 166 Russia Vibration Monitoring Market by Component, 2021 - 2024, USD Million
- TABLE 167 Russia Vibration Monitoring Market by Component, 2025 - 2032, USD Million
- TABLE 168 Russia Vibration Monitoring Market by Industry, 2021 - 2024, USD Million
- TABLE 169 Russia Vibration Monitoring Market by Industry, 2025 - 2032, USD Million
- TABLE 170 Spain Vibration Monitoring Market, 2021 - 2024, USD Million
- TABLE 171 Spain Vibration Monitoring Market, 2025 - 2032, USD Million
- TABLE 172 Spain Vibration Monitoring Market by Process, 2021 - 2024, USD Million
- TABLE 173 Spain Vibration Monitoring Market by Process, 2025 - 2032, USD Million
- TABLE 174 Spain Vibration Monitoring Market by Component, 2021 - 2024, USD Million
- TABLE 175 Spain Vibration Monitoring Market by Component, 2025 - 2032, USD Million
- TABLE 176 Spain Vibration Monitoring Market by Industry, 2021 - 2024, USD Million
- TABLE 177 Spain Vibration Monitoring Market by Industry, 2025 - 2032, USD Million
- TABLE 178 Italy Vibration Monitoring Market, 2021 - 2024, USD Million
- TABLE 179 Italy Vibration Monitoring Market, 2025 - 2032, USD Million
- TABLE 180 Italy Vibration Monitoring Market by Process, 2021 - 2024, USD Million
- TABLE 181 Italy Vibration Monitoring Market by Process, 2025 - 2032, USD Million
- TABLE 182 Italy Vibration Monitoring Market by Component, 2021 - 2024, USD Million
- TABLE 183 Italy Vibration Monitoring Market by Component, 2025 - 2032, USD Million
- TABLE 184 Italy Vibration Monitoring Market by Industry, 2021 - 2024, USD Million
- TABLE 185 Italy Vibration Monitoring Market by Industry, 2025 - 2032, USD Million
- TABLE 186 Rest of Europe Vibration Monitoring Market, 2021 - 2024, USD Million
- TABLE 187 Rest of Europe Vibration Monitoring Market, 2025 - 2032, USD Million
- TABLE 188 Rest of Europe Vibration Monitoring Market by Process, 2021 - 2024, USD Million
- TABLE 189 Rest of Europe Vibration Monitoring Market by Process, 2025 - 2032, USD Million
- TABLE 190 Rest of Europe Vibration Monitoring Market by Component, 2021 - 2024, USD Million
- TABLE 191 Rest of Europe Vibration Monitoring Market by Component, 2025 - 2032, USD Million
- TABLE 192 Rest of Europe Vibration Monitoring Market by Industry, 2021 - 2024, USD Million
- TABLE 193 Rest of Europe Vibration Monitoring Market by Industry, 2025 - 2032, USD Million
- TABLE 194 Asia Pacific Vibration Monitoring Market, 2021 - 2024, USD Million
- TABLE 195 Asia Pacific Vibration Monitoring Market, 2025 - 2032, USD Million
- TABLE 196 Asia Pacific Vibration Monitoring Market by Process, 2021 - 2024, USD Million
- TABLE 197 Asia Pacific Vibration Monitoring Market by Process, 2025 - 2032, USD Million
- TABLE 198 Asia Pacific Online Market by Country, 2021 - 2024, USD Million
- TABLE 199 Asia Pacific Online Market by Country, 2025 - 2032, USD Million
- TABLE 200 Asia Pacific Portable Market by Country, 2021 - 2024, USD Million
- TABLE 201 Asia Pacific Portable Market by Country, 2025 - 2032, USD Million
- TABLE 202 Asia Pacific Vibration Monitoring Market by Component, 2021 - 2024, USD Million
- TABLE 203 Asia Pacific Vibration Monitoring Market by Component, 2025 - 2032, USD Million
- TABLE 204 Asia Pacific Hardware Market by Country, 2021 - 2024, USD Million
- TABLE 205 Asia Pacific Hardware Market by Country, 2025 - 2032, USD Million
- TABLE 206 Asia Pacific Software Market by Country, 2021 - 2024, USD Million
- TABLE 207 Asia Pacific Software Market by Country, 2025 - 2032, USD Million
- TABLE 208 Asia Pacific Services Market by Country, 2021 - 2024, USD Million
- TABLE 209 Asia Pacific Services Market by Country, 2025 - 2032, USD Million
- TABLE 210 Asia Pacific Vibration Monitoring Market by Industry, 2021 - 2024, USD Million
- TABLE 211 Asia Pacific Vibration Monitoring Market by Industry, 2025 - 2032, USD Million
- TABLE 212 Asia Pacific Oil & Gas Market by Country, 2021 - 2024, USD Million
- TABLE 213 Asia Pacific Oil & Gas Market by Country, 2025 - 2032, USD Million
- TABLE 214 Asia Pacific Power Generation Market by Country, 2021 - 2024, USD Million
- TABLE 215 Asia Pacific Power Generation Market by Country, 2025 - 2032, USD Million
- TABLE 216 Asia Pacific Mining & Metals Market by Country, 2021 - 2024, USD Million
- TABLE 217 Asia Pacific Mining & Metals Market by Country, 2025 - 2032, USD Million
- TABLE 218 Asia Pacific Chemicals Market by Country, 2021 - 2024, USD Million
- TABLE 219 Asia Pacific Chemicals Market by Country, 2025 - 2032, USD Million
- TABLE 220 Asia Pacific Automotive Market by Country, 2021 - 2024, USD Million
- TABLE 221 Asia Pacific Automotive Market by Country, 2025 - 2032, USD Million
- TABLE 222 Asia Pacific Aerospace Market by Country, 2021 - 2024, USD Million
- TABLE 223 Asia Pacific Aerospace Market by Country, 2025 - 2032, USD Million
- TABLE 224 Asia Pacific Other Industry Market by Country, 2021 - 2024, USD Million
- TABLE 225 Asia Pacific Other Industry Market by Country, 2025 - 2032, USD Million
- TABLE 226 Asia Pacific Vibration Monitoring Market by Country, 2021 - 2024, USD Million
- TABLE 227 Asia Pacific Vibration Monitoring Market by Country, 2025 - 2032, USD Million
- TABLE 228 China Vibration Monitoring Market, 2021 - 2024, USD Million
- TABLE 229 China Vibration Monitoring Market, 2025 - 2032, USD Million
- TABLE 230 China Vibration Monitoring Market by Process, 2021 - 2024, USD Million
- TABLE 231 China Vibration Monitoring Market by Process, 2025 - 2032, USD Million
- TABLE 232 China Vibration Monitoring Market by Component, 2021 - 2024, USD Million
- TABLE 233 China Vibration Monitoring Market by Component, 2025 - 2032, USD Million
- TABLE 234 China Vibration Monitoring Market by Industry, 2021 - 2024, USD Million
- TABLE 235 China Vibration Monitoring Market by Industry, 2025 - 2032, USD Million
- TABLE 236 Japan Vibration Monitoring Market, 2021 - 2024, USD Million
- TABLE 237 Japan Vibration Monitoring Market, 2025 - 2032, USD Million
- TABLE 238 Japan Vibration Monitoring Market by Process, 2021 - 2024, USD Million
- TABLE 239 Japan Vibration Monitoring Market by Process, 2025 - 2032, USD Million
- TABLE 240 Japan Vibration Monitoring Market by Component, 2021 - 2024, USD Million
- TABLE 241 Japan Vibration Monitoring Market by Component, 2025 - 2032, USD Million
- TABLE 242 Japan Vibration Monitoring Market by Industry, 2021 - 2024, USD Million
- TABLE 243 Japan Vibration Monitoring Market by Industry, 2025 - 2032, USD Million
- TABLE 244 India Vibration Monitoring Market, 2021 - 2024, USD Million
- TABLE 245 India Vibration Monitoring Market, 2025 - 2032, USD Million
- TABLE 246 India Vibration Monitoring Market by Process, 2021 - 2024, USD Million
- TABLE 247 India Vibration Monitoring Market by Process, 2025 - 2032, USD Million
- TABLE 248 India Vibration Monitoring Market by Component, 2021 - 2024, USD Million
- TABLE 249 India Vibration Monitoring Market by Component, 2025 - 2032, USD Million
- TABLE 250 India Vibration Monitoring Market by Industry, 2021 - 2024, USD Million
- TABLE 251 India Vibration Monitoring Market by Industry, 2025 - 2032, USD Million
- TABLE 252 South Korea Vibration Monitoring Market, 2021 - 2024, USD Million
- TABLE 253 South Korea Vibration Monitoring Market, 2025 - 2032, USD Million
- TABLE 254 South Korea Vibration Monitoring Market by Process, 2021 - 2024, USD Million
- TABLE 255 South Korea Vibration Monitoring Market by Process, 2025 - 2032, USD Million
- TABLE 256 South Korea Vibration Monitoring Market by Component, 2021 - 2024, USD Million
- TABLE 257 South Korea Vibration Monitoring Market by Component, 2025 - 2032, USD Million
- TABLE 258 South Korea Vibration Monitoring Market by Industry, 2021 - 2024, USD Million
- TABLE 259 South Korea Vibration Monitoring Market by Industry, 2025 - 2032, USD Million
- TABLE 260 Singapore Vibration Monitoring Market, 2021 - 2024, USD Million
- TABLE 261 Singapore Vibration Monitoring Market, 2025 - 2032, USD Million
- TABLE 262 Singapore Vibration Monitoring Market by Process, 2021 - 2024, USD Million
- TABLE 263 Singapore Vibration Monitoring Market by Process, 2025 - 2032, USD Million
- TABLE 264 Singapore Vibration Monitoring Market by Component, 2021 - 2024, USD Million
- TABLE 265 Singapore Vibration Monitoring Market by Component, 2025 - 2032, USD Million
- TABLE 266 Singapore Vibration Monitoring Market by Industry, 2021 - 2024, USD Million
- TABLE 267 Singapore Vibration Monitoring Market by Industry, 2025 - 2032, USD Million
- TABLE 268 Malaysia Vibration Monitoring Market, 2021 - 2024, USD Million
- TABLE 269 Malaysia Vibration Monitoring Market, 2025 - 2032, USD Million
- TABLE 270 Malaysia Vibration Monitoring Market by Process, 2021 - 2024, USD Million
- TABLE 271 Malaysia Vibration Monitoring Market by Process, 2025 - 2032, USD Million
- TABLE 272 Malaysia Vibration Monitoring Market by Component, 2021 - 2024, USD Million
- TABLE 273 Malaysia Vibration Monitoring Market by Component, 2025 - 2032, USD Million
- TABLE 274 Malaysia Vibration Monitoring Market by Industry, 2021 - 2024, USD Million
- TABLE 275 Malaysia Vibration Monitoring Market by Industry, 2025 - 2032, USD Million
- TABLE 276 Rest of Asia Pacific Vibration Monitoring Market, 2021 - 2024, USD Million
- TABLE 277 Rest of Asia Pacific Vibration Monitoring Market, 2025 - 2032, USD Million
- TABLE 278 Rest of Asia Pacific Vibration Monitoring Market by Process, 2021 - 2024, USD Million
- TABLE 279 Rest of Asia Pacific Vibration Monitoring Market by Process, 2025 - 2032, USD Million
- TABLE 280 Rest of Asia Pacific Vibration Monitoring Market by Component, 2021 - 2024, USD Million
- TABLE 281 Rest of Asia Pacific Vibration Monitoring Market by Component, 2025 - 2032, USD Million
- TABLE 282 Rest of Asia Pacific Vibration Monitoring Market by Industry, 2021 - 2024, USD Million
- TABLE 283 Rest of Asia Pacific Vibration Monitoring Market by Industry, 2025 - 2032, USD Million
- TABLE 284 LAMEA Vibration Monitoring Market, 2021 - 2024, USD Million
- TABLE 285 LAMEA Vibration Monitoring Market, 2025 - 2032, USD Million
- TABLE 286 LAMEA Vibration Monitoring Market by Process, 2021 - 2024, USD Million
- TABLE 287 LAMEA Vibration Monitoring Market by Process, 2025 - 2032, USD Million
- TABLE 288 LAMEA Online Market by Country, 2021 - 2024, USD Million
- TABLE 289 LAMEA Online Market by Country, 2025 - 2032, USD Million
- TABLE 290 LAMEA Portable Market by Country, 2021 - 2024, USD Million
- TABLE 291 LAMEA Portable Market by Country, 2025 - 2032, USD Million
- TABLE 292 LAMEA Vibration Monitoring Market by Component, 2021 - 2024, USD Million
- TABLE 293 LAMEA Vibration Monitoring Market by Component, 2025 - 2032, USD Million
- TABLE 294 LAMEA Hardware Market by Country, 2021 - 2024, USD Million
- TABLE 295 LAMEA Hardware Market by Country, 2025 - 2032, USD Million
- TABLE 296 LAMEA Software Market by Country, 2021 - 2024, USD Million
- TABLE 297 LAMEA Software Market by Country, 2025 - 2032, USD Million
- TABLE 298 LAMEA Services Market by Country, 2021 - 2024, USD Million
- TABLE 299 LAMEA Services Market by Country, 2025 - 2032, USD Million
- TABLE 300 LAMEA Vibration Monitoring Market by Industry, 2021 - 2024, USD Million
- TABLE 301 LAMEA Vibration Monitoring Market by Industry, 2025 - 2032, USD Million
- TABLE 302 LAMEA Oil & Gas Market by Country, 2021 - 2024, USD Million
- TABLE 303 LAMEA Oil & Gas Market by Country, 2025 - 2032, USD Million
- TABLE 304 LAMEA Power Generation Market by Country, 2021 - 2024, USD Million
- TABLE 305 LAMEA Power Generation Market by Country, 2025 - 2032, USD Million
- TABLE 306 LAMEA Mining & Metals Market by Country, 2021 - 2024, USD Million
- TABLE 307 LAMEA Mining & Metals Market by Country, 2025 - 2032, USD Million
- TABLE 308 LAMEA Chemicals Market by Country, 2021 - 2024, USD Million
- TABLE 309 LAMEA Chemicals Market by Country, 2025 - 2032, USD Million
- TABLE 310 LAMEA Automotive Market by Country, 2021 - 2024, USD Million
- TABLE 311 LAMEA Automotive Market by Country, 2025 - 2032, USD Million
- TABLE 312 LAMEA Aerospace Market by Country, 2021 - 2024, USD Million
- TABLE 313 LAMEA Aerospace Market by Country, 2025 - 2032, USD Million
- TABLE 314 LAMEA Other Industry Market by Country, 2021 - 2024, USD Million
- TABLE 315 LAMEA Other Industry Market by Country, 2025 - 2032, USD Million
- TABLE 316 LAMEA Vibration Monitoring Market by Country, 2021 - 2024, USD Million
- TABLE 317 LAMEA Vibration Monitoring Market by Country, 2025 - 2032, USD Million
- TABLE 318 Brazil Vibration Monitoring Market, 2021 - 2024, USD Million
- TABLE 319 Brazil Vibration Monitoring Market, 2025 - 2032, USD Million
- TABLE 320 Brazil Vibration Monitoring Market by Process, 2021 - 2024, USD Million
- TABLE 321 Brazil Vibration Monitoring Market by Process, 2025 - 2032, USD Million
- TABLE 322 Brazil Vibration Monitoring Market by Component, 2021 - 2024, USD Million
- TABLE 323 Brazil Vibration Monitoring Market by Component, 2025 - 2032, USD Million
- TABLE 324 Brazil Vibration Monitoring Market by Industry, 2021 - 2024, USD Million
- TABLE 325 Brazil Vibration Monitoring Market by Industry, 2025 - 2032, USD Million
- TABLE 326 Argentina Vibration Monitoring Market, 2021 - 2024, USD Million
- TABLE 327 Argentina Vibration Monitoring Market, 2025 - 2032, USD Million
- TABLE 328 Argentina Vibration Monitoring Market by Process, 2021 - 2024, USD Million
- TABLE 329 Argentina Vibration Monitoring Market by Process, 2025 - 2032, USD Million
- TABLE 330 Argentina Vibration Monitoring Market by Component, 2021 - 2024, USD Million
- TABLE 331 Argentina Vibration Monitoring Market by Component, 2025 - 2032, USD Million
- TABLE 332 Argentina Vibration Monitoring Market by Industry, 2021 - 2024, USD Million
- TABLE 333 Argentina Vibration Monitoring Market by Industry, 2025 - 2032, USD Million
- TABLE 334 UAE Vibration Monitoring Market, 2021 - 2024, USD Million
- TABLE 335 UAE Vibration Monitoring Market, 2025 - 2032, USD Million
- TABLE 336 UAE Vibration Monitoring Market by Process, 2021 - 2024, USD Million
- TABLE 337 UAE Vibration Monitoring Market by Process, 2025 - 2032, USD Million
- TABLE 338 UAE Vibration Monitoring Market by Component, 2021 - 2024, USD Million
- TABLE 339 UAE Vibration Monitoring Market by Component, 2025 - 2032, USD Million
- TABLE 340 UAE Vibration Monitoring Market by Industry, 2021 - 2024, USD Million
- TABLE 341 UAE Vibration Monitoring Market by Industry, 2025 - 2032, USD Million
- TABLE 342 Saudi Arabia Vibration Monitoring Market, 2021 - 2024, USD Million
- TABLE 343 Saudi Arabia Vibration Monitoring Market, 2025 - 2032, USD Million
- TABLE 344 Saudi Arabia Vibration Monitoring Market by Process, 2021 - 2024, USD Million
- TABLE 345 Saudi Arabia Vibration Monitoring Market by Process, 2025 - 2032, USD Million
- TABLE 346 Saudi Arabia Vibration Monitoring Market by Component, 2021 - 2024, USD Million
- TABLE 347 Saudi Arabia Vibration Monitoring Market by Component, 2025 - 2032, USD Million
- TABLE 348 Saudi Arabia Vibration Monitoring Market by Industry, 2021 - 2024, USD Million
- TABLE 349 Saudi Arabia Vibration Monitoring Market by Industry, 2025 - 2032, USD Million
- TABLE 350 South Africa Vibration Monitoring Market, 2021 - 2024, USD Million
- TABLE 351 South Africa Vibration Monitoring Market, 2025 - 2032, USD Million
- TABLE 352 South Africa Vibration Monitoring Market by Process, 2021 - 2024, USD Million
- TABLE 353 South Africa Vibration Monitoring Market by Process, 2025 - 2032, USD Million
- TABLE 354 South Africa Vibration Monitoring Market by Component, 2021 - 2024, USD Million
- TABLE 355 South Africa Vibration Monitoring Market by Component, 2025 - 2032, USD Million
- TABLE 356 South Africa Vibration Monitoring Market by Industry, 2021 - 2024, USD Million
- TABLE 357 South Africa Vibration Monitoring Market by Industry, 2025 - 2032, USD Million
- TABLE 358 Nigeria Vibration Monitoring Market, 2021 - 2024, USD Million
- TABLE 359 Nigeria Vibration Monitoring Market, 2025 - 2032, USD Million
- TABLE 360 Nigeria Vibration Monitoring Market by Process, 2021 - 2024, USD Million
- TABLE 361 Nigeria Vibration Monitoring Market by Process, 2025 - 2032, USD Million
- TABLE 362 Nigeria Vibration Monitoring Market by Component, 2021 - 2024, USD Million
- TABLE 363 Nigeria Vibration Monitoring Market by Component, 2025 - 2032, USD Million
- TABLE 364 Nigeria Vibration Monitoring Market by Industry, 2021 - 2024, USD Million
- TABLE 365 Nigeria Vibration Monitoring Market by Industry, 2025 - 2032, USD Million
- TABLE 366 Rest of LAMEA Vibration Monitoring Market, 2021 - 2024, USD Million
- TABLE 367 Rest of LAMEA Vibration Monitoring Market, 2025 - 2032, USD Million
- TABLE 368 Rest of LAMEA Vibration Monitoring Market by Process, 2021 - 2024, USD Million
- TABLE 369 Rest of LAMEA Vibration Monitoring Market by Process, 2025 - 2032, USD Million
- TABLE 370 Rest of LAMEA Vibration Monitoring Market by Component, 2021 - 2024, USD Million
- TABLE 371 Rest of LAMEA Vibration Monitoring Market by Component, 2025 - 2032, USD Million
- TABLE 372 Rest of LAMEA Vibration Monitoring Market by Industry, 2021 - 2024, USD Million
- TABLE 373 Rest of LAMEA Vibration Monitoring Market by Industry, 2025 - 2032, USD Million
- TABLE 374 Key Information - Honeywell International, Inc.
- TABLE 375 Key Information - Emerson Electric Co.
- TABLE 376 Key Information - SKF Group
- TABLE 377 Key Information - Schaeffler AG
- TABLE 378 Key Information - Parker Hannifin Corporation
- TABLE 379 key information - Analog Devices, Inc.
- TABLE 380 Key Information - Teledyne FLIR LLC
- TABLE 381 Key Information - Rockwell Automation, Inc.
- TABLE 382 Key Information - Baker Hughes Company
- TABLE 383 Key information -TE Connectivity Ltd.
LIST OF FIGURES
- FIG 1 Methodology for the research
- FIG 2 Global Vibration Monitoring Market, 2021 - 2032, USD Million
- FIG 3 Key Factors Impacting Vibration Monitoring Market
- FIG 4 KBV Cardinal Matrix
- FIG 5 Market Share Analysis, 2024
- FIG 6 Key Leading Strategies: Percentage Distribution (2021-2025)
- FIG 7 Key Strategic Move: (Partnerships, Collaborations & Agreements: 2021, Oct - 2021, Oct) Leading Players
- FIG 8 Porter's Five Forces Analysis - Vibration Monitoring Market
- FIG 9 Global Vibration Monitoring Market share by Process, 2024
- FIG 10 Global Vibration Monitoring Market share by Process, 2032
- FIG 11 Global Vibration Monitoring Market by Process, 2021 - 2032, USD Million
- FIG 12 Global Vibration Monitoring Market share by Component, 2024
- FIG 13 Global Vibration Monitoring Market share by Component, 2032
- FIG 14 Global Vibration Monitoring Market by Component, 2021 - 2032, USD Million
- FIG 15 Global Vibration Monitoring Market share by Industry, 2024
- FIG 16 Global Vibration Monitoring Market share by Industry, 2032
- FIG 17 Global Vibration Monitoring Market by Industry, 2021 - 2032, USD Million
- FIG 18 Global Vibration Monitoring Market share by Region, 2024
- FIG 19 Global Vibration Monitoring Market share by Region, 2032
- FIG 20 Global Vibration Monitoring Market by Region, 2021 - 2032, USD Million
- FIG 21 North America Vibration Monitoring Market, 2021 - 2032, USD Million
- FIG 22 North America Vibration Monitoring Market share by Process, 2024
- FIG 23 North America Vibration Monitoring Market share by Process, 2032
- FIG 24 North America Vibration Monitoring Market by Process, 2021 - 2032, USD Million
- FIG 25 North America Vibration Monitoring Market share by Component, 2024
- FIG 26 North America Vibration Monitoring Market share by Component, 2032
- FIG 27 North America Vibration Monitoring Market by Component, 2021 - 2032, USD Million
- FIG 28 North America Vibration Monitoring Market share by Industry, 2024
- FIG 29 North America Vibration Monitoring Market share by Industry, 2032
- FIG 30 North America Vibration Monitoring Market by Industry, 2021 - 2032, USD Million
- FIG 31 North America Vibration Monitoring Market share by Country, 2024
- FIG 32 North America Vibration Monitoring Market share by Country, 2032
- FIG 33 North America Vibration Monitoring Market by Country, 2021 - 2032, USD Million
- FIG 34 Europe Vibration Monitoring Market, 2021 - 2032, USD Million
- FIG 35 Europe Vibration Monitoring Market share by Process, 2024
- FIG 36 Europe Vibration Monitoring Market share by Process, 2032
- FIG 37 Europe Vibration Monitoring Market by Process, 2021 - 2032, USD Million
- FIG 38 Europe Vibration Monitoring Market share by Component, 2024
- FIG 39 Europe Vibration Monitoring Market share by Component, 2032
- FIG 40 Europe Vibration Monitoring Market by Component, 2021 - 2032, USD Million
- FIG 41 Europe Vibration Monitoring Market share by Industry, 2024
- FIG 42 Europe Vibration Monitoring Market share by Industry, 2032
- FIG 43 Europe Vibration Monitoring Market by Industry, 2021 - 2032, USD Million
- FIG 44 Europe Vibration Monitoring Market share by Country, 2024
- FIG 45 Europe Vibration Monitoring Market share by Country, 2032
- FIG 46 Europe Vibration Monitoring Market by Country, 2021 - 2032, USD Million
- FIG 47 Asia Pacific Vibration Monitoring Market, 2021 - 2032, USD Million
- FIG 48 Asia Pacific Vibration Monitoring Market share by Process, 2024
- FIG 49 Asia Pacific Vibration Monitoring Market share by Process, 2032
- FIG 50 Asia Pacific Vibration Monitoring Market by Process, 2021 - 2032, USD Million
- FIG 51 Asia Pacific Vibration Monitoring Market share by Component, 2024
- FIG 52 Asia Pacific Vibration Monitoring Market share by Component, 2032
- FIG 53 Asia Pacific Vibration Monitoring Market by Component, 2021 - 2032, USD Million
- FIG 54 Asia Pacific Vibration Monitoring Market share by Industry, 2024
- FIG 55 Asia Pacific Vibration Monitoring Market share by Industry, 2032
- FIG 56 Asia Pacific Vibration Monitoring Market by Industry, 2021 - 2032, USD Million
- FIG 57 Asia Pacific Vibration Monitoring Market share by Country, 2024
- FIG 58 Asia Pacific Vibration Monitoring Market share by Country, 2032
- FIG 59 Asia Pacific Vibration Monitoring Market by Country, 2021 - 2032, USD Million
- FIG 60 LAMEA Vibration Monitoring Market, 2021 - 2032, USD Million
- FIG 61 LAMEA Vibration Monitoring Market share by Process, 2024
- FIG 62 LAMEA Vibration Monitoring Market share by Process, 2032
- FIG 63 LAMEA Vibration Monitoring Market by Process, 2021 - 2032, USD Million
- FIG 64 LAMEA Vibration Monitoring Market share by Component, 2024
- FIG 65 LAMEA Vibration Monitoring Market share by Component, 2032
- FIG 66 LAMEA Vibration Monitoring Market by Component, 2021 - 2032, USD Million
- FIG 67 LAMEA Vibration Monitoring Market share by Industry, 2024
- FIG 68 LAMEA Vibration Monitoring Market share by Industry, 2032
- FIG 69 LAMEA Vibration Monitoring Market by Industry, 2021 - 2032, USD Million
- FIG 70 LAMEA Vibration Monitoring Market share by Country, 2024
- FIG 71 LAMEA Vibration Monitoring Market share by Country, 2032
- FIG 72 LAMEA Vibration Monitoring Market by Country, 2021 - 2032, USD Million
- FIG 73 SWOT Analysis: Honeywell international, inc.
- FIG 74 Swot Analysis: EMERSON ELECTRIC CO.
- FIG 75 Recent strategies and developments: SKF Group
- FIG 76 SWOT Analysis: SKF Group
- FIG 77 Recent strategies and developments: Schaeffler AG
- FIG 78 SWOT Analysis: Schaeffler AG
- FIG 79 Recent strategies and developments: Parker Hannifin Corporation
- FIG 80 SWOT Analysis: Parker Hannifin Corporation
- FIG 81 SWOT Analysis: Analog Devices, Inc.
- FIG 82 SWOT Analysis: Teledyne FLIR LLC
- FIG 83 SWOT Analysis: Rockwell Automation, Inc.
- FIG 84 SWOT Analysis: BAKER HUGHES COMPANY
- FIG 85 SWOT Analysis: TE Connectivity Ltd.
The Global Vibration Monitoring Market size is expected to reach $2.88 billion by 2032, rising at a market growth of 7.1% CAGR during the forecast period.
The North America segment recorded 34% revenue share in the market in 2024. The region's industries-particularly oil & gas, aerospace, automotive, and manufacturing-heavily rely on vibration monitoring systems to ensure operational efficiency and prevent costly equipment failures. Furthermore, stringent workplace safety and equipment maintenance regulations, coupled with increased investment in industrial automation and smart manufacturing, have driven the widespread implementation of vibration monitoring solutions across North America.
The major strategies followed by the market participants are Partnerships as the key developmental strategy to keep pace with the changing demands of end users. For instance, In October, 2024, SKF Group and DMG MORI collaborate to implement the SKF Insight(TM) Super-precision bearing system in machine tool spindles. This compact solution enables real-time monitoring of vibration, temperature, and load, enhancing machining precision, reliability, and supporting trends in vibration monitoring technology. Moreover, In September, 2023, Rockwell Automation, Inc. has partnered with Everactive to integrate batteryless, wireless condition-monitoring solutions into its Dynamix product line. This collaboration enhances asset monitoring, predictive maintenance, and reduces downtime for industrial customers, improving productivity and sustainability across operations.
KBV Cardinal Matrix - Vibration Monitoring Market Competition Analysis
Based on the Analysis presented in the KBV Cardinal matrix; Honeywell International, Inc. is the forerunners in the Vibration Monitoring Market. Companies such as TE Connectivity Ltd. and Parker Hannifin Corporation are some of the key innovators in Vibration Monitoring Market. In April, 2024, Parker Lord, a division of Parker Hannifin, collaborates with Bell Textron to provide elastomeric rotor components for the U.S. Army's Future Long Range Assault Aircraft (FLRAA), advancing air assault capabilities and enhancing noise, vibration, and harshness (NVH) control in aerospace.
Market Growth Factors
The shift from reactive to predictive maintenance strategies has become a key driver for expanding the market. Predictive maintenance utilizes real-time condition monitoring tools, including vibration analysis, to anticipate potential equipment failures before they occur. This proactive approach is increasingly favoured over traditional maintenance techniques, often leading to unplanned downtimes and higher repair costs. As a result, the market is experiencing robust growth, driven by the increasing preference for predictive over corrective maintenance approaches across global industries.
Additionally, The COVID-19 pandemic significantly disrupted on-site industrial operations, forcing businesses to reassess how they maintain critical assets while adhering to health and safety protocols. As physical presence on factory floors was minimized, the reliance on remote monitoring tools increased dramatically. Vibration monitoring, a cornerstone of condition-based maintenance, emerged as a vital solution for remote diagnostics and machine health monitoring. Hence, this has significantly boosted its adoption and positioned it as a key enabler of resilient, post-COVID industrial operations.
Market Restraining Factors
However, One significant constraint limiting the widespread adoption of vibration monitoring systems is the high upfront investment required for implementation. These systems often involve purchasing sophisticated sensors, data acquisition hardware, analytical software, and integration with existing IT infrastructure. Acquiring and deploying such comprehensive solutions can be financially burdensome for many small- and medium-sized enterprises (SMEs). In conclusion, companies, especially in price-sensitive regions or industries with thin profit margins, may delay or avoid adoption altogether, which slows the overall market growth of vibration monitoring technologies.
Process Outlook
By process, the market is divided into online vibration monitoring and portable vibration monitoring. The portable monitoring segment garnered 31% revenue share in the market in 2024. This segment gained traction due to its flexibility and cost-effectiveness, particularly for organizations seeking periodic or spot-check maintenance. Portable vibration monitoring devices, such as handheld analyzers and data collectors, are widely used to inspect equipment in less critical applications or in facilities with smaller machinery footprints.
Component Outlook
Based on component, the market is characterized into hardware, software, and services. The software segment procured 38% revenue share in the market in 2024. Vibration monitoring software helps interpret raw data collected by hardware devices, providing actionable insights and enabling timely decision-making. Industries are leveraging these software solutions to enhance operational efficiency, optimize maintenance schedules, and reduce unexpected machinery failures. Moreover, integrating artificial intelligence (AI) and machine learning (ML) in vibration analysis software has enhanced its predictive capabilities, further expanding its appeal across various end-user sectors.
Industry Outlook
Based on industry, the market is segmented into oil & gas, power generation, mining & metals, chemicals, automotive, aerospace, food & beverages, and others. The power generation segment held 14% revenue share in the market in 2024. Power plants depend on the reliable operation of turbines, generators, and auxiliary equipment, where any malfunction can lead to substantial downtime and loss of energy output. Vibration monitoring solutions provide a crucial layer of protection by enabling real-time insights into equipment conditions, supporting predictive maintenance, and reducing unplanned outages.
Regional Outlook
Region-wise, the market is analyzed across North America, Europe, Asia Pacific, and LAMEA. The Europe segment witnessed 31% revenue share in the market in 2024. European industries, including power generation, automotive, and aerospace, have actively integrated condition monitoring technologies to enhance machinery reliability and reduce carbon footprints through efficient maintenance practices.
Market Competition and Attributes
The Vibration Monitoring Market remains competitive due to the presence of numerous regional and mid-sized companies. These players focus on niche applications, offering cost-effective and innovative solutions for industries like manufacturing, energy, and transportation. The market sees healthy competition driven by technological advancements, wireless monitoring trends, and the growing demand for predictive maintenance solutions across diverse sectors.
Recent Strategies Deployed in the Market
- Sep-2024: Schaeffler AG presents new condition monitoring solutions at InnoTrans 2024, including onboard and track-based systems. Innovations include wireless axlebox monitoring, acoustic cameras for fault diagnosis, and cloud integration, enhancing predictive maintenance for rail vehicles with vibration sensors.
- Nov-2023: SKF Group launched the Enlight Collect IMx-1-EX wireless sensor for automated machine monitoring in hazardous areas. Certified for Zones 1 and 2, it enhances vibration monitoring, predicts machine failure, and improves safety, reducing costs and environmental concerns in industrial operations.
- Oct-2023: Emerson Electric Co. acquired NI, a provider of software-connected automated test and measurement systems. It enhances Emerson's capabilities in industrial measurement systems, where vibration monitoring technologies could complement NI's test and measurement solutions in various industries.
- Aug-2023: Emerson Electric Co. acquired Flexim to enhance its automation portfolio with ultrasonic flow measurement technology. This acquisition complements industrial measurement systems, where flow and vibration monitoring are often integrated for efficiency and maintenance.
- Mar-2023: Honeywell International, Inc. has launched its new Versatilis(TM) Transmitters, designed for condition-based monitoring of rotating equipment. Featuring vibration, temperature, and acoustic sensing, the wireless LoRaWAN(R)-enabled solution enhances predictive maintenance, boosts equipment reliability, and seamlessly integrates with SCADA and asset management platforms.
List of Key Companies Profiled
- Honeywell International, Inc.
- Emerson Electric Co.
- SKF Group
- Schaeffler AG
- Parker Hannifin Corporation
- Analog Devices, Inc.
- Teledyne FLIR LLC (Teledyne Technologies Incorporated)
- Rockwell Automation, Inc.
- Baker Hughes Company
- TE Connectivity Ltd.
Global Vibration Monitoring Market Report Segmentation
By Process
- Online
- Portable
By Component
- Hardware
- Software
- Services
By Industry
- Oil & Gas
- Power Generation
- Mining & Metals
- Chemicals
- Automotive
- Aerospace
- Other Industry
By Geography
- North America
- US
- Canada
- Mexico
- Rest of North America
- Europe
- Germany
- UK
- France
- Russia
- Spain
- Italy
- Rest of Europe
- Asia Pacific
- China
- Japan
- India
- South Korea
- Singapore
- Malaysia
- Rest of Asia Pacific
- LAMEA
- Brazil
- Argentina
- UAE
- Saudi Arabia
- South Africa
- Nigeria
- Rest of LAMEA
Table of Contents
Chapter 1. Market Scope & Methodology
- 1.1 Market Definition
- 1.2 Objectives
- 1.3 Market Scope
- 1.4 Segmentation
- 1.4.1 Global Vibration Monitoring Market, by Process
- 1.4.2 Global Vibration Monitoring Market, by Component
- 1.4.3 Global Vibration Monitoring Market, by Industry
- 1.4.4 Global Vibration Monitoring Market, by Geography
- 1.5 Methodology for the research
Chapter 2. Market at a Glance
- 2.1 Key Highlights
Chapter 3. Market Overview
- 3.1 Introduction
- 3.1.1 Overview
- 3.1.1.1 Market Composition and Scenario
- 3.1.1 Overview
- 3.2 Key Factors Impacting the Market
- 3.2.1 Market Drivers
- 3.2.2 Market Restraints
- 3.2.3 Market Opportunities
- 3.2.4 Market Challenges
Chapter 4. Competition Analysis - Global
- 4.1 KBV Cardinal Matrix
- 4.2 Recent Industry Wide Strategic Developments
- 4.2.1 Partnerships, Collaborations and Agreements
- 4.2.2 Product Launches and Product Expansions
- 4.2.3 Acquisition and Mergers
- 4.3 Market Share Analysis, 2024
- 4.4 Top Winning Strategies
- 4.4.1 Key Leading Strategies: Percentage Distribution (2021-2025)
- 4.4.2 Key Strategic Move: (Partnerships, Collaborations & Agreements: 2021, Oct - 2021, Oct) Leading Players
- 4.5 Porter Five Forces Analysis
Chapter 5. Global Vibration Monitoring Market by Process
- 5.1 Global Online Market by Region
- 5.2 Global Portable Market by Region
Chapter 6. Global Vibration Monitoring Market by Component
- 6.1 Global Hardware Market by Region
- 6.2 Global Software Market by Region
- 6.3 Global Services Market by Region
Chapter 7. Global Vibration Monitoring Market by Industry
- 7.1 Global Oil & Gas Market by Region
- 7.2 Global Power Generation Market by Region
- 7.3 Global Mining & Metals Market by Region
- 7.4 Global Chemicals Market by Region
- 7.5 Global Automotive Market by Region
- 7.6 Global Aerospace Market by Region
- 7.7 Global Other Industry Market by Region
Chapter 8. Global Vibration Monitoring Market by Region
- 8.1 North America Vibration Monitoring Market
- 8.1.1 North America Vibration Monitoring Market by Process
- 8.1.1.1 North America Online Market by Region
- 8.1.1.2 North America Portable Market by Region
- 8.1.2 North America Vibration Monitoring Market by Component
- 8.1.2.1 North America Hardware Market by Country
- 8.1.2.2 North America Software Market by Country
- 8.1.2.3 North America Services Market by Country
- 8.1.3 North America Vibration Monitoring Market by Industry
- 8.1.3.1 North America Oil & Gas Market by Country
- 8.1.3.2 North America Power Generation Market by Country
- 8.1.3.3 North America Mining & Metals Market by Country
- 8.1.3.4 North America Chemicals Market by Country
- 8.1.3.5 North America Automotive Market by Country
- 8.1.3.6 North America Aerospace Market by Country
- 8.1.3.7 North America Other Industry Market by Country
- 8.1.4 North America Vibration Monitoring Market by Country
- 8.1.4.1 US Vibration Monitoring Market
- 8.1.4.1.1 US Vibration Monitoring Market by Process
- 8.1.4.1.2 US Vibration Monitoring Market by Component
- 8.1.4.1.3 US Vibration Monitoring Market by Industry
- 8.1.4.2 Canada Vibration Monitoring Market
- 8.1.4.2.1 Canada Vibration Monitoring Market by Process
- 8.1.4.2.2 Canada Vibration Monitoring Market by Component
- 8.1.4.2.3 Canada Vibration Monitoring Market by Industry
- 8.1.4.3 Mexico Vibration Monitoring Market
- 8.1.4.3.1 Mexico Vibration Monitoring Market by Process
- 8.1.4.3.2 Mexico Vibration Monitoring Market by Component
- 8.1.4.3.3 Mexico Vibration Monitoring Market by Industry
- 8.1.4.4 Rest of North America Vibration Monitoring Market
- 8.1.4.4.1 Rest of North America Vibration Monitoring Market by Process
- 8.1.4.4.2 Rest of North America Vibration Monitoring Market by Component
- 8.1.4.4.3 Rest of North America Vibration Monitoring Market by Industry
- 8.1.4.1 US Vibration Monitoring Market
- 8.1.1 North America Vibration Monitoring Market by Process
- 8.2 Europe Vibration Monitoring Market
- 8.2.1 Europe Vibration Monitoring Market by Process
- 8.2.1.1 Europe Online Market by Country
- 8.2.1.2 Europe Portable Market by Country
- 8.2.2 Europe Vibration Monitoring Market by Component
- 8.2.2.1 Europe Hardware Market by Country
- 8.2.2.2 Europe Software Market by Country
- 8.2.2.3 Europe Services Market by Country
- 8.2.3 Europe Vibration Monitoring Market by Industry
- 8.2.3.1 Europe Oil & Gas Market by Country
- 8.2.3.2 Europe Power Generation Market by Country
- 8.2.3.3 Europe Mining & Metals Market by Country
- 8.2.3.4 Europe Chemicals Market by Country
- 8.2.3.5 Europe Automotive Market by Country
- 8.2.3.6 Europe Aerospace Market by Country
- 8.2.3.7 Europe Other Industry Market by Country
- 8.2.4 Europe Vibration Monitoring Market by Country
- 8.2.4.1 Germany Vibration Monitoring Market
- 8.2.4.1.1 Germany Vibration Monitoring Market by Process
- 8.2.4.1.2 Germany Vibration Monitoring Market by Component
- 8.2.4.1.3 Germany Vibration Monitoring Market by Industry
- 8.2.4.2 UK Vibration Monitoring Market
- 8.2.4.2.1 UK Vibration Monitoring Market by Process
- 8.2.4.2.2 UK Vibration Monitoring Market by Component
- 8.2.4.2.3 UK Vibration Monitoring Market by Industry
- 8.2.4.3 France Vibration Monitoring Market
- 8.2.4.3.1 France Vibration Monitoring Market by Process
- 8.2.4.3.2 France Vibration Monitoring Market by Component
- 8.2.4.3.3 France Vibration Monitoring Market by Industry
- 8.2.4.4 Russia Vibration Monitoring Market
- 8.2.4.4.1 Russia Vibration Monitoring Market by Process
- 8.2.4.4.2 Russia Vibration Monitoring Market by Component
- 8.2.4.4.3 Russia Vibration Monitoring Market by Industry
- 8.2.4.5 Spain Vibration Monitoring Market
- 8.2.4.5.1 Spain Vibration Monitoring Market by Process
- 8.2.4.5.2 Spain Vibration Monitoring Market by Component
- 8.2.4.5.3 Spain Vibration Monitoring Market by Industry
- 8.2.4.6 Italy Vibration Monitoring Market
- 8.2.4.6.1 Italy Vibration Monitoring Market by Process
- 8.2.4.6.2 Italy Vibration Monitoring Market by Component
- 8.2.4.6.3 Italy Vibration Monitoring Market by Industry
- 8.2.4.7 Rest of Europe Vibration Monitoring Market
- 8.2.4.7.1 Rest of Europe Vibration Monitoring Market by Process
- 8.2.4.7.2 Rest of Europe Vibration Monitoring Market by Component
- 8.2.4.7.3 Rest of Europe Vibration Monitoring Market by Industry
- 8.2.4.1 Germany Vibration Monitoring Market
- 8.2.1 Europe Vibration Monitoring Market by Process
- 8.3 Asia Pacific Vibration Monitoring Market
- 8.3.1 Asia Pacific Vibration Monitoring Market by Process
- 8.3.1.1 Asia Pacific Online Market by Country
- 8.3.1.2 Asia Pacific Portable Market by Country
- 8.3.2 Asia Pacific Vibration Monitoring Market by Component
- 8.3.2.1 Asia Pacific Hardware Market by Country
- 8.3.2.2 Asia Pacific Software Market by Country
- 8.3.2.3 Asia Pacific Services Market by Country
- 8.3.3 Asia Pacific Vibration Monitoring Market by Industry
- 8.3.3.1 Asia Pacific Oil & Gas Market by Country
- 8.3.3.2 Asia Pacific Power Generation Market by Country
- 8.3.3.3 Asia Pacific Mining & Metals Market by Country
- 8.3.3.4 Asia Pacific Chemicals Market by Country
- 8.3.3.5 Asia Pacific Automotive Market by Country
- 8.3.3.6 Asia Pacific Aerospace Market by Country
- 8.3.3.7 Asia Pacific Other Industry Market by Country
- 8.3.4 Asia Pacific Vibration Monitoring Market by Country
- 8.3.4.1 China Vibration Monitoring Market
- 8.3.4.1.1 China Vibration Monitoring Market by Process
- 8.3.4.1.2 China Vibration Monitoring Market by Component
- 8.3.4.1.3 China Vibration Monitoring Market by Industry
- 8.3.4.2 Japan Vibration Monitoring Market
- 8.3.4.2.1 Japan Vibration Monitoring Market by Process
- 8.3.4.2.2 Japan Vibration Monitoring Market by Component
- 8.3.4.2.3 Japan Vibration Monitoring Market by Industry
- 8.3.4.3 India Vibration Monitoring Market
- 8.3.4.3.1 India Vibration Monitoring Market by Process
- 8.3.4.3.2 India Vibration Monitoring Market by Component
- 8.3.4.3.3 India Vibration Monitoring Market by Industry
- 8.3.4.4 South Korea Vibration Monitoring Market
- 8.3.4.4.1 South Korea Vibration Monitoring Market by Process
- 8.3.4.4.2 South Korea Vibration Monitoring Market by Component
- 8.3.4.4.3 South Korea Vibration Monitoring Market by Industry
- 8.3.4.5 Singapore Vibration Monitoring Market
- 8.3.4.5.1 Singapore Vibration Monitoring Market by Process
- 8.3.4.5.2 Singapore Vibration Monitoring Market by Component
- 8.3.4.5.3 Singapore Vibration Monitoring Market by Industry
- 8.3.4.6 Malaysia Vibration Monitoring Market
- 8.3.4.6.1 Malaysia Vibration Monitoring Market by Process
- 8.3.4.6.2 Malaysia Vibration Monitoring Market by Component
- 8.3.4.6.3 Malaysia Vibration Monitoring Market by Industry
- 8.3.4.7 Rest of Asia Pacific Vibration Monitoring Market
- 8.3.4.7.1 Rest of Asia Pacific Vibration Monitoring Market by Process
- 8.3.4.7.2 Rest of Asia Pacific Vibration Monitoring Market by Component
- 8.3.4.7.3 Rest of Asia Pacific Vibration Monitoring Market by Industry
- 8.3.4.1 China Vibration Monitoring Market
- 8.3.1 Asia Pacific Vibration Monitoring Market by Process
- 8.4 LAMEA Vibration Monitoring Market
- 8.4.1 LAMEA Vibration Monitoring Market by Process
- 8.4.1.1 LAMEA Online Market by Country
- 8.4.1.2 LAMEA Portable Market by Country
- 8.4.2 LAMEA Vibration Monitoring Market by Component
- 8.4.2.1 LAMEA Hardware Market by Country
- 8.4.2.2 LAMEA Software Market by Country
- 8.4.2.3 LAMEA Services Market by Country
- 8.4.3 LAMEA Vibration Monitoring Market by Industry
- 8.4.3.1 LAMEA Oil & Gas Market by Country
- 8.4.3.2 LAMEA Power Generation Market by Country
- 8.4.3.3 LAMEA Mining & Metals Market by Country
- 8.4.3.4 LAMEA Chemicals Market by Country
- 8.4.3.5 LAMEA Automotive Market by Country
- 8.4.3.6 LAMEA Aerospace Market by Country
- 8.4.3.7 LAMEA Other Industry Market by Country
- 8.4.4 LAMEA Vibration Monitoring Market by Country
- 8.4.4.1 Brazil Vibration Monitoring Market
- 8.4.4.1.1 Brazil Vibration Monitoring Market by Process
- 8.4.4.1.2 Brazil Vibration Monitoring Market by Component
- 8.4.4.1.3 Brazil Vibration Monitoring Market by Industry
- 8.4.4.2 Argentina Vibration Monitoring Market
- 8.4.4.2.1 Argentina Vibration Monitoring Market by Process
- 8.4.4.2.2 Argentina Vibration Monitoring Market by Component
- 8.4.4.2.3 Argentina Vibration Monitoring Market by Industry
- 8.4.4.3 UAE Vibration Monitoring Market
- 8.4.4.3.1 UAE Vibration Monitoring Market by Process
- 8.4.4.3.2 UAE Vibration Monitoring Market by Component
- 8.4.4.3.3 UAE Vibration Monitoring Market by Industry
- 8.4.4.4 Saudi Arabia Vibration Monitoring Market
- 8.4.4.4.1 Saudi Arabia Vibration Monitoring Market by Process
- 8.4.4.4.2 Saudi Arabia Vibration Monitoring Market by Component
- 8.4.4.4.3 Saudi Arabia Vibration Monitoring Market by Industry
- 8.4.4.5 South Africa Vibration Monitoring Market
- 8.4.4.5.1 South Africa Vibration Monitoring Market by Process
- 8.4.4.5.2 South Africa Vibration Monitoring Market by Component
- 8.4.4.5.3 South Africa Vibration Monitoring Market by Industry
- 8.4.4.6 Nigeria Vibration Monitoring Market
- 8.4.4.6.1 Nigeria Vibration Monitoring Market by Process
- 8.4.4.6.2 Nigeria Vibration Monitoring Market by Component
- 8.4.4.6.3 Nigeria Vibration Monitoring Market by Industry
- 8.4.4.7 Rest of LAMEA Vibration Monitoring Market
- 8.4.4.7.1 Rest of LAMEA Vibration Monitoring Market by Process
- 8.4.4.7.2 Rest of LAMEA Vibration Monitoring Market by Component
- 8.4.4.7.3 Rest of LAMEA Vibration Monitoring Market by Industry
- 8.4.4.1 Brazil Vibration Monitoring Market
- 8.4.1 LAMEA Vibration Monitoring Market by Process
Chapter 9. Company Profiles
- 9.1 Honeywell International, Inc.
- 9.1.1 Company Overview
- 9.1.2 Financial Analysis
- 9.1.3 Segmental and Regional Analysis
- 9.1.4 Research & Development Expenses
- 9.1.5 Recent strategies and developments:
- 9.1.5.1 Partnerships, Collaborations, and Agreements:
- 9.1.6 SWOT Analysis
- 9.2 Emerson Electric Co.
- 9.2.1 Company Overview
- 9.2.2 Financial Analysis
- 9.2.3 Segmental and Regional Analysis
- 9.2.4 Research & Development Expense
- 9.2.5 Recent strategies and developments:
- 9.2.5.1 Acquisition and Mergers:
- 9.2.6 SWOT Analysis
- 9.3 SKF Group
- 9.3.1 Company Overview
- 9.3.2 Financial Analysis
- 9.3.3 Segmental and Regional Analysis
- 9.3.4 Research & Development Expenses
- 9.3.5 Recent strategies and developments:
- 9.3.5.1 Partnerships, Collaborations, and Agreements:
- 9.3.5.2 Product Launches and Product Expansions:
- 9.3.6 SWOT Analysis
- 9.4 Schaeffler AG
- 9.4.1 Company Overview
- 9.4.2 Financial Analysis
- 9.4.3 Segmental and Regional Analysis
- 9.4.4 Research & Development Expenses
- 9.4.5 Recent strategies and developments:
- 9.4.5.1 Product Launches and Product Expansions:
- 9.4.5.2 Acquisition and Mergers:
- 9.4.6 SWOT Analysis
- 9.5 Parker Hannifin Corporation
- 9.5.1 Company Overview
- 9.5.2 Financial Analysis
- 9.5.3 Segmental and Regional Analysis
- 9.5.4 Research & Development Expenses
- 9.5.5 Recent strategies and developments:
- 9.5.5.1 Partnerships, Collaborations, and Agreements:
- 9.5.5.2 Product Launches and Product Expansions:
- 9.5.5.3 Acquisition and Mergers:
- 9.5.6 SWOT Analysis
- 9.6 Analog Devices, Inc.
- 9.6.1 Company Overview
- 9.6.2 Financial Analysis
- 9.6.3 Regional Analysis
- 9.6.4 Research & Development Expenses
- 9.6.5 Recent strategies and developments:
- 9.6.5.1 Partnerships, Collaborations, and Agreements:
- 9.6.6 SWOT Analysis
- 9.7 Teledyne FLIR LLC (Teledyne Technologies Incorporated)
- 9.7.1 Company Overview
- 9.7.2 Financial Analysis
- 9.7.3 Segmental and Regional Analysis
- 9.7.4 Research & Development Expense
- 9.7.5 SWOT Analysis
- 9.8 Rockwell Automation, Inc.
- 9.8.1 Company Overview
- 9.8.2 Financial Analysis
- 9.8.3 Segmental and Regional Analysis
- 9.8.4 Research & Development Expenses
- 9.8.5 Recent strategies and developments:
- 9.8.5.1 Partnerships, Collaborations, and Agreements:
- 9.8.6 SWOT Analysis
- 9.9 Baker Hughes Company
- 9.9.1 Company Overview
- 9.9.2 Financial Analysis
- 9.9.3 Segmental and Regional Analysis
- 9.9.4 Research & Development Expenses
- 9.9.5 Recent strategies and developments:
- 9.9.5.1 Partnerships, Collaborations, and Agreements:
- 9.9.6 SWOT Analysis
- 9.10. TE Connectivity Ltd.
- 9.10.1 Company Overview
- 9.10.2 Financial Analysis
- 9.10.3 Segmental and Regional Analysis
- 9.10.4 Research & Development Expense
- 9.10.5 SWOT Analysis
