|
|
市場調査レポート
商品コード
1709911
光ファイバーの世界市場規模、シェア、動向分析レポート:タイプ別、用途別、地域別展望と予測、2024年~2031年Global Fiber Optics Market Size, Share & Trends Analysis Report By Type (Multi-mode, Single mode, and Plastic Optical Fiber (POF)), By Application, By Regional Outlook and Forecast, 2024 - 2031 |
||||||
|
|||||||
|
|||||||

| 光ファイバーの世界市場規模、シェア、動向分析レポート:タイプ別、用途別、地域別展望と予測、2024年~2031年 |
|
出版日: 2025年04月02日
発行: KBV Research
ページ情報: 英文 227 Pages
納期: 即納可能
|

全表示
- 概要
- 図表
- 目次
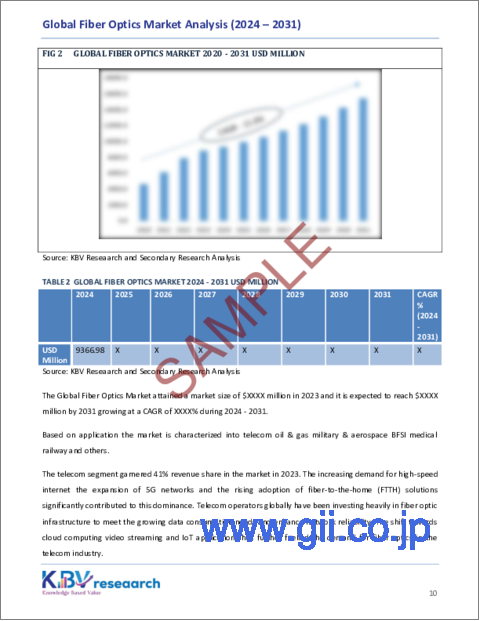
光ファイバーの世界市場規模は、予測期間中に7.4%のCAGRで市場成長し、2031年までに154億3,000万米ドルに達すると予想されています。
しかし、光ファイバー導入における最大の課題の一つは、インフラ開発に必要な初期投資額の高さです。光ファイバーケーブル、特殊機器、掘削、設置にかかるコストは、従来の銅線や無線ネットワークに比べて大幅に高額です。そのため、小規模な通信事業者、インターネットサービスプロバイダー(ISP)、そして地方自治体にとって、大規模に光ファイバーを導入することは困難です。
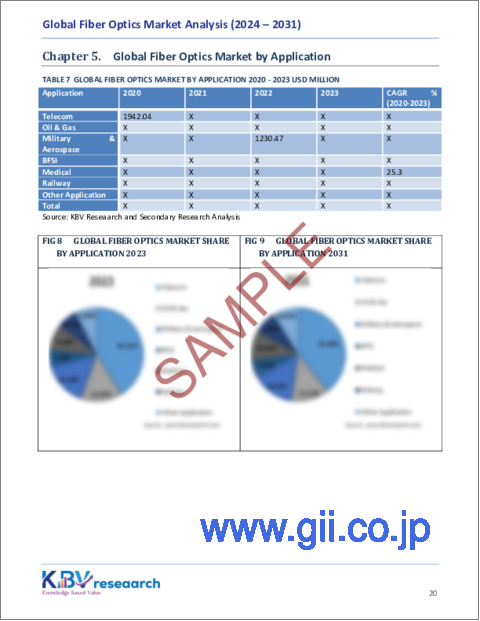
用途の見通し
用途別に見ると、市場は通信、石油・ガス、軍事・航空宇宙、BFSI、医療、鉄道などに分類されます。石油・ガス分野は、2023年に市場の14%の収益シェアを獲得しました。光ファイバー技術は、パイプライン、オフショアプラットフォーム、ダウンホールアプリケーションのリアルタイム監視に広く利用されています。光ファイバーは、信号損失なしに長距離でも正確なデータトランスミッションが可能であるため、石油・ガスの探査・生産活動に最適です。さらに、過酷な環境における安全性と効率性への関心の高まりにより、漏洩検知、地震監視、温度検知などの用途で光ファイバーセンシングソリューションの採用が進んでいます。
タイプの見通し
タイプ別に見ると、市場はシングルモード、マルチモード、プラスチック光ファイバー(POF)に分類されます。シングルモードセグメントは、2023年に市場の39%の収益シェアを記録しました。シングルモード光ファイバーは、電気通信、海底ケーブル、メトロポリタンエリアネットワーク(MAN)などの長距離通信ネットワークで広く使用されています。信号損失を最小限に抑えながら長距離データを伝送できるため、現代の通信インフラにとって不可欠な要素となっています。5Gネットワークの拡大、高速インターネットへの需要の高まり、スマートシティプロジェクトへの投資の増加は、シングルモード光ファイバーセグメントの着実な成長に貢献しています。
地域の見通し
地域別に見ると、市場は北米、欧州、アジア太平洋、ラテンアメリカ、中東・アフリカで分析されています。北米セグメントは、2023年に市場で30%の収益シェアを記録しました。この成長は、高速インターネットの需要の増加、5Gインフラの拡張、および通信事業者による光ファイバーネットワークへの多額の投資によって推進されました。ヘルスケア、BFSI、航空宇宙などの業界における光ファイバーの採用の増加も、この地域における市場の優位性に貢献しました。さらに、ブロードバンド接続を改善するための政府の取り組みと、Fiber To The Home(FTTH)サービスの導入の増加は、北米における光ファイバー市場の拡大をさらに促進しました。
目次
第1章 市場範囲と調査手法
- 市場の定義
- 目的
- 市場範囲
- セグメンテーション
- 調査手法
第2章 市場要覧
- 主要なハイライト
第3章 市場概要
- イントロダクション
- 概要
- 市場構成とシナリオ
- 概要
- 市場に影響を与える主要な要因
- 市場促進要因
- 市場抑制要因
- 市場機会
- 市場の課題
- ポーターファイブフォース分析
第4章 世界の光ファイバー市場:タイプ別
- 世界のマルチモード市場:地域別
- 世界のシングルモード市場:地域別
- 世界のプラスチック光ファイバー(POF)市場:地域別
第5章 世界の光ファイバー市場:用途別
- 世界の通信市場:地域別
- 世界の石油・ガス市場:地域別
- 世界の軍事・航空宇宙市場:地域別
- 世界のBFSI市場:地域別
- 世界の医療市場:地域別
- 世界の鉄道市場:地域別
- 世界のその他の用途市場:地域別
第6章 世界の光ファイバー市場:地域別
- 北米
- 北米の光ファイバー市場:国別
- 米国
- カナダ
- メキシコ
- その他北米地域
- 北米の光ファイバー市場:国別
- 欧州
- 欧州の光ファイバー市場:国別
- ドイツ
- 英国
- フランス
- ロシア
- スペイン
- イタリア
- その他欧州地域
- 欧州の光ファイバー市場:国別
- アジア太平洋
- アジア太平洋の光ファイバー市場:国別
- 中国
- 日本
- インド
- 韓国
- オーストラリア
- マレーシア
- その他アジア太平洋
- アジア太平洋の光ファイバー市場:国別
- ラテンアメリカ、中東・アフリカ
- ラテンアメリカ、中東・アフリカの光ファイバー市場:国別
- ブラジル
- アルゼンチン
- アラブ首長国連邦
- サウジアラビア
- 南アフリカ
- ナイジェリア
- その他ラテンアメリカ、中東・アフリカ地域
- ラテンアメリカ、中東・アフリカの光ファイバー市場:国別
第7章 企業プロファイル
- Corning Incorporated
- Prysmian Group
- Sumitomo Electric Industries, Ltd
- Nexans SA
- Fujikura Ltd
- Leoni AG
- Hengtong Group Co, Ltd.
- TE Connectivity Ltd
- PCT International, Inc
- Coherent Corp
第8章 光ファイバー市場の成功必須条件
LIST OF TABLES
- TABLE 1 Global Fiber Optics Market, 2020 - 2023, USD Million
- TABLE 2 Global Fiber Optics Market, 2024 - 2031, USD Million
- TABLE 3 Global Fiber Optics Market by Type, 2020 - 2023, USD Million
- TABLE 4 Global Fiber Optics Market by Type, 2024 - 2031, USD Million
- TABLE 5 Global Multi-mode Market by Region, 2020 - 2023, USD Million
- TABLE 6 Global Multi-mode Market by Region, 2024 - 2031, USD Million
- TABLE 7 Global Single mode Market by Region, 2020 - 2023, USD Million
- TABLE 8 Global Single mode Market by Region, 2024 - 2031, USD Million
- TABLE 9 Global Plastic Optical Fiber (POF) Market by Region, 2020 - 2023, USD Million
- TABLE 10 Global Plastic Optical Fiber (POF) Market by Region, 2024 - 2031, USD Million
- TABLE 11 Global Fiber Optics Market by Application, 2020 - 2023, USD Million
- TABLE 12 Global Fiber Optics Market by Application, 2024 - 2031, USD Million
- TABLE 13 Global Telecom Market by Region, 2020 - 2023, USD Million
- TABLE 14 Global Telecom Market by Region, 2024 - 2031, USD Million
- TABLE 15 Global Oil & Gas Market by Region, 2020 - 2023, USD Million
- TABLE 16 Global Oil & Gas Market by Region, 2024 - 2031, USD Million
- TABLE 17 Global Military & Aerospace Market by Region, 2020 - 2023, USD Million
- TABLE 18 Global Military & Aerospace Market by Region, 2024 - 2031, USD Million
- TABLE 19 Global BFSI Market by Region, 2020 - 2023, USD Million
- TABLE 20 Global BFSI Market by Region, 2024 - 2031, USD Million
- TABLE 21 Global Medical Market by Region, 2020 - 2023, USD Million
- TABLE 22 Global Medical Market by Region, 2024 - 2031, USD Million
- TABLE 23 Global Railway Market by Region, 2020 - 2023, USD Million
- TABLE 24 Global Railway Market by Region, 2024 - 2031, USD Million
- TABLE 25 Global Other Application Market by Region, 2020 - 2023, USD Million
- TABLE 26 Global Other Application Market by Region, 2024 - 2031, USD Million
- TABLE 27 Global Fiber Optics Market by Region, 2020 - 2023, USD Million
- TABLE 28 Global Fiber Optics Market by Region, 2024 - 2031, USD Million
- TABLE 29 North America Fiber Optics Market, 2020 - 2023, USD Million
- TABLE 30 North America Fiber Optics Market, 2024 - 2031, USD Million
- TABLE 31 North America Fiber Optics Market by Type, 2020 - 2023, USD Million
- TABLE 32 North America Fiber Optics Market by Type, 2024 - 2031, USD Million
- TABLE 33 North America Multi-mode Market by Country, 2020 - 2023, USD Million
- TABLE 34 North America Multi-mode Market by Country, 2024 - 2031, USD Million
- TABLE 35 North America Single mode Market by Country, 2020 - 2023, USD Million
- TABLE 36 North America Single mode Market by Country, 2024 - 2031, USD Million
- TABLE 37 North America Plastic Optical Fiber (POF) Market by Country, 2020 - 2023, USD Million
- TABLE 38 North America Plastic Optical Fiber (POF) Market by Country, 2024 - 2031, USD Million
- TABLE 39 North America Fiber Optics Market by Application, 2020 - 2023, USD Million
- TABLE 40 North America Fiber Optics Market by Application, 2024 - 2031, USD Million
- TABLE 41 North America Telecom Market by Country, 2020 - 2023, USD Million
- TABLE 42 North America Telecom Market by Country, 2024 - 2031, USD Million
- TABLE 43 North America Oil & Gas Market by Country, 2020 - 2023, USD Million
- TABLE 44 North America Oil & Gas Market by Country, 2024 - 2031, USD Million
- TABLE 45 North America Military & Aerospace Market by Country, 2020 - 2023, USD Million
- TABLE 46 North America Military & Aerospace Market by Country, 2024 - 2031, USD Million
- TABLE 47 North America BFSI Market by Country, 2020 - 2023, USD Million
- TABLE 48 North America BFSI Market by Country, 2024 - 2031, USD Million
- TABLE 49 North America Medical Market by Country, 2020 - 2023, USD Million
- TABLE 50 North America Medical Market by Country, 2024 - 2031, USD Million
- TABLE 51 North America Railway Market by Country, 2020 - 2023, USD Million
- TABLE 52 North America Railway Market by Country, 2024 - 2031, USD Million
- TABLE 53 North America Other Application Market by Country, 2020 - 2023, USD Million
- TABLE 54 North America Other Application Market by Country, 2024 - 2031, USD Million
- TABLE 55 North America Fiber Optics Market by Country, 2020 - 2023, USD Million
- TABLE 56 North America Fiber Optics Market by Country, 2024 - 2031, USD Million
- TABLE 57 US Fiber Optics Market, 2020 - 2023, USD Million
- TABLE 58 US Fiber Optics Market, 2024 - 2031, USD Million
- TABLE 59 US Fiber Optics Market by Type, 2020 - 2023, USD Million
- TABLE 60 US Fiber Optics Market by Type, 2024 - 2031, USD Million
- TABLE 61 US Fiber Optics Market by Application, 2020 - 2023, USD Million
- TABLE 62 US Fiber Optics Market by Application, 2024 - 2031, USD Million
- TABLE 63 Canada Fiber Optics Market, 2020 - 2023, USD Million
- TABLE 64 Canada Fiber Optics Market, 2024 - 2031, USD Million
- TABLE 65 Canada Fiber Optics Market by Type, 2020 - 2023, USD Million
- TABLE 66 Canada Fiber Optics Market by Type, 2024 - 2031, USD Million
- TABLE 67 Canada Fiber Optics Market by Application, 2020 - 2023, USD Million
- TABLE 68 Canada Fiber Optics Market by Application, 2024 - 2031, USD Million
- TABLE 69 Mexico Fiber Optics Market, 2020 - 2023, USD Million
- TABLE 70 Mexico Fiber Optics Market, 2024 - 2031, USD Million
- TABLE 71 Mexico Fiber Optics Market by Type, 2020 - 2023, USD Million
- TABLE 72 Mexico Fiber Optics Market by Type, 2024 - 2031, USD Million
- TABLE 73 Mexico Fiber Optics Market by Application, 2020 - 2023, USD Million
- TABLE 74 Mexico Fiber Optics Market by Application, 2024 - 2031, USD Million
- TABLE 75 Rest of North America Fiber Optics Market, 2020 - 2023, USD Million
- TABLE 76 Rest of North America Fiber Optics Market, 2024 - 2031, USD Million
- TABLE 77 Rest of North America Fiber Optics Market by Type, 2020 - 2023, USD Million
- TABLE 78 Rest of North America Fiber Optics Market by Type, 2024 - 2031, USD Million
- TABLE 79 Rest of North America Fiber Optics Market by Application, 2020 - 2023, USD Million
- TABLE 80 Rest of North America Fiber Optics Market by Application, 2024 - 2031, USD Million
- TABLE 81 Europe Fiber Optics Market, 2020 - 2023, USD Million
- TABLE 82 Europe Fiber Optics Market, 2024 - 2031, USD Million
- TABLE 83 Europe Fiber Optics Market by Type, 2020 - 2023, USD Million
- TABLE 84 Europe Fiber Optics Market by Type, 2024 - 2031, USD Million
- TABLE 85 Europe Multi-mode Market by Country, 2020 - 2023, USD Million
- TABLE 86 Europe Multi-mode Market by Country, 2024 - 2031, USD Million
- TABLE 87 Europe Single mode Market by Country, 2020 - 2023, USD Million
- TABLE 88 Europe Single mode Market by Country, 2024 - 2031, USD Million
- TABLE 89 Europe Plastic Optical Fiber (POF) Market by Country, 2020 - 2023, USD Million
- TABLE 90 Europe Plastic Optical Fiber (POF) Market by Country, 2024 - 2031, USD Million
- TABLE 91 Europe Fiber Optics Market by Application, 2020 - 2023, USD Million
- TABLE 92 Europe Fiber Optics Market by Application, 2024 - 2031, USD Million
- TABLE 93 Europe Telecom Market by Country, 2020 - 2023, USD Million
- TABLE 94 Europe Telecom Market by Country, 2024 - 2031, USD Million
- TABLE 95 Europe Oil & Gas Market by Country, 2020 - 2023, USD Million
- TABLE 96 Europe Oil & Gas Market by Country, 2024 - 2031, USD Million
- TABLE 97 Europe Military & Aerospace Market by Country, 2020 - 2023, USD Million
- TABLE 98 Europe Military & Aerospace Market by Country, 2024 - 2031, USD Million
- TABLE 99 Europe BFSI Market by Country, 2020 - 2023, USD Million
- TABLE 100 Europe BFSI Market by Country, 2024 - 2031, USD Million
- TABLE 101 Europe Medical Market by Country, 2020 - 2023, USD Million
- TABLE 102 Europe Medical Market by Country, 2024 - 2031, USD Million
- TABLE 103 Europe Railway Market by Country, 2020 - 2023, USD Million
- TABLE 104 Europe Railway Market by Country, 2024 - 2031, USD Million
- TABLE 105 Europe Other Application Market by Country, 2020 - 2023, USD Million
- TABLE 106 Europe Other Application Market by Country, 2024 - 2031, USD Million
- TABLE 107 Europe Fiber Optics Market by Country, 2020 - 2023, USD Million
- TABLE 108 Europe Fiber Optics Market by Country, 2024 - 2031, USD Million
- TABLE 109 Germany Fiber Optics Market, 2020 - 2023, USD Million
- TABLE 110 Germany Fiber Optics Market, 2024 - 2031, USD Million
- TABLE 111 Germany Fiber Optics Market by Type, 2020 - 2023, USD Million
- TABLE 112 Germany Fiber Optics Market by Type, 2024 - 2031, USD Million
- TABLE 113 Germany Fiber Optics Market by Application, 2020 - 2023, USD Million
- TABLE 114 Germany Fiber Optics Market by Application, 2024 - 2031, USD Million
- TABLE 115 UK Fiber Optics Market, 2020 - 2023, USD Million
- TABLE 116 UK Fiber Optics Market, 2024 - 2031, USD Million
- TABLE 117 UK Fiber Optics Market by Type, 2020 - 2023, USD Million
- TABLE 118 UK Fiber Optics Market by Type, 2024 - 2031, USD Million
- TABLE 119 UK Fiber Optics Market by Application, 2020 - 2023, USD Million
- TABLE 120 UK Fiber Optics Market by Application, 2024 - 2031, USD Million
- TABLE 121 France Fiber Optics Market, 2020 - 2023, USD Million
- TABLE 122 France Fiber Optics Market, 2024 - 2031, USD Million
- TABLE 123 France Fiber Optics Market by Type, 2020 - 2023, USD Million
- TABLE 124 France Fiber Optics Market by Type, 2024 - 2031, USD Million
- TABLE 125 France Fiber Optics Market by Application, 2020 - 2023, USD Million
- TABLE 126 France Fiber Optics Market by Application, 2024 - 2031, USD Million
- TABLE 127 Russia Fiber Optics Market, 2020 - 2023, USD Million
- TABLE 128 Russia Fiber Optics Market, 2024 - 2031, USD Million
- TABLE 129 Russia Fiber Optics Market by Type, 2020 - 2023, USD Million
- TABLE 130 Russia Fiber Optics Market by Type, 2024 - 2031, USD Million
- TABLE 131 Russia Fiber Optics Market by Application, 2020 - 2023, USD Million
- TABLE 132 Russia Fiber Optics Market by Application, 2024 - 2031, USD Million
- TABLE 133 Spain Fiber Optics Market, 2020 - 2023, USD Million
- TABLE 134 Spain Fiber Optics Market, 2024 - 2031, USD Million
- TABLE 135 Spain Fiber Optics Market by Type, 2020 - 2023, USD Million
- TABLE 136 Spain Fiber Optics Market by Type, 2024 - 2031, USD Million
- TABLE 137 Spain Fiber Optics Market by Application, 2020 - 2023, USD Million
- TABLE 138 Spain Fiber Optics Market by Application, 2024 - 2031, USD Million
- TABLE 139 Italy Fiber Optics Market, 2020 - 2023, USD Million
- TABLE 140 Italy Fiber Optics Market, 2024 - 2031, USD Million
- TABLE 141 Italy Fiber Optics Market by Type, 2020 - 2023, USD Million
- TABLE 142 Italy Fiber Optics Market by Type, 2024 - 2031, USD Million
- TABLE 143 Italy Fiber Optics Market by Application, 2020 - 2023, USD Million
- TABLE 144 Italy Fiber Optics Market by Application, 2024 - 2031, USD Million
- TABLE 145 Rest of Europe Fiber Optics Market, 2020 - 2023, USD Million
- TABLE 146 Rest of Europe Fiber Optics Market, 2024 - 2031, USD Million
- TABLE 147 Rest of Europe Fiber Optics Market by Type, 2020 - 2023, USD Million
- TABLE 148 Rest of Europe Fiber Optics Market by Type, 2024 - 2031, USD Million
- TABLE 149 Rest of Europe Fiber Optics Market by Application, 2020 - 2023, USD Million
- TABLE 150 Rest of Europe Fiber Optics Market by Application, 2024 - 2031, USD Million
- TABLE 151 Asia Pacific Fiber Optics Market, 2020 - 2023, USD Million
- TABLE 152 Asia Pacific Fiber Optics Market, 2024 - 2031, USD Million
- TABLE 153 Asia Pacific Fiber Optics Market by Type, 2020 - 2023, USD Million
- TABLE 154 Asia Pacific Fiber Optics Market by Type, 2024 - 2031, USD Million
- TABLE 155 Asia Pacific Multi-mode Market by Country, 2020 - 2023, USD Million
- TABLE 156 Asia Pacific Multi-mode Market by Country, 2024 - 2031, USD Million
- TABLE 157 Asia Pacific Single mode Market by Country, 2020 - 2023, USD Million
- TABLE 158 Asia Pacific Single mode Market by Country, 2024 - 2031, USD Million
- TABLE 159 Asia Pacific Plastic Optical Fiber (POF) Market by Country, 2020 - 2023, USD Million
- TABLE 160 Asia Pacific Plastic Optical Fiber (POF) Market by Country, 2024 - 2031, USD Million
- TABLE 161 Asia Pacific Fiber Optics Market by Application, 2020 - 2023, USD Million
- TABLE 162 Asia Pacific Fiber Optics Market by Application, 2024 - 2031, USD Million
- TABLE 163 Asia Pacific Telecom Market by Country, 2020 - 2023, USD Million
- TABLE 164 Asia Pacific Telecom Market by Country, 2024 - 2031, USD Million
- TABLE 165 Asia Pacific Oil & Gas Market by Country, 2020 - 2023, USD Million
- TABLE 166 Asia Pacific Oil & Gas Market by Country, 2024 - 2031, USD Million
- TABLE 167 Asia Pacific Military & Aerospace Market by Country, 2020 - 2023, USD Million
- TABLE 168 Asia Pacific Military & Aerospace Market by Country, 2024 - 2031, USD Million
- TABLE 169 Asia Pacific BFSI Market by Country, 2020 - 2023, USD Million
- TABLE 170 Asia Pacific BFSI Market by Country, 2024 - 2031, USD Million
- TABLE 171 Asia Pacific Medical Market by Country, 2020 - 2023, USD Million
- TABLE 172 Asia Pacific Medical Market by Country, 2024 - 2031, USD Million
- TABLE 173 Asia Pacific Railway Market by Country, 2020 - 2023, USD Million
- TABLE 174 Asia Pacific Railway Market by Country, 2024 - 2031, USD Million
- TABLE 175 Asia Pacific Other Application Market by Country, 2020 - 2023, USD Million
- TABLE 176 Asia Pacific Other Application Market by Country, 2024 - 2031, USD Million
- TABLE 177 Asia Pacific Fiber Optics Market by Country, 2020 - 2023, USD Million
- TABLE 178 Asia Pacific Fiber Optics Market by Country, 2024 - 2031, USD Million
- TABLE 179 China Fiber Optics Market, 2020 - 2023, USD Million
- TABLE 180 China Fiber Optics Market, 2024 - 2031, USD Million
- TABLE 181 China Fiber Optics Market by Type, 2020 - 2023, USD Million
- TABLE 182 China Fiber Optics Market by Type, 2024 - 2031, USD Million
- TABLE 183 China Fiber Optics Market by Application, 2020 - 2023, USD Million
- TABLE 184 China Fiber Optics Market by Application, 2024 - 2031, USD Million
- TABLE 185 Japan Fiber Optics Market, 2020 - 2023, USD Million
- TABLE 186 Japan Fiber Optics Market, 2024 - 2031, USD Million
- TABLE 187 Japan Fiber Optics Market by Type, 2020 - 2023, USD Million
- TABLE 188 Japan Fiber Optics Market by Type, 2024 - 2031, USD Million
- TABLE 189 Japan Fiber Optics Market by Application, 2020 - 2023, USD Million
- TABLE 190 Japan Fiber Optics Market by Application, 2024 - 2031, USD Million
- TABLE 191 India Fiber Optics Market, 2020 - 2023, USD Million
- TABLE 192 India Fiber Optics Market, 2024 - 2031, USD Million
- TABLE 193 India Fiber Optics Market by Type, 2020 - 2023, USD Million
- TABLE 194 India Fiber Optics Market by Type, 2024 - 2031, USD Million
- TABLE 195 India Fiber Optics Market by Application, 2020 - 2023, USD Million
- TABLE 196 India Fiber Optics Market by Application, 2024 - 2031, USD Million
- TABLE 197 South Korea Fiber Optics Market, 2020 - 2023, USD Million
- TABLE 198 South Korea Fiber Optics Market, 2024 - 2031, USD Million
- TABLE 199 South Korea Fiber Optics Market by Type, 2020 - 2023, USD Million
- TABLE 200 South Korea Fiber Optics Market by Type, 2024 - 2031, USD Million
- TABLE 201 South Korea Fiber Optics Market by Application, 2020 - 2023, USD Million
- TABLE 202 South Korea Fiber Optics Market by Application, 2024 - 2031, USD Million
- TABLE 203 Australia Fiber Optics Market, 2020 - 2023, USD Million
- TABLE 204 Australia Fiber Optics Market, 2024 - 2031, USD Million
- TABLE 205 Australia Fiber Optics Market by Type, 2020 - 2023, USD Million
- TABLE 206 Australia Fiber Optics Market by Type, 2024 - 2031, USD Million
- TABLE 207 Australia Fiber Optics Market by Application, 2020 - 2023, USD Million
- TABLE 208 Australia Fiber Optics Market by Application, 2024 - 2031, USD Million
- TABLE 209 Malaysia Fiber Optics Market, 2020 - 2023, USD Million
- TABLE 210 Malaysia Fiber Optics Market, 2024 - 2031, USD Million
- TABLE 211 Malaysia Fiber Optics Market by Type, 2020 - 2023, USD Million
- TABLE 212 Malaysia Fiber Optics Market by Type, 2024 - 2031, USD Million
- TABLE 213 Malaysia Fiber Optics Market by Application, 2020 - 2023, USD Million
- TABLE 214 Malaysia Fiber Optics Market by Application, 2024 - 2031, USD Million
- TABLE 215 Rest of Asia Pacific Fiber Optics Market, 2020 - 2023, USD Million
- TABLE 216 Rest of Asia Pacific Fiber Optics Market, 2024 - 2031, USD Million
- TABLE 217 Rest of Asia Pacific Fiber Optics Market by Type, 2020 - 2023, USD Million
- TABLE 218 Rest of Asia Pacific Fiber Optics Market by Type, 2024 - 2031, USD Million
- TABLE 219 Rest of Asia Pacific Fiber Optics Market by Application, 2020 - 2023, USD Million
- TABLE 220 Rest of Asia Pacific Fiber Optics Market by Application, 2024 - 2031, USD Million
- TABLE 221 LAMEA Fiber Optics Market, 2020 - 2023, USD Million
- TABLE 222 LAMEA Fiber Optics Market, 2024 - 2031, USD Million
- TABLE 223 LAMEA Fiber Optics Market by Type, 2020 - 2023, USD Million
- TABLE 224 LAMEA Fiber Optics Market by Type, 2024 - 2031, USD Million
- TABLE 225 LAMEA Multi-mode Market by Country, 2020 - 2023, USD Million
- TABLE 226 LAMEA Multi-mode Market by Country, 2024 - 2031, USD Million
- TABLE 227 LAMEA Single mode Market by Country, 2020 - 2023, USD Million
- TABLE 228 LAMEA Single mode Market by Country, 2024 - 2031, USD Million
- TABLE 229 LAMEA Plastic Optical Fiber (POF) Market by Country, 2020 - 2023, USD Million
- TABLE 230 LAMEA Plastic Optical Fiber (POF) Market by Country, 2024 - 2031, USD Million
- TABLE 231 LAMEA Fiber Optics Market by Application, 2020 - 2023, USD Million
- TABLE 232 LAMEA Fiber Optics Market by Application, 2024 - 2031, USD Million
- TABLE 233 LAMEA Telecom Market by Country, 2020 - 2023, USD Million
- TABLE 234 LAMEA Telecom Market by Country, 2024 - 2031, USD Million
- TABLE 235 LAMEA Oil & Gas Market by Country, 2020 - 2023, USD Million
- TABLE 236 LAMEA Oil & Gas Market by Country, 2024 - 2031, USD Million
- TABLE 237 LAMEA Military & Aerospace Market by Country, 2020 - 2023, USD Million
- TABLE 238 LAMEA Military & Aerospace Market by Country, 2024 - 2031, USD Million
- TABLE 239 LAMEA BFSI Market by Country, 2020 - 2023, USD Million
- TABLE 240 LAMEA BFSI Market by Country, 2024 - 2031, USD Million
- TABLE 241 LAMEA Medical Market by Country, 2020 - 2023, USD Million
- TABLE 242 LAMEA Medical Market by Country, 2024 - 2031, USD Million
- TABLE 243 LAMEA Railway Market by Country, 2020 - 2023, USD Million
- TABLE 244 LAMEA Railway Market by Country, 2024 - 2031, USD Million
- TABLE 245 LAMEA Other Application Market by Country, 2020 - 2023, USD Million
- TABLE 246 LAMEA Other Application Market by Country, 2024 - 2031, USD Million
- TABLE 247 LAMEA Fiber Optics Market by Country, 2020 - 2023, USD Million
- TABLE 248 LAMEA Fiber Optics Market by Country, 2024 - 2031, USD Million
- TABLE 249 Brazil Fiber Optics Market, 2020 - 2023, USD Million
- TABLE 250 Brazil Fiber Optics Market, 2024 - 2031, USD Million
- TABLE 251 Brazil Fiber Optics Market by Type, 2020 - 2023, USD Million
- TABLE 252 Brazil Fiber Optics Market by Type, 2024 - 2031, USD Million
- TABLE 253 Brazil Fiber Optics Market by Application, 2020 - 2023, USD Million
- TABLE 254 Brazil Fiber Optics Market by Application, 2024 - 2031, USD Million
- TABLE 255 Argentina Fiber Optics Market, 2020 - 2023, USD Million
- TABLE 256 Argentina Fiber Optics Market, 2024 - 2031, USD Million
- TABLE 257 Argentina Fiber Optics Market by Type, 2020 - 2023, USD Million
- TABLE 258 Argentina Fiber Optics Market by Type, 2024 - 2031, USD Million
- TABLE 259 Argentina Fiber Optics Market by Application, 2020 - 2023, USD Million
- TABLE 260 Argentina Fiber Optics Market by Application, 2024 - 2031, USD Million
- TABLE 261 UAE Fiber Optics Market, 2020 - 2023, USD Million
- TABLE 262 UAE Fiber Optics Market, 2024 - 2031, USD Million
- TABLE 263 UAE Fiber Optics Market by Type, 2020 - 2023, USD Million
- TABLE 264 UAE Fiber Optics Market by Type, 2024 - 2031, USD Million
- TABLE 265 UAE Fiber Optics Market by Application, 2020 - 2023, USD Million
- TABLE 266 UAE Fiber Optics Market by Application, 2024 - 2031, USD Million
- TABLE 267 Saudi Arabia Fiber Optics Market, 2020 - 2023, USD Million
- TABLE 268 Saudi Arabia Fiber Optics Market, 2024 - 2031, USD Million
- TABLE 269 Saudi Arabia Fiber Optics Market by Type, 2020 - 2023, USD Million
- TABLE 270 Saudi Arabia Fiber Optics Market by Type, 2024 - 2031, USD Million
- TABLE 271 Saudi Arabia Fiber Optics Market by Application, 2020 - 2023, USD Million
- TABLE 272 Saudi Arabia Fiber Optics Market by Application, 2024 - 2031, USD Million
- TABLE 273 South Africa Fiber Optics Market, 2020 - 2023, USD Million
- TABLE 274 South Africa Fiber Optics Market, 2024 - 2031, USD Million
- TABLE 275 South Africa Fiber Optics Market by Type, 2020 - 2023, USD Million
- TABLE 276 South Africa Fiber Optics Market by Type, 2024 - 2031, USD Million
- TABLE 277 South Africa Fiber Optics Market by Application, 2020 - 2023, USD Million
- TABLE 278 South Africa Fiber Optics Market by Application, 2024 - 2031, USD Million
- TABLE 279 Nigeria Fiber Optics Market, 2020 - 2023, USD Million
- TABLE 280 Nigeria Fiber Optics Market, 2024 - 2031, USD Million
- TABLE 281 Nigeria Fiber Optics Market by Type, 2020 - 2023, USD Million
- TABLE 282 Nigeria Fiber Optics Market by Type, 2024 - 2031, USD Million
- TABLE 283 Nigeria Fiber Optics Market by Application, 2020 - 2023, USD Million
- TABLE 284 Nigeria Fiber Optics Market by Application, 2024 - 2031, USD Million
- TABLE 285 Rest of LAMEA Fiber Optics Market, 2020 - 2023, USD Million
- TABLE 286 Rest of LAMEA Fiber Optics Market, 2024 - 2031, USD Million
- TABLE 287 Rest of LAMEA Fiber Optics Market by Type, 2020 - 2023, USD Million
- TABLE 288 Rest of LAMEA Fiber Optics Market by Type, 2024 - 2031, USD Million
- TABLE 289 Rest of LAMEA Fiber Optics Market by Application, 2020 - 2023, USD Million
- TABLE 290 Rest of LAMEA Fiber Optics Market by Application, 2024 - 2031, USD Million
- TABLE 291 Key Information - Corning Incorporated
- TABLE 292 Key Information - Prysmian Group
- TABLE 293 Key Information - Sumitomo Electric Industries, Ltd.
- TABLE 294 Key Information - Nexans S.A.
- TABLE 295 Key Information - Fujikura Ltd.
- TABLE 296 Key Information - Leoni AG
- TABLE 297 Key Information - HENGTONG GROUP CO., LTD.
- TABLE 298 Key information -TE Connectivity Ltd.
- TABLE 299 Key Information - PCT International, Inc.
- TABLE 300 Key Information - Coherent Corp.
LIST OF FIGURES
- FIG 1 Methodology for the research
- FIG 2 Global Fiber Optics Market, 2020 - 2031, USD Million
- FIG 3 Key Factors Impacting Fiber Optics Market
- FIG 4 Porter's Five Forces Analysis - Fiber Optics Market
- FIG 5 Global Fiber Optics Market share by Type, 2023
- FIG 6 Global Fiber Optics Market share by Type, 2031
- FIG 7 Global Fiber Optics Market by Type, 2020 - 2031, USD Million
- FIG 8 Global Fiber Optics Market share by Application, 2023
- FIG 9 Global Fiber Optics Market share by Application, 2031
- FIG 10 Global Fiber Optics Market by Application, 2020 - 2031, USD Million
- FIG 11 Global Fiber Optics Market share by Region, 2023
- FIG 12 Global Fiber Optics Market share by Region, 2031
- FIG 13 Global Fiber Optics Market by Region, 2020 - 2031, USD Million
- FIG 14 North America Fiber Optics Market, 2020 - 2031, USD Million
- FIG 15 North America Fiber Optics Market share by Type, 2023
- FIG 16 North America Fiber Optics Market share by Type, 2031
- FIG 17 North America Fiber Optics Market by Type, 2020 - 2031, USD Million
- FIG 18 North America Fiber Optics Market share by Application, 2023
- FIG 19 North America Fiber Optics Market share by Application, 2031
- FIG 20 North America Fiber Optics Market by Application, 2020 - 2031, USD Million
- FIG 21 North America Fiber Optics Market share by Country, 2023
- FIG 22 North America Fiber Optics Market share by Country, 2031
- FIG 23 North America Fiber Optics Market by Country, 2020 - 2031, USD Million
- FIG 24 Europe Fiber Optics Market, 2020 - 2031, USD Million
- FIG 25 Europe Fiber Optics Market share by Type, 2023
- FIG 26 Europe Fiber Optics Market share by Type, 2031
- FIG 27 Europe Fiber Optics Market by Type, 2020 - 2031, USD Million
- FIG 28 Europe Fiber Optics Market share by Application, 2023
- FIG 29 Europe Fiber Optics Market share by Application, 2031
- FIG 30 Europe Fiber Optics Market by Application, 2020 - 2031, USD Million
- FIG 31 Europe Fiber Optics Market share by Country, 2023
- FIG 32 Europe Fiber Optics Market share by Country, 2031
- FIG 33 Europe Fiber Optics Market by Country, 2020 - 2031, USD Million
- FIG 34 Asia Pacific Fiber Optics Market, 2020 - 2031, USD Million
- FIG 35 Asia Pacific Fiber Optics Market share by Type, 2023
- FIG 36 Asia Pacific Fiber Optics MarketBshare by Type, 2031
- FIG 37 Asia Pacific Fiber Optics Market by Type, 2020 - 2031, USD Million
- FIG 38 Asia Pacific Fiber Optics Market share by Application, 2023
- FIG 39 Asia Pacific Fiber Optics Market share by Application, 2031
- FIG 40 Asia Pacific Fiber Optics Market by Application, 2020 - 2031, USD Million
- FIG 41 Asia Pacific Fiber Optics Market share by Country, 2023
- FIG 42 Asia Pacific Fiber Optics Market share by Country, 2031
- FIG 43 Asia Pacific Fiber Optics Market by Country, 2020 - 2031, USD Million
- FIG 44 LAMEA Fiber Optics Market, 2020 - 2031, USD Million
- FIG 45 LAMEA Fiber Optics Market share by Type, 2023
- FIG 46 LAMEA Fiber Optics Market share by Type, 2031
- FIG 47 LAMEA Fiber Optics Market by Type, 2020 - 2031, USD Million
- FIG 48 LAMEA Fiber Optics Market share by Application, 2023
- FIG 49 LAMEA Fiber Optics Market share by Application, 2031
- FIG 50 LAMEA Fiber Optics Market by Application, 2020 - 2031, USD Million
- FIG 51 LAMEA Fiber Optics Market share by Country, 2023
- FIG 52 LAMEA Fiber Optics Market share by Country, 2031
- FIG 53 LAMEA Fiber Optics Market by Country, 2020 - 2031, USD Million
- FIG 54 SWOT Analysis: Corning Incorporated
- FIG 55 SWOT Analysis: Prysmian Group
- FIG 56 SWOT Analysis: Sumitomo Electric Industries, Ltd
- FIG 57 SWOT Analysis: Nexans S.A.
- FIG 58 SWOT Analysis: Fujikura Ltd.
- FIG 59 SWOT Analysis: Leoni AG
- FIG 60 SWOT Analysis: HENGTONG GROUP CO., LTD.
- FIG 61 SWOT Analysis: TE Connectivity Ltd.
- FIG 62 SWOT Analysis: PCT International, Inc.
- FIG 63 SWOT Analysis: Coherent Corp.
The Global Fiber Optics Market size is expected to reach $15.43 billion by 2031, rising at a market growth of 7.4% CAGR during the forecast period.
The increasing demand for high-speed internet, the expansion of 5G networks, and the rising adoption of fiber-to-the-home (FTTH) solutions significantly contributed to this dominance. Hence, the telecom segment garnered 41% revenue share in the market in 2023. Telecom operators globally have been investing heavily in fiber optic infrastructure to meet the growing data consumption needs and enhance network reliability. The shift towards cloud computing, video streaming, and IoT applications has further fuelled the demand for fiber optics in the telecom industry.
Governments and regulatory bodies worldwide are encouraging broadband expansion to enhance digital inclusion. Many countries are investing in fiber deployment projects to provide high-speed internet access in rural and underserved areas. These initiatives not only support economic development but also position fiber optics as a crucial driver in the global broadband expansion strategy. Additionally, content delivery networks (CDNs) that power video streaming, online gaming, and digital content distribution rely on fiber optics for seamless content delivery. Companies like Netflix, YouTube, and Amazon Web Services (AWS) require high-speed fiber-optic connectivity to ensure uninterrupted service for millions of users worldwide. In conclusion, as the demand for cloud storage, digital content, and AI-driven applications continues to rise, the market will experience sustained growth.
However, one of the biggest challenges in fiber optic deployment is the high initial investment required for infrastructure development. The costs associated with fiber optic cables, specialized equipment, trenching, and installation are significantly higher than traditional copper or wireless networks. This makes it difficult for smaller telecom operators, internet service providers (ISPs), and rural communities to adopt fiber optics on a scale.
Application Outlook
Based on application, the market is characterized into telecom, oil & gas, military & aerospace, BFSI, medical, railway, and others. The oil & gas segment procured 14% revenue share in the market in 2023. Fiber optic technology is widely used in this industry for real-time monitoring of pipelines, offshore platforms, and downhole applications. The ability of fiber optics to provide accurate data transmission over long distances without signal loss makes it ideal for oil & gas exploration and production activities. Additionally, the increasing focus on safety and efficiency in harsh environments has driven the adoption of fiber optic sensing solutions for leak detection, seismic monitoring, and temperature sensing.
Type Outlook
On the basis of type, the market is classified into single mode, multi-mode, and plastic optical fiber (POF). The single mode segment recorded 39% revenue share in the market in 2023. Single mode fiber is widely used in long-distance communication networks, including telecommunications, submarine cables, and metropolitan area networks (MANs). Its ability to transmit data over longer distances with minimal signal loss makes it a crucial component of modern communication infrastructure. The rising expansion of 5G networks, increasing demand for high-speed internet, and growing investments in smart city projects have contributed to the steady growth of the single mode fiber optics segment.
Regional Outlook
Region-wise, the market is analyzed across North America, Europe, Asia Pacific, and LAMEA. The North America segment recorded 30% revenue share in the market in 2023. This growth was driven by the increasing demand for high-speed internet, the expansion of 5G infrastructure, and significant investments in fiber optic networks by telecom operators. The rising adoption of fiber optics in industries such as healthcare, BFSI, and aerospace also contributed to the market's dominance in the region. Furthermore, government initiatives to improve broadband connectivity and the increasing deployment of fiber-to-the-home (FTTH) services have further fuelled the expansion of the fiber optics market in North America.
List of Key Companies Profiled
- Corning Incorporated
- Prysmian Group
- Sumitomo Electric Industries, Ltd.
- Nexans S.A.
- Fujikura Ltd.
- Leoni AG
- Hengtong Group Co., Ltd.
- TE Connectivity Ltd.
- PCT International, Inc.
- Coherent Corp.
Global Fiber Optics Market Report Segmentation
By Type
- Multi-mode
- Single mode
- Plastic Optical Fiber (POF)
By Application
- Telecom
- Oil & Gas
- Military & Aerospace
- BFSI
- Medical
- Railway
- Other Application
By Geography
- North America
- US
- Canada
- Mexico
- Rest of North America
- Europe
- Germany
- UK
- France
- Russia
- Spain
- Italy
- Rest of Europe
- Asia Pacific
- China
- Japan
- India
- South Korea
- Australia
- Malaysia
- Rest of Asia Pacific
- LAMEA
- Brazil
- Argentina
- UAE
- Saudi Arabia
- South Africa
- Nigeria
- Rest of LAMEA
Table of Contents
Chapter 1. Market Scope & Methodology
- 1.1 Market Definition
- 1.2 Objectives
- 1.3 Market Scope
- 1.4 Segmentation
- 1.4.1 Global Fiber Optics Market, by Type
- 1.4.2 Global Fiber Optics Market, by Application
- 1.4.3 Global Fiber Optics Market, by Geography
- 1.5 Methodology for the research
Chapter 2. Market at a Glance
- 2.1 Key Highlights
Chapter 3. Market Overview
- 3.1 Introduction
- 3.1.1 Overview
- 3.1.1.1 Market Composition and Scenario
- 3.1.1 Overview
- 3.2 Key Factors Impacting the Market
- 3.2.1 Market Drivers
- 3.2.2 Market Restraints
- 3.2.3 Market Opportunities
- 3.2.4 Market Challenges
- 3.3 Porter Five Forces Analysis
Chapter 4. Global Fiber Optics Market by Type
- 4.1 Global Multi-mode Market by Region
- 4.2 Global Single mode Market by Region
- 4.3 Global Plastic Optical Fiber (POF) Market by Region
Chapter 5. Global Fiber Optics Market by Application
- 5.1 Global Telecom Market by Region
- 5.2 Global Oil & Gas Market by Region
- 5.3 Global Military & Aerospace Market by Region
- 5.4 Global BFSI Market by Region
- 5.5 Global Medical Market by Region
- 5.6 Global Railway Market by Region
- 5.7 Global Other Application Market by Region
Chapter 6. Global Fiber Optics Market by Region
- 6.1 North America Fiber Optics Market
- 6.1.1 North America Fiber Optics Market by Type
- 6.1.1.1 North America Multi-mode Market by Country
- 6.1.1.2 North America Single mode Market by Country
- 6.1.1.3 North America Plastic Optical Fiber (POF) Market by Country
- 6.1.2 North America Fiber Optics Market by Application
- 6.1.2.1 North America Telecom Market by Country
- 6.1.2.2 North America Oil & Gas Market by Country
- 6.1.2.3 North America Military & Aerospace Market by Country
- 6.1.2.4 North America BFSI Market by Country
- 6.1.2.5 North America Medical Market by Country
- 6.1.2.6 North America Railway Market by Country
- 6.1.2.7 North America Other Application Market by Country
- 6.1.3 North America Fiber Optics Market by Country
- 6.1.3.1 US Fiber Optics Market
- 6.1.3.1.1 US Fiber Optics Market by Type
- 6.1.3.1.2 US Fiber Optics Market by Application
- 6.1.3.2 Canada Fiber Optics Market
- 6.1.3.2.1 Canada Fiber Optics Market by Type
- 6.1.3.2.2 Canada Fiber Optics Market by Application
- 6.1.3.3 Mexico Fiber Optics Market
- 6.1.3.3.1 Mexico Fiber Optics Market by Type
- 6.1.3.3.2 Mexico Fiber Optics Market by Application
- 6.1.3.4 Rest of North America Fiber Optics Market
- 6.1.3.4.1 Rest of North America Fiber Optics Market by Type
- 6.1.3.4.2 Rest of North America Fiber Optics Market by Application
- 6.1.3.1 US Fiber Optics Market
- 6.1.1 North America Fiber Optics Market by Type
- 6.2 Europe Fiber Optics Market
- 6.2.1 Europe Fiber Optics Market by Type
- 6.2.1.1 Europe Multi-mode Market by Country
- 6.2.1.2 Europe Single mode Market by Country
- 6.2.1.3 Europe Plastic Optical Fiber (POF) Market by Country
- 6.2.2 Europe Fiber Optics Market by Application
- 6.2.2.1 Europe Telecom Market by Country
- 6.2.2.2 Europe Oil & Gas Market by Country
- 6.2.2.3 Europe Military & Aerospace Market by Country
- 6.2.2.4 Europe BFSI Market by Country
- 6.2.2.5 Europe Medical Market by Country
- 6.2.2.6 Europe Railway Market by Country
- 6.2.2.7 Europe Other Application Market by Country
- 6.2.3 Europe Fiber Optics Market by Country
- 6.2.3.1 Germany Fiber Optics Market
- 6.2.3.1.1 Germany Fiber Optics Market by Type
- 6.2.3.1.2 Germany Fiber Optics Market by Application
- 6.2.3.2 UK Fiber Optics Market
- 6.2.3.2.1 UK Fiber Optics Market by Type
- 6.2.3.2.2 UK Fiber Optics Market by Application
- 6.2.3.3 France Fiber Optics Market
- 6.2.3.3.1 France Fiber Optics Market by Type
- 6.2.3.3.2 France Fiber Optics Market by Application
- 6.2.3.4 Russia Fiber Optics Market
- 6.2.3.4.1 Russia Fiber Optics Market by Type
- 6.2.3.4.2 Russia Fiber Optics Market by Application
- 6.2.3.5 Spain Fiber Optics Market
- 6.2.3.5.1 Spain Fiber Optics Market by Type
- 6.2.3.5.2 Spain Fiber Optics Market by Application
- 6.2.3.6 Italy Fiber Optics Market
- 6.2.3.6.1 Italy Fiber Optics Market by Type
- 6.2.3.6.2 Italy Fiber Optics Market by Application
- 6.2.3.7 Rest of Europe Fiber Optics Market
- 6.2.3.7.1 Rest of Europe Fiber Optics Market by Type
- 6.2.3.7.2 Rest of Europe Fiber Optics Market by Application
- 6.2.3.1 Germany Fiber Optics Market
- 6.2.1 Europe Fiber Optics Market by Type
- 6.3 Asia Pacific Fiber Optics Market
- 6.3.1 Asia Pacific Fiber Optics Market by Type
- 6.3.1.1 Asia Pacific Multi-mode Market by Country
- 6.3.1.2 Asia Pacific Single mode Market by Country
- 6.3.1.3 Asia Pacific Plastic Optical Fiber (POF) Market by Country
- 6.3.2 Asia Pacific Fiber Optics Market by Application
- 6.3.2.1 Asia Pacific Telecom Market by Country
- 6.3.2.2 Asia Pacific Oil & Gas Market by Country
- 6.3.2.3 Asia Pacific Military & Aerospace Market by Country
- 6.3.2.4 Asia Pacific BFSI Market by Country
- 6.3.2.5 Asia Pacific Medical Market by Country
- 6.3.2.6 Asia Pacific Railway Market by Country
- 6.3.2.7 Asia Pacific Other Application Market by Country
- 6.3.3 Asia Pacific Fiber Optics Market by Country
- 6.3.3.1 China Fiber Optics Market
- 6.3.3.1.1 China Fiber Optics Market by Type
- 6.3.3.1.2 China Fiber Optics Market by Application
- 6.3.3.2 Japan Fiber Optics Market
- 6.3.3.2.1 Japan Fiber Optics Market by Type
- 6.3.3.2.2 Japan Fiber Optics Market by Application
- 6.3.3.3 India Fiber Optics Market
- 6.3.3.3.1 India Fiber Optics Market by Type
- 6.3.3.3.2 India Fiber Optics Market by Application
- 6.3.3.4 South Korea Fiber Optics Market
- 6.3.3.4.1 South Korea Fiber Optics Market by Type
- 6.3.3.4.2 South Korea Fiber Optics Market by Application
- 6.3.3.5 Australia Fiber Optics Market
- 6.3.3.5.1 Australia Fiber Optics Market by Type
- 6.3.3.5.2 Australia Fiber Optics Market by Application
- 6.3.3.6 Malaysia Fiber Optics Market
- 6.3.3.6.1 Malaysia Fiber Optics Market by Type
- 6.3.3.6.2 Malaysia Fiber Optics Market by Application
- 6.3.3.7 Rest of Asia Pacific Fiber Optics Market
- 6.3.3.7.1 Rest of Asia Pacific Fiber Optics Market by Type
- 6.3.3.7.2 Rest of Asia Pacific Fiber Optics Market by Application
- 6.3.3.1 China Fiber Optics Market
- 6.3.1 Asia Pacific Fiber Optics Market by Type
- 6.4 LAMEA Fiber Optics Market
- 6.4.1 LAMEA Fiber Optics Market by Type
- 6.4.1.1 LAMEA Multi-mode Market by Country
- 6.4.1.2 LAMEA Single mode Market by Country
- 6.4.1.3 LAMEA Plastic Optical Fiber (POF) Market by Country
- 6.4.2 LAMEA Fiber Optics Market by Application
- 6.4.2.1 LAMEA Telecom Market by Country
- 6.4.2.2 LAMEA Oil & Gas Market by Country
- 6.4.2.3 LAMEA Military & Aerospace Market by Country
- 6.4.2.4 LAMEA BFSI Market by Country
- 6.4.2.5 LAMEA Medical Market by Country
- 6.4.2.6 LAMEA Railway Market by Country
- 6.4.2.7 LAMEA Other Application Market by Country
- 6.4.3 LAMEA Fiber Optics Market by Country
- 6.4.3.1 Brazil Fiber Optics Market
- 6.4.3.1.1 Brazil Fiber Optics Market by Type
- 6.4.3.1.2 Brazil Fiber Optics Market by Application
- 6.4.3.2 Argentina Fiber Optics Market
- 6.4.3.2.1 Argentina Fiber Optics Market by Type
- 6.4.3.2.2 Argentina Fiber Optics Market by Application
- 6.4.3.3 UAE Fiber Optics Market
- 6.4.3.3.1 UAE Fiber Optics Market by Type
- 6.4.3.3.2 UAE Fiber Optics Market by Application
- 6.4.3.4 Saudi Arabia Fiber Optics Market
- 6.4.3.4.1 Saudi Arabia Fiber Optics Market by Type
- 6.4.3.4.2 Saudi Arabia Fiber Optics Market by Application
- 6.4.3.5 South Africa Fiber Optics Market
- 6.4.3.5.1 South Africa Fiber Optics Market by Type
- 6.4.3.5.2 South Africa Fiber Optics Market by Application
- 6.4.3.6 Nigeria Fiber Optics Market
- 6.4.3.6.1 Nigeria Fiber Optics Market by Type
- 6.4.3.6.2 Nigeria Fiber Optics Market by Application
- 6.4.3.7 Rest of LAMEA Fiber Optics Market
- 6.4.3.7.1 Rest of LAMEA Fiber Optics Market by Type
- 6.4.3.7.2 Rest of LAMEA Fiber Optics Market by Application
- 6.4.3.1 Brazil Fiber Optics Market
- 6.4.1 LAMEA Fiber Optics Market by Type
Chapter 7. Company Profiles
- 7.1 Corning Incorporated
- 7.1.1 Company Overview
- 7.1.2 Financial Analysis
- 7.1.3 Segmental and Regional Analysis
- 7.1.4 Research & Development Expenses
- 7.1.5 SWOT Analysis
- 7.2 Prysmian Group
- 7.2.1 Company Overview
- 7.2.2 Financial Analysis
- 7.2.3 Segmental and Regional Analysis
- 7.2.4 Research & Development Expenses
- 7.2.5 SWOT Analysis
- 7.3 Sumitomo Electric Industries, Ltd.
- 7.3.1 Company Overview
- 7.3.2 Financial Analysis
- 7.3.3 Segmental and Regional Analysis
- 7.3.4 Research & Development Expenses
- 7.3.5 SWOT Analysis
- 7.4 Nexans S.A.
- 7.4.1 Company Overview
- 7.4.2 Financial Analysis
- 7.4.3 Segmental and Regional Analysis
- 7.4.4 Research & Development Expense
- 7.4.5 SWOT Analysis
- 7.5 Fujikura Ltd.
- 7.5.1 Company Overview
- 7.5.2 Financial Analysis
- 7.5.3 Segmental and Regional Analysis
- 7.5.4 Research & Development Expenses
- 7.5.5 SWOT Analysis
- 7.6 Leoni AG
- 7.6.1 Company Overview
- 7.6.2 SWOT Analysis
- 7.7 Hengtong Group Co., Ltd.
- 7.7.1 Company Overview
- 7.7.2 SWOT Analysis
- 7.8 TE Connectivity Ltd.
- 7.8.1 Company Overview
- 7.8.2 Financial Analysis
- 7.8.3 Segmental and Regional Analysis
- 7.8.4 Research & Development Expense
- 7.8.5 SWOT Analysis
- 7.9 PCT International, Inc.
- 7.9.1 Company Overview
- 7.9.2 SWOT Analysis
- 7.10. Coherent Corp.
- 7.10.1 Company Overview
- 7.10.2 Financial Analysis
- 7.10.3 Segmental and Regional Analysis
- 7.10.4 Research & Development Expenses
- 7.10.5 Recent strategies and developments:
- 7.10.5.1 Product Launches and Product Expansions:
- 7.10.6 SWOT Analysis
