|
|
市場調査レポート
商品コード
1682870
世界生成的敵対ネットワーク市場規模、シェア、動向分析レポート、技術別、アプリケーション別、展開別、タイプ別、業界別、地域別展望と予測、2024年~2031年Global Generative Adversarial Networks Market Size, Share & Trends Analysis Report By Technology, By Application, By Deployment, By Type, By Industry Vertical, By Regional Outlook and Forecast, 2024 - 2031 |
||||||

|
|||||||
|
|||||||


| 世界生成的敵対ネットワーク市場規模、シェア、動向分析レポート、技術別、アプリケーション別、展開別、タイプ別、業界別、地域別展望と予測、2024年~2031年 |
|
出版日: 2025年03月07日
発行: KBV Research
ページ情報: 英文 376 Pages
納期: 即納可能
|

全表示
- 概要
- 図表
- 目次
世界の生成的敵対ネットワーク市場規模は、予測期間中に36.8%のCAGRで市場成長し、2031年までに478億4,000万米ドルに達すると予想されています。
KBV Cardinal matrixで提示された分析に基づくと、Google、Inc.、Microsoft Corporation、Amazon Web Services、Inc.が生成的敵対ネットワーク市場の先駆者です。2024年5月、Google LLCは、コンテンツを変更せずにテキストをAI生成としてタグ付けする新しい手法を発表しました。この機能は、以前はAI生成画像と音声を検出するように設計されたGoogle DeepMindのSynthIDツールに追加されました。NVIDIA Corporation、IBM Corporation、OpenAI、LLCなどの企業は、生成的敵対ネットワーク市場の主要なイノベーターの一部です。
市場成長要因
GANはゲームやVRを超えて、拡張現実(AR)や複合現実(MR)にも広がり、教育、不動産、ヘルスケアの分野での体験を向上させます。たとえばARゲームでは、GANは仮想要素を現実世界とシームレスに融合するリアルなオーバーレイを生成できるため、ユーザーエンゲージメントが向上します。適応型アバター、パーソナライズされたゲームアセット、リアルな環境を作成できるGANの機能は、インタラクティブエンターテイメントの限界を押し広げています。したがって、GAN技術が進化し続けると、ゲームやVRにさらなる革命をもたらし、世界中のユーザーにさらに豊かで没入感のある体験を提供することになります。
GANは、ユーザーのインタラクションに基づいて広告クリエイティブがリアルタイムで調整される動的な広告パーソナライゼーションを強化します。たとえば、 eコマースプラットフォームはGANを使用して、各ユーザーの閲覧履歴や好みに応じて、各ユーザーに表示される製品の推奨事項、バナー、またはプロモーション画像を動的に変更することができます。このレベルのパーソナライゼーションにより、ユーザーエンゲージメントが大幅に向上し、コンバージョンの可能性が高まります。これにより、ユーザーエクスペリエンスが向上し、ブランドとのより強い感情的なつながりが育まれます。したがって、技術の進歩に伴い、パーソナライズされたマーケティングにおけるGANの役割はさらに拡大すると予想されます。
市場抑制要因
この問題の潜在的な解決策として、スケーラブルな計算リソースを提供するクラウドベースのソリューションが登場し、企業は多額の先行投資をすることなく強力なハードウェアにアクセスできるようになりました。ただし、これらのサービスは、特に長期にわたるトレーニングセッションや大規模な実験を必要とするプロジェクトではコストが高くなる可能性があります。その結果、高い計算コストは市場にとって依然として重大な課題となっています。
技術展望
技術に基づいて、市場は条件付きGAN、従来型GAN、およびサイクルGANに分類されます。条件付きGANセグメントは、2023年に市場で42%の収益シェアを獲得しました。条件付きGANセグメントの成長は、特定の入力条件またはラベルに基づいて制御されたターゲット出力を生成する機能によって主に推進されています。この柔軟性により、条件付きGANは、ヘルスケア、小売、エンターテインメントなど、正確なデータ生成を必要とする業界全体で非常に価値の高いものになっています。ヘルスケアでは、cGANは特定の病状の合成医療画像を作成し、診断と調査を支援します。ファッションとeコマースの分野では、パーソナライズされた製品の推奨と仮想試着を可能にし、顧客エンゲージメントを強化します。
アプリケーション展望
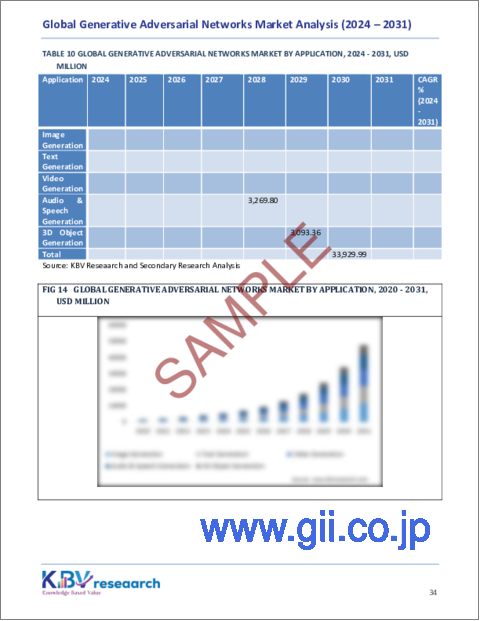
アプリケーションに基づいて、市場は画像生成、テキスト生成、ビデオ生成、オーディオおよび音声生成、および3Dオブジェクト生成に分かれています。ビデオ生成セグメントは、2023年に市場で21%の収益シェアを記録しました。ビデオ生成セグメントは、ゲーム、映画制作、仮想現実(VR)、拡張現実(AR)アプリケーションでの合成ビデオコンテンツの需要の高まりにより、堅調な成長を遂げています。GANは、リアルなビデオシーケンス、特殊効果、ディープフェイクコンテンツの作成を可能にし、映画制作者、ゲーム開発者、コンテンツクリエイターに革新的なツールを提供します。ゲームやエンターテイメントでの没入型体験の人気の高まりと、ビデオ編集および拡張ツールの進歩が相まって、ビデオ生成におけるGANの採用を促進しています。
展開展望
展開によって、市場はクラウドとオンプレミスに分かれています。クラウドセグメントは、2023年に市場で58%の収益シェアを獲得しました。クラウドプラットフォームにより、企業はインフラストラクチャへの多額の先行投資なしに、高性能コンピューティングリソースにアクセスできます。これは、かなりの計算能力とストレージを必要とする複雑なGANモデルのトレーニングに特に役立ちます。さらに、クラウドベースのGANソリューションは、簡単に統合でき、リモートアクセスが可能で、地理的に分散したチーム間でコラボレーションできるという利点があり、メディア、エンターテイメント、ヘルスケア、小売などの業界に最適です。AWS、Google Cloud、Microsoft Azureなどのクラウドサービスプロバイダーの人気が高まっており、専門的な機械学習やAIサービスを提供しています。これにより、クラウドベースのGAN展開の需要がさらに高まっています。
タイプ展望
タイプに基づいて、市場は画像ベースのGAN、ビデオベースのGAN、テキストベースのGAN、およびオーディオベースのGANに分類されます。ビデオベースのGANセグメントは、2023年に市場で27%の収益シェアを記録しました。これらのGANは、映画制作、ゲーム、仮想現実(VR)、拡張現実(AR)アプリケーションで使用され、リアルなビデオシーケンス、特殊効果、没入型環境を作成します。ビデオベースのGANは、ディープフェイクの作成、編集、およびコンテンツの強化に不可欠です。VR/ARエクスペリエンスの人気の高まりと、動的なソーシャルメディアおよび広告コンテンツの需要が、このセグメントの成長に大きく貢献しています。
業界垂直展望
業界別では、市場はメディア&エンターテインメント、ヘルスケア、小売&eコマース、金融&銀行、自動車、その他に分類されています。メディア&エンターテインメントセグメントは、2023年に市場で21%の収益シェアを記録しました。メディアとエンターテインメントセクターは、デジタルメディア、ゲーム、映画における視覚的に魅力的で高品質のコンテンツに対する需要の高まりによって主に推進されています。GANは、超現実的な視覚効果、アニメーション、キャラクターの作成を可能にし、制作コストとタイムラインを削減しながら創造性を高めます。ディープフェイクテクノロジー、バーチャルインフルエンサー、拡張現実(AR)コンテンツの台頭により、このセクターでのGANの採用がさらに加速しています。
地域展望
地域別に見ると、市場は北米、欧州、アジア太平洋、ラテンアメリカ・中東・アフリカにわたって分析されています。北米セグメントは、2023年に市場で39%の収益シェアを獲得しました。この地域の洗練された技術インフラ、強力な研究開発投資、人工知能を専門とする大手ハイテク企業と新興企業の存在は、北米での市場成長を牽引する主な要因です。メディア&エンターテインメント、ヘルスケア、金融などの業界でGANが広く採用されていることが、市場の拡大を後押ししています。北米の活気あるエンターテインメント部門は、コンテンツ作成、視覚効果、ゲームにGANを活用しており、ヘルスケア業界では医療用画像診断にこの技術を使用しています。
目次
第1章 市場範囲と調査手法
- 市場の定義
- 目的
- 市場範囲
- セグメンテーション
- 調査手法
第2章 市場要覧
- 主なハイライト
第3章 市場概要
- イントロダクション
- 概要
- 市場構成とシナリオ
- 概要
- 市場に影響を与える主な要因
- 市場促進要因
- 市場抑制要因
- 市場機会
- 市場の課題
第4章 競合分析 - 世界
- KBV Cardinal Matrix
- 最近の業界全体の戦略的展開
- パートナーシップ、コラボレーション、および契約
- 製品の発売と製品の拡大
- 市場シェア分析、2023年
- 主要成功戦略
- 主な戦略
- 主要な戦略的動き
- ポーターのファイブフォース分析
第5章 世界の生成的敵対ネットワーク市場:技術別
- 世界の条件付きGAN市場:地域別
- 世界の従来型なGAN市場:地域別
- 世界のサイクルGAN市場:地域別
第6章 世界の生成的敵対ネットワーク市場:アプリケーション別
- 世界の画像生成市場:地域別
- 世界のテキスト生成市場:地域別
- 世界のビデオ生成市場:地域別
- 世界のオーディオおよび音声生成市場:地域別
- 世界の3Dオブジェクト生成市場:地域別
第7章 世界の生成的敵対ネットワーク市場:展開別
- 世界のクラウド市場:地域別
- 世界のオンプレミス市場:地域別
第8章 世界の生成的敵対ネットワーク市場:タイプ別
- 世界の画像ベースGAN市場:地域別
- 世界のビデオベースのGAN市場:地域別
- 世界のテキストベースGAN市場:地域別
- 世界のオーディオベースGAN市場:地域別
第9章 世界の生成的敵対ネットワーク市場:業界別
- 世界のメディア・エンターテインメント市場:地域別
- 世界のヘルスケア市場:地域別
- 世界の小売・eコマース市場:地域別
- 世界の金融・銀行市場:地域別
- 世界の自動車市場:地域別
- 世界のその他産業垂直市場:地域別
第10章 世界の生成的敵対ネットワーク市場:地域別
- 北米
- 北米の生成的敵対ネットワーク市場:国別
- 米国
- カナダ
- メキシコ
- その他北米地域
- 北米の生成的敵対ネットワーク市場:国別
- 欧州
- 欧州の生成的敵対ネットワーク市場:国別
- ドイツ
- 英国
- フランス
- ロシア
- スペイン
- イタリア
- その他欧州地域
- 欧州の生成的敵対ネットワーク市場:国別
- アジア太平洋地域
- アジア太平洋の生成的敵対ネットワーク市場:国別
- 中国
- 日本
- インド
- 韓国
- シンガポール
- マレーシア
- その他アジア太平洋地域
- アジア太平洋の生成的敵対ネットワーク市場:国別
- ラテンアメリカ・中東・アフリカ
- ラテンアメリカ・中東・アフリカの生成的敵対ネットワーク市場:国別
- ブラジル
- アルゼンチン
- アラブ首長国連邦
- サウジアラビア
- 南アフリカ
- ナイジェリア
- その他ラテンアメリカ・中東・アフリカ地域
- ラテンアメリカ・中東・アフリカの生成的敵対ネットワーク市場:国別
第11章 企業プロファイル
- Amazon Web Services, Inc(Amazon.com, Inc.)
- Google LLC(Alphabet Inc)
- IBM Corporation
- Markovate Inc
- Meta Platforms, Inc
- Microsoft Corporation
- NVIDIA Corporation
- OpenAI, LL.C
- Stability AI Ltd
- Synthesia Limited
第12章 生成的敵対ネットワーク市場の成功必須条件
LIST OF TABLES
- TABLE 1 Global Generative Adversarial Networks Market, 2020 - 2023, USD Million
- TABLE 2 Global Generative Adversarial Networks Market, 2024 - 2031, USD Million
- TABLE 3 Partnerships, Collaborations and Agreements- Generative Adversarial Networks Market
- TABLE 4 Product Launches And Product Expansions- Generative Adversarial Networks Market
- TABLE 5 Global Generative Adversarial Networks Market by Technology, 2020 - 2023, USD Million
- TABLE 6 Global Generative Adversarial Networks Market by Technology, 2024 - 2031, USD Million
- TABLE 7 Global Conditional GANs Market by Region, 2020 - 2023, USD Million
- TABLE 8 Global Conditional GANs Market by Region, 2024 - 2031, USD Million
- TABLE 9 Global Traditional GANs Market by Region, 2020 - 2023, USD Million
- TABLE 10 Global Traditional GANs Market by Region, 2024 - 2031, USD Million
- TABLE 11 Global Cycle GANs Market by Region, 2020 - 2023, USD Million
- TABLE 12 Global Cycle GANs Market by Region, 2024 - 2031, USD Million
- TABLE 13 Global Generative Adversarial Networks Market by Application, 2020 - 2023, USD Million
- TABLE 14 Global Generative Adversarial Networks Market by Application, 2024 - 2031, USD Million
- TABLE 15 Global Image Generation Market by Region, 2020 - 2023, USD Million
- TABLE 16 Global Image Generation Market by Region, 2024 - 2031, USD Million
- TABLE 17 Global Text Generation Market by Region, 2020 - 2023, USD Million
- TABLE 18 Global Text Generation Market by Region, 2024 - 2031, USD Million
- TABLE 19 Global Video Generation Market by Region, 2020 - 2023, USD Million
- TABLE 20 Global Video Generation Market by Region, 2024 - 2031, USD Million
- TABLE 21 Global Audio & Speech Generation Market by Region, 2020 - 2023, USD Million
- TABLE 22 Global Audio & Speech Generation Market by Region, 2024 - 2031, USD Million
- TABLE 23 Global 3D Object Generation Market by Region, 2020 - 2023, USD Million
- TABLE 24 Global 3D Object Generation Market by Region, 2024 - 2031, USD Million
- TABLE 25 Global Generative Adversarial Networks Market by Deployment, 2020 - 2023, USD Million
- TABLE 26 Global Generative Adversarial Networks Market by Deployment, 2024 - 2031, USD Million
- TABLE 27 Global Cloud Market by Region, 2020 - 2023, USD Million
- TABLE 28 Global Cloud Market by Region, 2024 - 2031, USD Million
- TABLE 29 Global On-Premises Market by Region, 2020 - 2023, USD Million
- TABLE 30 Global On-Premises Market by Region, 2024 - 2031, USD Million
- TABLE 31 Global Generative Adversarial Networks Market by Type, 2020 - 2023, USD Million
- TABLE 32 Global Generative Adversarial Networks Market by Type, 2024 - 2031, USD Million
- TABLE 33 Global Image-Based GANs Market by Region, 2020 - 2023, USD Million
- TABLE 34 Global Image-Based GANs Market by Region, 2024 - 2031, USD Million
- TABLE 35 Global Video-Based GANs Market by Region, 2020 - 2023, USD Million
- TABLE 36 Global Video-Based GANs Market by Region, 2024 - 2031, USD Million
- TABLE 37 Global Text-Based GANs Market by Region, 2020 - 2023, USD Million
- TABLE 38 Global Text-Based GANs Market by Region, 2024 - 2031, USD Million
- TABLE 39 Global Audio-Based GANs Market by Region, 2020 - 2023, USD Million
- TABLE 40 Global Audio-Based GANs Market by Region, 2024 - 2031, USD Million
- TABLE 41 Global Generative Adversarial Networks Market by Industry Vertical, 2020 - 2023, USD Million
- TABLE 42 Global Generative Adversarial Networks Market by Industry Vertical, 2024 - 2031, USD Million
- TABLE 43 Global Media & Entertainment Market by Region, 2020 - 2023, USD Million
- TABLE 44 Global Media & Entertainment Market by Region, 2024 - 2031, USD Million
- TABLE 45 Global Healthcare Market by Region, 2020 - 2023, USD Million
- TABLE 46 Global Healthcare Market by Region, 2024 - 2031, USD Million
- TABLE 47 Global Retail & E-commerce Market by Region, 2020 - 2023, USD Million
- TABLE 48 Global Retail & E-commerce Market by Region, 2024 - 2031, USD Million
- TABLE 49 Global Finance & Banking Market by Region, 2020 - 2023, USD Million
- TABLE 50 Global Finance & Banking Market by Region, 2024 - 2031, USD Million
- TABLE 51 Global Automotive Market by Region, 2020 - 2023, USD Million
- TABLE 52 Global Automotive Market by Region, 2024 - 2031, USD Million
- TABLE 53 Global Other Industry Vertical Market by Region, 2020 - 2023, USD Million
- TABLE 54 Global Other Industry Vertical Market by Region, 2024 - 2031, USD Million
- TABLE 55 Global Generative Adversarial Networks Market by Region, 2020 - 2023, USD Million
- TABLE 56 Global Generative Adversarial Networks Market by Region, 2024 - 2031, USD Million
- TABLE 57 North America Generative Adversarial Networks Market, 2020 - 2023, USD Million
- TABLE 58 North America Generative Adversarial Networks Market, 2024 - 2031, USD Million
- TABLE 59 North America Generative Adversarial Networks Market by Technology, 2020 - 2023, USD Million
- TABLE 60 North America Generative Adversarial Networks Market by Technology, 2024 - 2031, USD Million
- TABLE 61 North America Conditional GANs Market by Country, 2020 - 2023, USD Million
- TABLE 62 North America Conditional GANs Market by Country, 2024 - 2031, USD Million
- TABLE 63 North America Traditional GANs Market by Country, 2020 - 2023, USD Million
- TABLE 64 North America Traditional GANs Market by Country, 2024 - 2031, USD Million
- TABLE 65 North America Cycle GANs Market by Country, 2020 - 2023, USD Million
- TABLE 66 North America Cycle GANs Market by Country, 2024 - 2031, USD Million
- TABLE 67 North America Generative Adversarial Networks Market by Application, 2020 - 2023, USD Million
- TABLE 68 North America Generative Adversarial Networks Market by Application, 2024 - 2031, USD Million
- TABLE 69 North America Image Generation Market by Region, 2020 - 2023, USD Million
- TABLE 70 North America Image Generation Market by Region, 2024 - 2031, USD Million
- TABLE 71 North America Text Generation Market by Region, 2020 - 2023, USD Million
- TABLE 72 North America Text Generation Market by Region, 2024 - 2031, USD Million
- TABLE 73 North America Video Generation Market by Region, 2020 - 2023, USD Million
- TABLE 74 North America Video Generation Market by Region, 2024 - 2031, USD Million
- TABLE 75 North America Audio & Speech Generation Market by Region, 2020 - 2023, USD Million
- TABLE 76 North America Audio & Speech Generation Market by Region, 2024 - 2031, USD Million
- TABLE 77 North America 3D Object Generation Market by Region, 2020 - 2023, USD Million
- TABLE 78 North America 3D Object Generation Market by Region, 2024 - 2031, USD Million
- TABLE 79 North America Generative Adversarial Networks Market by Deployment, 2020 - 2023, USD Million
- TABLE 80 North America Generative Adversarial Networks Market by Deployment, 2024 - 2031, USD Million
- TABLE 81 North America Cloud Market by Country, 2020 - 2023, USD Million
- TABLE 82 North America Cloud Market by Country, 2024 - 2031, USD Million
- TABLE 83 North America On-Premises Market by Country, 2020 - 2023, USD Million
- TABLE 84 North America On-Premises Market by Country, 2024 - 2031, USD Million
- TABLE 85 North America Generative Adversarial Networks Market by Type, 2020 - 2023, USD Million
- TABLE 86 North America Generative Adversarial Networks Market by Type, 2024 - 2031, USD Million
- TABLE 87 North America Image-Based GANs Market by Country, 2020 - 2023, USD Million
- TABLE 88 North America Image-Based GANs Market by Country, 2024 - 2031, USD Million
- TABLE 89 North America Video-Based GANs Market by Country, 2020 - 2023, USD Million
- TABLE 90 North America Video-Based GANs Market by Country, 2024 - 2031, USD Million
- TABLE 91 North America Text-Based GANs Market by Country, 2020 - 2023, USD Million
- TABLE 92 North America Text-Based GANs Market by Country, 2024 - 2031, USD Million
- TABLE 93 North America Audio-Based GANs Market by Country, 2020 - 2023, USD Million
- TABLE 94 North America Audio-Based GANs Market by Country, 2024 - 2031, USD Million
- TABLE 95 North America Generative Adversarial Networks Market by Industry Vertical, 2020 - 2023, USD Million
- TABLE 96 North America Generative Adversarial Networks Market by Industry Vertical, 2024 - 2031, USD Million
- TABLE 97 North America Media & Entertainment Market by Country, 2020 - 2023, USD Million
- TABLE 98 North America Media & Entertainment Market by Country, 2024 - 2031, USD Million
- TABLE 99 North America Healthcare Market by Country, 2020 - 2023, USD Million
- TABLE 100 North America Healthcare Market by Country, 2024 - 2031, USD Million
- TABLE 101 North America Retail & E-commerce Market by Country, 2020 - 2023, USD Million
- TABLE 102 North America Retail & E-commerce Market by Country, 2024 - 2031, USD Million
- TABLE 103 North America Finance & Banking Market by Country, 2020 - 2023, USD Million
- TABLE 104 North America Finance & Banking Market by Country, 2024 - 2031, USD Million
- TABLE 105 North America Automotive Market by Country, 2020 - 2023, USD Million
- TABLE 106 North America Automotive Market by Country, 2024 - 2031, USD Million
- TABLE 107 North America Other Industry Vertical Market by Country, 2020 - 2023, USD Million
- TABLE 108 North America Other Industry Vertical Market by Country, 2024 - 2031, USD Million
- TABLE 109 North America Generative Adversarial Networks Market by Country, 2020 - 2023, USD Million
- TABLE 110 North America Generative Adversarial Networks Market by Country, 2024 - 2031, USD Million
- TABLE 111 US Generative Adversarial Networks Market, 2020 - 2023, USD Million
- TABLE 112 US Generative Adversarial Networks Market, 2024 - 2031, USD Million
- TABLE 113 US Generative Adversarial Networks Market by Technology, 2020 - 2023, USD Million
- TABLE 114 US Generative Adversarial Networks Market by Technology, 2024 - 2031, USD Million
- TABLE 115 US Generative Adversarial Networks Market by Application, 2020 - 2023, USD Million
- TABLE 116 US Generative Adversarial Networks Market by Application, 2024 - 2031, USD Million
- TABLE 117 US Generative Adversarial Networks Market by Deployment, 2020 - 2023, USD Million
- TABLE 118 US Generative Adversarial Networks Market by Deployment, 2024 - 2031, USD Million
- TABLE 119 US Generative Adversarial Networks Market by Type, 2020 - 2023, USD Million
- TABLE 120 US Generative Adversarial Networks Market by Type, 2024 - 2031, USD Million
- TABLE 121 US Generative Adversarial Networks Market by Industry Vertical, 2020 - 2023, USD Million
- TABLE 122 US Generative Adversarial Networks Market by Industry Vertical, 2024 - 2031, USD Million
- TABLE 123 Canada Generative Adversarial Networks Market, 2020 - 2023, USD Million
- TABLE 124 Canada Generative Adversarial Networks Market, 2024 - 2031, USD Million
- TABLE 125 Canada Generative Adversarial Networks Market by Technology, 2020 - 2023, USD Million
- TABLE 126 Canada Generative Adversarial Networks Market by Technology, 2024 - 2031, USD Million
- TABLE 127 Canada Generative Adversarial Networks Market by Application, 2020 - 2023, USD Million
- TABLE 128 Canada Generative Adversarial Networks Market by Application, 2024 - 2031, USD Million
- TABLE 129 Canada Generative Adversarial Networks Market by Deployment, 2020 - 2023, USD Million
- TABLE 130 Canada Generative Adversarial Networks Market by Deployment, 2024 - 2031, USD Million
- TABLE 131 Canada Generative Adversarial Networks Market by Type, 2020 - 2023, USD Million
- TABLE 132 Canada Generative Adversarial Networks Market by Type, 2024 - 2031, USD Million
- TABLE 133 Canada Generative Adversarial Networks Market by Industry Vertical, 2020 - 2023, USD Million
- TABLE 134 Canada Generative Adversarial Networks Market by Industry Vertical, 2024 - 2031, USD Million
- TABLE 135 Mexico Generative Adversarial Networks Market, 2020 - 2023, USD Million
- TABLE 136 Mexico Generative Adversarial Networks Market, 2024 - 2031, USD Million
- TABLE 137 Mexico Generative Adversarial Networks Market by Technology, 2020 - 2023, USD Million
- TABLE 138 Mexico Generative Adversarial Networks Market by Technology, 2024 - 2031, USD Million
- TABLE 139 Mexico Generative Adversarial Networks Market by Application, 2020 - 2023, USD Million
- TABLE 140 Mexico Generative Adversarial Networks Market by Application, 2024 - 2031, USD Million
- TABLE 141 Mexico Generative Adversarial Networks Market by Deployment, 2020 - 2023, USD Million
- TABLE 142 Mexico Generative Adversarial Networks Market by Deployment, 2024 - 2031, USD Million
- TABLE 143 Mexico Generative Adversarial Networks Market by Type, 2020 - 2023, USD Million
- TABLE 144 Mexico Generative Adversarial Networks Market by Type, 2024 - 2031, USD Million
- TABLE 145 Mexico Generative Adversarial Networks Market by Industry Vertical, 2020 - 2023, USD Million
- TABLE 146 Mexico Generative Adversarial Networks Market by Industry Vertical, 2024 - 2031, USD Million
- TABLE 147 Rest of North America Generative Adversarial Networks Market, 2020 - 2023, USD Million
- TABLE 148 Rest of North America Generative Adversarial Networks Market, 2024 - 2031, USD Million
- TABLE 149 Rest of North America Generative Adversarial Networks Market by Technology, 2020 - 2023, USD Million
- TABLE 150 Rest of North America Generative Adversarial Networks Market by Technology, 2024 - 2031, USD Million
- TABLE 151 Rest of North America Generative Adversarial Networks Market by Application, 2020 - 2023, USD Million
- TABLE 152 Rest of North America Generative Adversarial Networks Market by Application, 2024 - 2031, USD Million
- TABLE 153 Rest of North America Generative Adversarial Networks Market by Deployment, 2020 - 2023, USD Million
- TABLE 154 Rest of North America Generative Adversarial Networks Market by Deployment, 2024 - 2031, USD Million
- TABLE 155 Rest of North America Generative Adversarial Networks Market by Type, 2020 - 2023, USD Million
- TABLE 156 Rest of North America Generative Adversarial Networks Market by Type, 2024 - 2031, USD Million
- TABLE 157 Rest of North America Generative Adversarial Networks Market by Industry Vertical, 2020 - 2023, USD Million
- TABLE 158 Rest of North America Generative Adversarial Networks Market by Industry Vertical, 2024 - 2031, USD Million
- TABLE 159 Europe Generative Adversarial Networks Market, 2020 - 2023, USD Million
- TABLE 160 Europe Generative Adversarial Networks Market, 2024 - 2031, USD Million
- TABLE 161 Europe Generative Adversarial Networks Market by Technology, 2020 - 2023, USD Million
- TABLE 162 Europe Generative Adversarial Networks Market by Technology, 2024 - 2031, USD Million
- TABLE 163 Europe Conditional GANs Market by Country, 2020 - 2023, USD Million
- TABLE 164 Europe Conditional GANs Market by Country, 2024 - 2031, USD Million
- TABLE 165 Europe Traditional GANs Market by Country, 2020 - 2023, USD Million
- TABLE 166 Europe Traditional GANs Market by Country, 2024 - 2031, USD Million
- TABLE 167 Europe Cycle GANs Market by Country, 2020 - 2023, USD Million
- TABLE 168 Europe Cycle GANs Market by Country, 2024 - 2031, USD Million
- TABLE 169 Europe Generative Adversarial Networks Market by Application, 2020 - 2023, USD Million
- TABLE 170 Europe Generative Adversarial Networks Market by Application, 2024 - 2031, USD Million
- TABLE 171 Europe Image Generation Market by Country, 2020 - 2023, USD Million
- TABLE 172 Europe Image Generation Market by Country, 2024 - 2031, USD Million
- TABLE 173 Europe Text Generation Market by Country, 2020 - 2023, USD Million
- TABLE 174 Europe Text Generation Market by Country, 2024 - 2031, USD Million
- TABLE 175 Europe Video Generation Market by Country, 2020 - 2023, USD Million
- TABLE 176 Europe Video Generation Market by Country, 2024 - 2031, USD Million
- TABLE 177 Europe Audio & Speech Generation Market by Country, 2020 - 2023, USD Million
- TABLE 178 Europe Audio & Speech Generation Market by Country, 2024 - 2031, USD Million
- TABLE 179 Europe 3D Object Generation Market by Country, 2020 - 2023, USD Million
- TABLE 180 Europe 3D Object Generation Market by Country, 2024 - 2031, USD Million
- TABLE 181 Europe Generative Adversarial Networks Market by Deployment, 2020 - 2023, USD Million
- TABLE 182 Europe Generative Adversarial Networks Market by Deployment, 2024 - 2031, USD Million
- TABLE 183 Europe Cloud Market by Country, 2020 - 2023, USD Million
- TABLE 184 Europe Cloud Market by Country, 2024 - 2031, USD Million
- TABLE 185 Europe On-Premises Market by Country, 2020 - 2023, USD Million
- TABLE 186 Europe On-Premises Market by Country, 2024 - 2031, USD Million
- TABLE 187 Europe Generative Adversarial Networks Market by Type, 2020 - 2023, USD Million
- TABLE 188 Europe Generative Adversarial Networks Market by Type, 2024 - 2031, USD Million
- TABLE 189 Europe Image-Based GANs Market by Country, 2020 - 2023, USD Million
- TABLE 190 Europe Image-Based GANs Market by Country, 2024 - 2031, USD Million
- TABLE 191 Europe Video-Based GANs Market by Country, 2020 - 2023, USD Million
- TABLE 192 Europe Video-Based GANs Market by Country, 2024 - 2031, USD Million
- TABLE 193 Europe Text-Based GANs Market by Country, 2020 - 2023, USD Million
- TABLE 194 Europe Text-Based GANs Market by Country, 2024 - 2031, USD Million
- TABLE 195 Europe Audio-Based GANs Market by Country, 2020 - 2023, USD Million
- TABLE 196 Europe Audio-Based GANs Market by Country, 2024 - 2031, USD Million
- TABLE 197 Europe Generative Adversarial Networks Market by Industry Vertical, 2020 - 2023, USD Million
- TABLE 198 Europe Generative Adversarial Networks Market by Industry Vertical, 2024 - 2031, USD Million
- TABLE 199 Europe Media & Entertainment Market by Country, 2020 - 2023, USD Million
- TABLE 200 Europe Media & Entertainment Market by Country, 2024 - 2031, USD Million
- TABLE 201 Europe Healthcare Market by Country, 2020 - 2023, USD Million
- TABLE 202 Europe Healthcare Market by Country, 2024 - 2031, USD Million
- TABLE 203 Europe Retail & E-commerce Market by Country, 2020 - 2023, USD Million
- TABLE 204 Europe Retail & E-commerce Market by Country, 2024 - 2031, USD Million
- TABLE 205 Europe Finance & Banking Market by Country, 2020 - 2023, USD Million
- TABLE 206 Europe Finance & Banking Market by Country, 2024 - 2031, USD Million
- TABLE 207 Europe Automotive Market by Country, 2020 - 2023, USD Million
- TABLE 208 Europe Automotive Market by Country, 2024 - 2031, USD Million
- TABLE 209 Europe Other Industry Vertical Market by Country, 2020 - 2023, USD Million
- TABLE 210 Europe Other Industry Vertical Market by Country, 2024 - 2031, USD Million
- TABLE 211 Europe Generative Adversarial Networks Market by Country, 2020 - 2023, USD Million
- TABLE 212 Europe Generative Adversarial Networks Market by Country, 2024 - 2031, USD Million
- TABLE 213 Germany Generative Adversarial Networks Market, 2020 - 2023, USD Million
- TABLE 214 Germany Generative Adversarial Networks Market, 2024 - 2031, USD Million
- TABLE 215 Germany Generative Adversarial Networks Market by Technology, 2020 - 2023, USD Million
- TABLE 216 Germany Generative Adversarial Networks Market by Technology, 2024 - 2031, USD Million
- TABLE 217 Germany Generative Adversarial Networks Market by Application, 2020 - 2023, USD Million
- TABLE 218 Germany Generative Adversarial Networks Market by Application, 2024 - 2031, USD Million
- TABLE 219 Germany Generative Adversarial Networks Market by Deployment, 2020 - 2023, USD Million
- TABLE 220 Germany Generative Adversarial Networks Market by Deployment, 2024 - 2031, USD Million
- TABLE 221 Germany Generative Adversarial Networks Market by Type, 2020 - 2023, USD Million
- TABLE 222 Germany Generative Adversarial Networks Market by Type, 2024 - 2031, USD Million
- TABLE 223 Germany Generative Adversarial Networks Market by Industry Vertical, 2020 - 2023, USD Million
- TABLE 224 Germany Generative Adversarial Networks Market by Industry Vertical, 2024 - 2031, USD Million
- TABLE 225 UK Generative Adversarial Networks Market, 2020 - 2023, USD Million
- TABLE 226 UK Generative Adversarial Networks Market, 2024 - 2031, USD Million
- TABLE 227 UK Generative Adversarial Networks Market by Technology, 2020 - 2023, USD Million
- TABLE 228 UK Generative Adversarial Networks Market by Technology, 2024 - 2031, USD Million
- TABLE 229 UK Generative Adversarial Networks Market by Application, 2020 - 2023, USD Million
- TABLE 230 UK Generative Adversarial Networks Market by Application, 2024 - 2031, USD Million
- TABLE 231 UK Generative Adversarial Networks Market by Deployment, 2020 - 2023, USD Million
- TABLE 232 UK Generative Adversarial Networks Market by Deployment, 2024 - 2031, USD Million
- TABLE 233 UK Generative Adversarial Networks Market by Type, 2020 - 2023, USD Million
- TABLE 234 UK Generative Adversarial Networks Market by Type, 2024 - 2031, USD Million
- TABLE 235 UK Generative Adversarial Networks Market by Industry Vertical, 2020 - 2023, USD Million
- TABLE 236 UK Generative Adversarial Networks Market by Industry Vertical, 2024 - 2031, USD Million
- TABLE 237 France Generative Adversarial Networks Market, 2020 - 2023, USD Million
- TABLE 238 France Generative Adversarial Networks Market, 2024 - 2031, USD Million
- TABLE 239 France Generative Adversarial Networks Market by Technology, 2020 - 2023, USD Million
- TABLE 240 France Generative Adversarial Networks Market by Technology, 2024 - 2031, USD Million
- TABLE 241 France Generative Adversarial Networks Market by Application, 2020 - 2023, USD Million
- TABLE 242 France Generative Adversarial Networks Market by Application, 2024 - 2031, USD Million
- TABLE 243 France Generative Adversarial Networks Market by Deployment, 2020 - 2023, USD Million
- TABLE 244 France Generative Adversarial Networks Market by Deployment, 2024 - 2031, USD Million
- TABLE 245 France Generative Adversarial Networks Market by Type, 2020 - 2023, USD Million
- TABLE 246 France Generative Adversarial Networks Market by Type, 2024 - 2031, USD Million
- TABLE 247 France Generative Adversarial Networks Market by Industry Vertical, 2020 - 2023, USD Million
- TABLE 248 France Generative Adversarial Networks Market by Industry Vertical, 2024 - 2031, USD Million
- TABLE 249 Russia Generative Adversarial Networks Market, 2020 - 2023, USD Million
- TABLE 250 Russia Generative Adversarial Networks Market, 2024 - 2031, USD Million
- TABLE 251 Russia Generative Adversarial Networks Market by Technology, 2020 - 2023, USD Million
- TABLE 252 Russia Generative Adversarial Networks Market by Technology, 2024 - 2031, USD Million
- TABLE 253 Russia Generative Adversarial Networks Market by Application, 2020 - 2023, USD Million
- TABLE 254 Russia Generative Adversarial Networks Market by Application, 2024 - 2031, USD Million
- TABLE 255 Russia Generative Adversarial Networks Market by Deployment, 2020 - 2023, USD Million
- TABLE 256 Russia Generative Adversarial Networks Market by Deployment, 2024 - 2031, USD Million
- TABLE 257 Russia Generative Adversarial Networks Market by Type, 2020 - 2023, USD Million
- TABLE 258 Russia Generative Adversarial Networks Market by Type, 2024 - 2031, USD Million
- TABLE 259 Russia Generative Adversarial Networks Market by Industry Vertical, 2020 - 2023, USD Million
- TABLE 260 Russia Generative Adversarial Networks Market by Industry Vertical, 2024 - 2031, USD Million
- TABLE 261 Spain Generative Adversarial Networks Market, 2020 - 2023, USD Million
- TABLE 262 Spain Generative Adversarial Networks Market, 2024 - 2031, USD Million
- TABLE 263 Spain Generative Adversarial Networks Market by Technology, 2020 - 2023, USD Million
- TABLE 264 Spain Generative Adversarial Networks Market by Technology, 2024 - 2031, USD Million
- TABLE 265 Spain Generative Adversarial Networks Market by Application, 2020 - 2023, USD Million
- TABLE 266 Spain Generative Adversarial Networks Market by Application, 2024 - 2031, USD Million
- TABLE 267 Spain Generative Adversarial Networks Market by Deployment, 2020 - 2023, USD Million
- TABLE 268 Spain Generative Adversarial Networks Market by Deployment, 2024 - 2031, USD Million
- TABLE 269 Spain Generative Adversarial Networks Market by Type, 2020 - 2023, USD Million
- TABLE 270 Spain Generative Adversarial Networks Market by Type, 2024 - 2031, USD Million
- TABLE 271 Spain Generative Adversarial Networks Market by Industry Vertical, 2020 - 2023, USD Million
- TABLE 272 Spain Generative Adversarial Networks Market by Industry Vertical, 2024 - 2031, USD Million
- TABLE 273 Italy Generative Adversarial Networks Market, 2020 - 2023, USD Million
- TABLE 274 Italy Generative Adversarial Networks Market, 2024 - 2031, USD Million
- TABLE 275 Italy Generative Adversarial Networks Market by Technology, 2020 - 2023, USD Million
- TABLE 276 Italy Generative Adversarial Networks Market by Technology, 2024 - 2031, USD Million
- TABLE 277 Italy Generative Adversarial Networks Market by Application, 2020 - 2023, USD Million
- TABLE 278 Italy Generative Adversarial Networks Market by Application, 2024 - 2031, USD Million
- TABLE 279 Italy Generative Adversarial Networks Market by Deployment, 2020 - 2023, USD Million
- TABLE 280 Italy Generative Adversarial Networks Market by Deployment, 2024 - 2031, USD Million
- TABLE 281 Italy Generative Adversarial Networks Market by Type, 2020 - 2023, USD Million
- TABLE 282 Italy Generative Adversarial Networks Market by Type, 2024 - 2031, USD Million
- TABLE 283 Italy Generative Adversarial Networks Market by Industry Vertical, 2020 - 2023, USD Million
- TABLE 284 Italy Generative Adversarial Networks Market by Industry Vertical, 2024 - 2031, USD Million
- TABLE 285 Rest of Europe Generative Adversarial Networks Market, 2020 - 2023, USD Million
- TABLE 286 Rest of Europe Generative Adversarial Networks Market, 2024 - 2031, USD Million
- TABLE 287 Rest of Europe Generative Adversarial Networks Market by Technology, 2020 - 2023, USD Million
- TABLE 288 Rest of Europe Generative Adversarial Networks Market by Technology, 2024 - 2031, USD Million
- TABLE 289 Rest of Europe Generative Adversarial Networks Market by Application, 2020 - 2023, USD Million
- TABLE 290 Rest of Europe Generative Adversarial Networks Market by Application, 2024 - 2031, USD Million
- TABLE 291 Rest of Europe Generative Adversarial Networks Market by Deployment, 2020 - 2023, USD Million
- TABLE 292 Rest of Europe Generative Adversarial Networks Market by Deployment, 2024 - 2031, USD Million
- TABLE 293 Rest of Europe Generative Adversarial Networks Market by Type, 2020 - 2023, USD Million
- TABLE 294 Rest of Europe Generative Adversarial Networks Market by Type, 2024 - 2031, USD Million
- TABLE 295 Rest of Europe Generative Adversarial Networks Market by Industry Vertical, 2020 - 2023, USD Million
- TABLE 296 Rest of Europe Generative Adversarial Networks Market by Industry Vertical, 2024 - 2031, USD Million
- TABLE 297 Asia Pacific Generative Adversarial Networks Market, 2020 - 2023, USD Million
- TABLE 298 Asia Pacific Generative Adversarial Networks Market, 2024 - 2031, USD Million
- TABLE 299 Asia Pacific Generative Adversarial Networks Market by Technology, 2020 - 2023, USD Million
- TABLE 300 Asia Pacific Generative Adversarial Networks Market by Technology, 2024 - 2031, USD Million
- TABLE 301 Asia Pacific Conditional GANs Market by Country, 2020 - 2023, USD Million
- TABLE 302 Asia Pacific Conditional GANs Market by Country, 2024 - 2031, USD Million
- TABLE 303 Asia Pacific Traditional GANs Market by Country, 2020 - 2023, USD Million
- TABLE 304 Asia Pacific Traditional GANs Market by Country, 2024 - 2031, USD Million
- TABLE 305 Asia Pacific Cycle GANs Market by Country, 2020 - 2023, USD Million
- TABLE 306 Asia Pacific Cycle GANs Market by Country, 2024 - 2031, USD Million
- TABLE 307 Asia Pacific Generative Adversarial Networks Market by Application, 2020 - 2023, USD Million
- TABLE 308 Asia Pacific Generative Adversarial Networks Market by Application, 2024 - 2031, USD Million
- TABLE 309 Asia Pacific Image Generation Market by Country, 2020 - 2023, USD Million
- TABLE 310 Asia Pacific Image Generation Market by Country, 2024 - 2031, USD Million
- TABLE 311 Asia Pacific Text Generation Market by Country, 2020 - 2023, USD Million
- TABLE 312 Asia Pacific Text Generation Market by Country, 2024 - 2031, USD Million
- TABLE 313 Asia Pacific Video Generation Market by Country, 2020 - 2023, USD Million
- TABLE 314 Asia Pacific Video Generation Market by Country, 2024 - 2031, USD Million
- TABLE 315 Asia Pacific Audio & Speech Generation Market by Country, 2020 - 2023, USD Million
- TABLE 316 Asia Pacific Audio & Speech Generation Market by Country, 2024 - 2031, USD Million
- TABLE 317 Asia Pacific 3D Object Generation Market by Country, 2020 - 2023, USD Million
- TABLE 318 Asia Pacific 3D Object Generation Market by Country, 2024 - 2031, USD Million
- TABLE 319 Asia Pacific Generative Adversarial Networks Market by Deployment, 2020 - 2023, USD Million
- TABLE 320 Asia Pacific Generative Adversarial Networks Market by Deployment, 2024 - 2031, USD Million
- TABLE 321 Asia Pacific Cloud Market by Country, 2020 - 2023, USD Million
- TABLE 322 Asia Pacific Cloud Market by Country, 2024 - 2031, USD Million
- TABLE 323 Asia Pacific On-Premises Market by Country, 2020 - 2023, USD Million
- TABLE 324 Asia Pacific On-Premises Market by Country, 2024 - 2031, USD Million
- TABLE 325 Asia Pacific Generative Adversarial Networks Market by Type, 2020 - 2023, USD Million
- TABLE 326 Asia Pacific Generative Adversarial Networks Market by Type, 2024 - 2031, USD Million
- TABLE 327 Asia Pacific Image-Based GANs Market by Country, 2020 - 2023, USD Million
- TABLE 328 Asia Pacific Image-Based GANs Market by Country, 2024 - 2031, USD Million
- TABLE 329 Asia Pacific Video-Based GANs Market by Country, 2020 - 2023, USD Million
- TABLE 330 Asia Pacific Video-Based GANs Market by Country, 2024 - 2031, USD Million
- TABLE 331 Asia Pacific Text-Based GANs Market by Country, 2020 - 2023, USD Million
- TABLE 332 Asia Pacific Text-Based GANs Market by Country, 2024 - 2031, USD Million
- TABLE 333 Asia Pacific Audio-Based GANs Market by Country, 2020 - 2023, USD Million
- TABLE 334 Asia Pacific Audio-Based GANs Market by Country, 2024 - 2031, USD Million
- TABLE 335 Asia Pacific Generative Adversarial Networks Market by Industry Vertical, 2020 - 2023, USD Million
- TABLE 336 Asia Pacific Generative Adversarial Networks Market by Industry Vertical, 2024 - 2031, USD Million
- TABLE 337 Asia Pacific Media & Entertainment Market by Country, 2020 - 2023, USD Million
- TABLE 338 Asia Pacific Media & Entertainment Market by Country, 2024 - 2031, USD Million
- TABLE 339 Asia Pacific Healthcare Market by Country, 2020 - 2023, USD Million
- TABLE 340 Asia Pacific Healthcare Market by Country, 2024 - 2031, USD Million
- TABLE 341 Asia Pacific Retail & E-commerce Market by Country, 2020 - 2023, USD Million
- TABLE 342 Asia Pacific Retail & E-commerce Market by Country, 2024 - 2031, USD Million
- TABLE 343 Asia Pacific Finance & Banking Market by Country, 2020 - 2023, USD Million
- TABLE 344 Asia Pacific Finance & Banking Market by Country, 2024 - 2031, USD Million
- TABLE 345 Asia Pacific Automotive Market by Country, 2020 - 2023, USD Million
- TABLE 346 Asia Pacific Automotive Market by Country, 2024 - 2031, USD Million
- TABLE 347 Asia Pacific Other Industry Vertical Market by Country, 2020 - 2023, USD Million
- TABLE 348 Asia Pacific Other Industry Vertical Market by Country, 2024 - 2031, USD Million
- TABLE 349 Asia Pacific Generative Adversarial Networks Market by Country, 2020 - 2023, USD Million
- TABLE 350 Asia Pacific Generative Adversarial Networks Market by Country, 2024 - 2031, USD Million
- TABLE 351 China Generative Adversarial Networks Market, 2020 - 2023, USD Million
- TABLE 352 China Generative Adversarial Networks Market, 2024 - 2031, USD Million
- TABLE 353 China Generative Adversarial Networks Market by Technology, 2020 - 2023, USD Million
- TABLE 354 China Generative Adversarial Networks Market by Technology, 2024 - 2031, USD Million
- TABLE 355 China Generative Adversarial Networks Market by Application, 2020 - 2023, USD Million
- TABLE 356 China Generative Adversarial Networks Market by Application, 2024 - 2031, USD Million
- TABLE 357 China Generative Adversarial Networks Market by Deployment, 2020 - 2023, USD Million
- TABLE 358 China Generative Adversarial Networks Market by Deployment, 2024 - 2031, USD Million
- TABLE 359 China Generative Adversarial Networks Market by Type, 2020 - 2023, USD Million
- TABLE 360 China Generative Adversarial Networks Market by Type, 2024 - 2031, USD Million
- TABLE 361 China Generative Adversarial Networks Market by Industry Vertical, 2020 - 2023, USD Million
- TABLE 362 China Generative Adversarial Networks Market by Industry Vertical, 2024 - 2031, USD Million
- TABLE 363 Japan Generative Adversarial Networks Market, 2020 - 2023, USD Million
- TABLE 364 Japan Generative Adversarial Networks Market, 2024 - 2031, USD Million
- TABLE 365 Japan Generative Adversarial Networks Market by Technology, 2020 - 2023, USD Million
- TABLE 366 Japan Generative Adversarial Networks Market by Technology, 2024 - 2031, USD Million
- TABLE 367 Japan Generative Adversarial Networks Market by Application, 2020 - 2023, USD Million
- TABLE 368 Japan Generative Adversarial Networks Market by Application, 2024 - 2031, USD Million
- TABLE 369 Japan Generative Adversarial Networks Market by Deployment, 2020 - 2023, USD Million
- TABLE 370 Japan Generative Adversarial Networks Market by Deployment, 2024 - 2031, USD Million
- TABLE 371 Japan Generative Adversarial Networks Market by Type, 2020 - 2023, USD Million
- TABLE 372 Japan Generative Adversarial Networks Market by Type, 2024 - 2031, USD Million
- TABLE 373 Japan Generative Adversarial Networks Market by Industry Vertical, 2020 - 2023, USD Million
- TABLE 374 Japan Generative Adversarial Networks Market by Industry Vertical, 2024 - 2031, USD Million
- TABLE 375 India Generative Adversarial Networks Market, 2020 - 2023, USD Million
- TABLE 376 India Generative Adversarial Networks Market, 2024 - 2031, USD Million
- TABLE 377 India Generative Adversarial Networks Market by Technology, 2020 - 2023, USD Million
- TABLE 378 India Generative Adversarial Networks Market by Technology, 2024 - 2031, USD Million
- TABLE 379 India Generative Adversarial Networks Market by Application, 2020 - 2023, USD Million
- TABLE 380 India Generative Adversarial Networks Market by Application, 2024 - 2031, USD Million
- TABLE 381 India Generative Adversarial Networks Market by Deployment, 2020 - 2023, USD Million
- TABLE 382 India Generative Adversarial Networks Market by Deployment, 2024 - 2031, USD Million
- TABLE 383 India Generative Adversarial Networks Market by Type, 2020 - 2023, USD Million
- TABLE 384 India Generative Adversarial Networks Market by Type, 2024 - 2031, USD Million
- TABLE 385 India Generative Adversarial Networks Market by Industry Vertical, 2020 - 2023, USD Million
- TABLE 386 India Generative Adversarial Networks Market by Industry Vertical, 2024 - 2031, USD Million
- TABLE 387 South Korea Generative Adversarial Networks Market, 2020 - 2023, USD Million
- TABLE 388 South Korea Generative Adversarial Networks Market, 2024 - 2031, USD Million
- TABLE 389 South Korea Generative Adversarial Networks Market by Technology, 2020 - 2023, USD Million
- TABLE 390 South Korea Generative Adversarial Networks Market by Technology, 2024 - 2031, USD Million
- TABLE 391 South Korea Generative Adversarial Networks Market by Application, 2020 - 2023, USD Million
- TABLE 392 South Korea Generative Adversarial Networks Market by Application, 2024 - 2031, USD Million
- TABLE 393 South Korea Generative Adversarial Networks Market by Deployment, 2020 - 2023, USD Million
- TABLE 394 South Korea Generative Adversarial Networks Market by Deployment, 2024 - 2031, USD Million
- TABLE 395 South Korea Generative Adversarial Networks Market by Type, 2020 - 2023, USD Million
- TABLE 396 South Korea Generative Adversarial Networks Market by Type, 2024 - 2031, USD Million
- TABLE 397 South Korea Generative Adversarial Networks Market by Industry Vertical, 2020 - 2023, USD Million
- TABLE 398 South Korea Generative Adversarial Networks Market by Industry Vertical, 2024 - 2031, USD Million
- TABLE 399 Singapore Generative Adversarial Networks Market, 2020 - 2023, USD Million
- TABLE 400 Singapore Generative Adversarial Networks Market, 2024 - 2031, USD Million
- TABLE 401 Singapore Generative Adversarial Networks Market by Technology, 2020 - 2023, USD Million
- TABLE 402 Singapore Generative Adversarial Networks Market by Technology, 2024 - 2031, USD Million
- TABLE 403 Singapore Generative Adversarial Networks Market by Application, 2020 - 2023, USD Million
- TABLE 404 Singapore Generative Adversarial Networks Market by Application, 2024 - 2031, USD Million
- TABLE 405 Singapore Generative Adversarial Networks Market by Deployment, 2020 - 2023, USD Million
- TABLE 406 Singapore Generative Adversarial Networks Market by Deployment, 2024 - 2031, USD Million
- TABLE 407 Singapore Generative Adversarial Networks Market by Type, 2020 - 2023, USD Million
- TABLE 408 Singapore Generative Adversarial Networks Market by Type, 2024 - 2031, USD Million
- TABLE 409 Singapore Generative Adversarial Networks Market by Industry Vertical, 2020 - 2023, USD Million
- TABLE 410 Singapore Generative Adversarial Networks Market by Industry Vertical, 2024 - 2031, USD Million
- TABLE 411 Malaysia Generative Adversarial Networks Market, 2020 - 2023, USD Million
- TABLE 412 Malaysia Generative Adversarial Networks Market, 2024 - 2031, USD Million
- TABLE 413 Malaysia Generative Adversarial Networks Market by Technology, 2020 - 2023, USD Million
- TABLE 414 Malaysia Generative Adversarial Networks Market by Technology, 2024 - 2031, USD Million
- TABLE 415 Malaysia Generative Adversarial Networks Market by Application, 2020 - 2023, USD Million
- TABLE 416 Malaysia Generative Adversarial Networks Market by Application, 2024 - 2031, USD Million
- TABLE 417 Malaysia Generative Adversarial Networks Market by Deployment, 2020 - 2023, USD Million
- TABLE 418 Malaysia Generative Adversarial Networks Market by Deployment, 2024 - 2031, USD Million
- TABLE 419 Malaysia Generative Adversarial Networks Market by Type, 2020 - 2023, USD Million
- TABLE 420 Malaysia Generative Adversarial Networks Market by Type, 2024 - 2031, USD Million
- TABLE 421 Malaysia Generative Adversarial Networks Market by Industry Vertical, 2020 - 2023, USD Million
- TABLE 422 Malaysia Generative Adversarial Networks Market by Industry Vertical, 2024 - 2031, USD Million
- TABLE 423 Rest of Asia Pacific Generative Adversarial Networks Market, 2020 - 2023, USD Million
- TABLE 424 Rest of Asia Pacific Generative Adversarial Networks Market, 2024 - 2031, USD Million
- TABLE 425 Rest of Asia Pacific Generative Adversarial Networks Market by Technology, 2020 - 2023, USD Million
- TABLE 426 Rest of Asia Pacific Generative Adversarial Networks Market by Technology, 2024 - 2031, USD Million
- TABLE 427 Rest of Asia Pacific Generative Adversarial Networks Market by Application, 2020 - 2023, USD Million
- TABLE 428 Rest of Asia Pacific Generative Adversarial Networks Market by Application, 2024 - 2031, USD Million
- TABLE 429 Rest of Asia Pacific Generative Adversarial Networks Market by Deployment, 2020 - 2023, USD Million
- TABLE 430 Rest of Asia Pacific Generative Adversarial Networks Market by Deployment, 2024 - 2031, USD Million
- TABLE 431 Rest of Asia Pacific Generative Adversarial Networks Market by Type, 2020 - 2023, USD Million
- TABLE 432 Rest of Asia Pacific Generative Adversarial Networks Market by Type, 2024 - 2031, USD Million
- TABLE 433 Rest of Asia Pacific Generative Adversarial Networks Market by Industry Vertical, 2020 - 2023, USD Million
- TABLE 434 Rest of Asia Pacific Generative Adversarial Networks Market by Industry Vertical, 2024 - 2031, USD Million
- TABLE 435 LAMEA Generative Adversarial Networks Market, 2020 - 2023, USD Million
- TABLE 436 LAMEA Generative Adversarial Networks Market, 2024 - 2031, USD Million
- TABLE 437 LAMEA Generative Adversarial Networks Market by Technology, 2020 - 2023, USD Million
- TABLE 438 LAMEA Generative Adversarial Networks Market by Technology, 2024 - 2031, USD Million
- TABLE 439 LAMEA Conditional GANs Market by Country, 2020 - 2023, USD Million
- TABLE 440 LAMEA Conditional GANs Market by Country, 2024 - 2031, USD Million
- TABLE 441 LAMEA Traditional GANs Market by Country, 2020 - 2023, USD Million
- TABLE 442 LAMEA Traditional GANs Market by Country, 2024 - 2031, USD Million
- TABLE 443 LAMEA Cycle GANs Market by Country, 2020 - 2023, USD Million
- TABLE 444 LAMEA Cycle GANs Market by Country, 2024 - 2031, USD Million
- TABLE 445 LAMEA Generative Adversarial Networks Market by Application, 2020 - 2023, USD Million
- TABLE 446 LAMEA Generative Adversarial Networks Market by Application, 2024 - 2031, USD Million
- TABLE 447 LAMEA Image Generation Market by Country, 2020 - 2023, USD Million
- TABLE 448 LAMEA Image Generation Market by Country, 2024 - 2031, USD Million
- TABLE 449 LAMEA Text Generation Market by Country, 2020 - 2023, USD Million
- TABLE 450 LAMEA Text Generation Market by Country, 2024 - 2031, USD Million
- TABLE 451 LAMEA Video Generation Market by Country, 2020 - 2023, USD Million
- TABLE 452 LAMEA Video Generation Market by Country, 2024 - 2031, USD Million
- TABLE 453 LAMEA Audio & Speech Generation Market by Country, 2020 - 2023, USD Million
- TABLE 454 LAMEA Audio & Speech Generation Market by Country, 2024 - 2031, USD Million
- TABLE 455 LAMEA 3D Object Generation Market by Country, 2020 - 2023, USD Million
- TABLE 456 LAMEA 3D Object Generation Market by Country, 2024 - 2031, USD Million
- TABLE 457 LAMEA Generative Adversarial Networks Market by Deployment, 2020 - 2023, USD Million
- TABLE 458 LAMEA Generative Adversarial Networks Market by Deployment, 2024 - 2031, USD Million
- TABLE 459 LAMEA Cloud Market by Country, 2020 - 2023, USD Million
- TABLE 460 LAMEA Cloud Market by Country, 2024 - 2031, USD Million
- TABLE 461 LAMEA On-Premises Market by Country, 2020 - 2023, USD Million
- TABLE 462 LAMEA On-Premises Market by Country, 2024 - 2031, USD Million
- TABLE 463 LAMEA Generative Adversarial Networks Market by Type, 2020 - 2023, USD Million
- TABLE 464 LAMEA Generative Adversarial Networks Market by Type, 2024 - 2031, USD Million
- TABLE 465 LAMEA Image-Based GANs Market by Country, 2020 - 2023, USD Million
- TABLE 466 LAMEA Image-Based GANs Market by Country, 2024 - 2031, USD Million
- TABLE 467 LAMEA Video-Based GANs Market by Country, 2020 - 2023, USD Million
- TABLE 468 LAMEA Video-Based GANs Market by Country, 2024 - 2031, USD Million
- TABLE 469 LAMEA Text-Based GANs Market by Country, 2020 - 2023, USD Million
- TABLE 470 LAMEA Text-Based GANs Market by Country, 2024 - 2031, USD Million
- TABLE 471 LAMEA Audio-Based GANs Market by Country, 2020 - 2023, USD Million
- TABLE 472 LAMEA Audio-Based GANs Market by Country, 2024 - 2031, USD Million
- TABLE 473 LAMEA Generative Adversarial Networks Market by Industry Vertical, 2020 - 2023, USD Million
- TABLE 474 LAMEA Generative Adversarial Networks Market by Industry Vertical, 2024 - 2031, USD Million
- TABLE 475 LAMEA Media & Entertainment Market by Country, 2020 - 2023, USD Million
- TABLE 476 LAMEA Media & Entertainment Market by Country, 2024 - 2031, USD Million
- TABLE 477 LAMEA Healthcare Market by Country, 2020 - 2023, USD Million
- TABLE 478 LAMEA Healthcare Market by Country, 2024 - 2031, USD Million
- TABLE 479 LAMEA Retail & E-commerce Market by Country, 2020 - 2023, USD Million
- TABLE 480 LAMEA Retail & E-commerce Market by Country, 2024 - 2031, USD Million
- TABLE 481 LAMEA Finance & Banking Market by Country, 2020 - 2023, USD Million
- TABLE 482 LAMEA Finance & Banking Market by Country, 2024 - 2031, USD Million
- TABLE 483 LAMEA Automotive Market by Country, 2020 - 2023, USD Million
- TABLE 484 LAMEA Automotive Market by Country, 2024 - 2031, USD Million
- TABLE 485 LAMEA Other Industry Vertical Market by Country, 2020 - 2023, USD Million
- TABLE 486 LAMEA Other Industry Vertical Market by Country, 2024 - 2031, USD Million
- TABLE 487 LAMEA Generative Adversarial Networks Market by Country, 2020 - 2023, USD Million
- TABLE 488 LAMEA Generative Adversarial Networks Market by Country, 2024 - 2031, USD Million
- TABLE 489 Brazil Generative Adversarial Networks Market, 2020 - 2023, USD Million
- TABLE 490 Brazil Generative Adversarial Networks Market, 2024 - 2031, USD Million
- TABLE 491 Brazil Generative Adversarial Networks Market by Technology, 2020 - 2023, USD Million
- TABLE 492 Brazil Generative Adversarial Networks Market by Technology, 2024 - 2031, USD Million
- TABLE 493 Brazil Generative Adversarial Networks Market by Application, 2020 - 2023, USD Million
- TABLE 494 Brazil Generative Adversarial Networks Market by Application, 2024 - 2031, USD Million
- TABLE 495 Brazil Generative Adversarial Networks Market by Deployment, 2020 - 2023, USD Million
- TABLE 496 Brazil Generative Adversarial Networks Market by Deployment, 2024 - 2031, USD Million
- TABLE 497 Brazil Generative Adversarial Networks Market by Type, 2020 - 2023, USD Million
- TABLE 498 Brazil Generative Adversarial Networks Market by Type, 2024 - 2031, USD Million
- TABLE 499 Brazil Generative Adversarial Networks Market by Industry Vertical, 2020 - 2023, USD Million
- TABLE 500 Brazil Generative Adversarial Networks Market by Industry Vertical, 2024 - 2031, USD Million
- TABLE 501 Argentina Generative Adversarial Networks Market, 2020 - 2023, USD Million
- TABLE 502 Argentina Generative Adversarial Networks Market, 2024 - 2031, USD Million
- TABLE 503 Argentina Generative Adversarial Networks Market by Technology, 2020 - 2023, USD Million
- TABLE 504 Argentina Generative Adversarial Networks Market by Technology, 2024 - 2031, USD Million
- TABLE 505 Argentina Generative Adversarial Networks Market by Application, 2020 - 2023, USD Million
- TABLE 506 Argentina Generative Adversarial Networks Market by Application, 2024 - 2031, USD Million
- TABLE 507 Argentina Generative Adversarial Networks Market by Deployment, 2020 - 2023, USD Million
- TABLE 508 Argentina Generative Adversarial Networks Market by Deployment, 2024 - 2031, USD Million
- TABLE 509 Argentina Generative Adversarial Networks Market by Type, 2020 - 2023, USD Million
- TABLE 510 Argentina Generative Adversarial Networks Market by Type, 2024 - 2031, USD Million
- TABLE 511 Argentina Generative Adversarial Networks Market by Industry Vertical, 2020 - 2023, USD Million
- TABLE 512 Argentina Generative Adversarial Networks Market by Industry Vertical, 2024 - 2031, USD Million
- TABLE 513 UAE Generative Adversarial Networks Market, 2020 - 2023, USD Million
- TABLE 514 UAE Generative Adversarial Networks Market, 2024 - 2031, USD Million
- TABLE 515 UAE Generative Adversarial Networks Market by Technology, 2020 - 2023, USD Million
- TABLE 516 UAE Generative Adversarial Networks Market by Technology, 2024 - 2031, USD Million
- TABLE 517 UAE Generative Adversarial Networks Market by Application, 2020 - 2023, USD Million
- TABLE 518 UAE Generative Adversarial Networks Market by Application, 2024 - 2031, USD Million
- TABLE 519 UAE Generative Adversarial Networks Market by Deployment, 2020 - 2023, USD Million
- TABLE 520 UAE Generative Adversarial Networks Market by Deployment, 2024 - 2031, USD Million
- TABLE 521 UAE Generative Adversarial Networks Market by Type, 2020 - 2023, USD Million
- TABLE 522 UAE Generative Adversarial Networks Market by Type, 2024 - 2031, USD Million
- TABLE 523 UAE Generative Adversarial Networks Market by Industry Vertical, 2020 - 2023, USD Million
- TABLE 524 UAE Generative Adversarial Networks Market by Industry Vertical, 2024 - 2031, USD Million
- TABLE 525 Saudi Arabia Generative Adversarial Networks Market, 2020 - 2023, USD Million
- TABLE 526 Saudi Arabia Generative Adversarial Networks Market, 2024 - 2031, USD Million
- TABLE 527 Saudi Arabia Generative Adversarial Networks Market by Technology, 2020 - 2023, USD Million
- TABLE 528 Saudi Arabia Generative Adversarial Networks Market by Technology, 2024 - 2031, USD Million
- TABLE 529 Saudi Arabia Generative Adversarial Networks Market by Application, 2020 - 2023, USD Million
- TABLE 530 Saudi Arabia Generative Adversarial Networks Market by Application, 2024 - 2031, USD Million
- TABLE 531 Saudi Arabia Generative Adversarial Networks Market by Deployment, 2020 - 2023, USD Million
- TABLE 532 Saudi Arabia Generative Adversarial Networks Market by Deployment, 2024 - 2031, USD Million
- TABLE 533 Saudi Arabia Generative Adversarial Networks Market by Type, 2020 - 2023, USD Million
- TABLE 534 Saudi Arabia Generative Adversarial Networks Market by Type, 2024 - 2031, USD Million
- TABLE 535 Saudi Arabia Generative Adversarial Networks Market by Industry Vertical, 2020 - 2023, USD Million
- TABLE 536 Saudi Arabia Generative Adversarial Networks Market by Industry Vertical, 2024 - 2031, USD Million
- TABLE 537 South Africa Generative Adversarial Networks Market, 2020 - 2023, USD Million
- TABLE 538 South Africa Generative Adversarial Networks Market, 2024 - 2031, USD Million
- TABLE 539 South Africa Generative Adversarial Networks Market by Technology, 2020 - 2023, USD Million
- TABLE 540 South Africa Generative Adversarial Networks Market by Technology, 2024 - 2031, USD Million
- TABLE 541 South Africa Generative Adversarial Networks Market by Application, 2020 - 2023, USD Million
- TABLE 542 South Africa Generative Adversarial Networks Market by Application, 2024 - 2031, USD Million
- TABLE 543 South Africa Generative Adversarial Networks Market by Deployment, 2020 - 2023, USD Million
- TABLE 544 South Africa Generative Adversarial Networks Market by Deployment, 2024 - 2031, USD Million
- TABLE 545 South Africa Generative Adversarial Networks Market by Type, 2020 - 2023, USD Million
- TABLE 546 South Africa Generative Adversarial Networks Market by Type, 2024 - 2031, USD Million
- TABLE 547 South Africa Generative Adversarial Networks Market by Industry Vertical, 2020 - 2023, USD Million
- TABLE 548 South Africa Generative Adversarial Networks Market by Industry Vertical, 2024 - 2031, USD Million
- TABLE 549 Nigeria Generative Adversarial Networks Market, 2020 - 2023, USD Million
- TABLE 550 Nigeria Generative Adversarial Networks Market, 2024 - 2031, USD Million
- TABLE 551 Nigeria Generative Adversarial Networks Market by Technology, 2020 - 2023, USD Million
- TABLE 552 Nigeria Generative Adversarial Networks Market by Technology, 2024 - 2031, USD Million
- TABLE 553 Nigeria Generative Adversarial Networks Market by Application, 2020 - 2023, USD Million
- TABLE 554 Nigeria Generative Adversarial Networks Market by Application, 2024 - 2031, USD Million
- TABLE 555 Nigeria Generative Adversarial Networks Market by Deployment, 2020 - 2023, USD Million
- TABLE 556 Nigeria Generative Adversarial Networks Market by Deployment, 2024 - 2031, USD Million
- TABLE 557 Nigeria Generative Adversarial Networks Market by Type, 2020 - 2023, USD Million
- TABLE 558 Nigeria Generative Adversarial Networks Market by Type, 2024 - 2031, USD Million
- TABLE 559 Nigeria Generative Adversarial Networks Market by Industry Vertical, 2020 - 2023, USD Million
- TABLE 560 Nigeria Generative Adversarial Networks Market by Industry Vertical, 2024 - 2031, USD Million
- TABLE 561 Rest of LAMEA Generative Adversarial Networks Market, 2020 - 2023, USD Million
- TABLE 562 Rest of LAMEA Generative Adversarial Networks Market, 2024 - 2031, USD Million
- TABLE 563 Rest of LAMEA Generative Adversarial Networks Market by Technology, 2020 - 2023, USD Million
- TABLE 564 Rest of LAMEA Generative Adversarial Networks Market by Technology, 2024 - 2031, USD Million
- TABLE 565 Rest of LAMEA Generative Adversarial Networks Market by Application, 2020 - 2023, USD Million
- TABLE 566 Rest of LAMEA Generative Adversarial Networks Market by Application, 2024 - 2031, USD Million
- TABLE 567 Rest of LAMEA Generative Adversarial Networks Market by Deployment, 2020 - 2023, USD Million
- TABLE 568 Rest of LAMEA Generative Adversarial Networks Market by Deployment, 2024 - 2031, USD Million
- TABLE 569 Rest of LAMEA Generative Adversarial Networks Market by Type, 2020 - 2023, USD Million
- TABLE 570 Rest of LAMEA Generative Adversarial Networks Market by Type, 2024 - 2031, USD Million
- TABLE 571 Rest of LAMEA Generative Adversarial Networks Market by Industry Vertical, 2020 - 2023, USD Million
- TABLE 572 Rest of LAMEA Generative Adversarial Networks Market by Industry Vertical, 2024 - 2031, USD Million
- TABLE 573 Key Information - Amazon Web Services, Inc.
- TABLE 574 Key Information - Google LLC
- TABLE 575 Key Information - IBM Corporation
- TABLE 576 Key Information - Markovate Inc.
- TABLE 577 Key Information - Meta Platforms, Inc.
- TABLE 578 Key Information - Microsoft Corporation
- TABLE 579 Key Information - NVIDIA Corporation
- TABLE 580 Key Information - OpenAI, L.L.C.
- TABLE 581 Key Information - Stability AI Ltd.
- TABLE 582 Key Information - Synthesia Limited
LIST OF FIGURES
- FIG 1 Methodology for the research
- FIG 2 Global Generative Adversarial Networks Market, 2020 - 2031, USD Million
- FIG 3 Key Factors Impacting Generative Adversarial Networks Market
- FIG 4 KBV Cardinal Matrix
- FIG 5 Market Share Analysis, 2023
- FIG 6 Key Leading Strategies: Percentage Distribution (2020-2024)
- FIG 7 Key Strategic Move: (Product Launches and Product Expansions : 2021, OCT - 2025, Jan) Leading Players
- FIG 8 Porter's Five Forces Analysis - Generative Adversarial Networks Market
- FIG 9 Global Generative Adversarial Networks Market share by Technology, 2023
- FIG 10 Global Generative Adversarial Networks Market share by Technology, 2031
- FIG 11 Global Generative Adversarial Networks Market by Technology, 2020 - 2031, USD Million
- FIG 12 Global Generative Adversarial Networks Market share by Application, 2023
- FIG 13 Global Generative Adversarial Networks Market share by Application, 2031
- FIG 14 Global Generative Adversarial Networks Market by Application, 2020 - 2031, USD Million
- FIG 15 Global Generative Adversarial Networks Market share by Deployment, 2023
- FIG 16 Global Generative Adversarial Networks Market share by Deployment, 2031
- FIG 17 Global Generative Adversarial Networks Market by Deployment, 2020 - 2031, USD Million
- FIG 18 Global Generative Adversarial Networks Market share by Type, 2023
- FIG 19 Global Generative Adversarial Networks Market share by Type, 2031
- FIG 20 Global Generative Adversarial Networks Market by Type, 2020 - 2031, USD Million
- FIG 21 Global Generative Adversarial Networks Market share by Industry Vertical, 2023
- FIG 22 Global Generative Adversarial Networks Market share by Industry Vertical, 2031
- FIG 23 Global Generative Adversarial Networks Market by Industry Vertical, 2020 - 2031, USD Million
- FIG 24 Global Generative Adversarial Networks Market share by Region, 2023
- FIG 25 Global Generative Adversarial Networks Market share by Region, 2031
- FIG 26 Global Generative Adversarial Networks Market by Region, 2020 - 2031, USD Million
- FIG 27 SWOT Analysis: Amazon Web Services, Inc.
- FIG 28 SWOT Analysis: Google LLC
- FIG 29 SWOT Analysis: IBM Corporation
- FIG 30 SWOT Analysis: Markovate Inc.
- FIG 31 SWOT Analysis: Meta Platforms, Inc.
- FIG 32 Recent strategies and developments: MICROSOFT CORPORATION
- FIG 33 SWOT Analysis: Microsoft Corporation
- FIG 34 Recent strategies and developments: NVIDIA Corporation
- FIG 35 SWOT Analysis: NVIDIA Corporation
- FIG 36 SWOT Analysis: OpenAI, L.L.C.
The Global Generative Adversarial Networks Market size is expected to reach $47.84 billion by 2031, rising at a market growth of 36.8% CAGR during the forecast period.
The text generation segment is being driven by the increasing demand for automated content creation and the increasing adoption of natural language processing (NLP) technologies. Businesses like marketing, customer service, and publishing use GANs to generate personalized content, automate customer interactions, and streamline content production. Thus, the text generation segment recorded 23% revenue share in the market in 2023. The rise of chatbots, virtual assistants, and AI-driven writing tools has further amplified the need for text generation solutions. Language translation, sentiment analysis, and code generation applications also contribute to the growing adoption of GANs in this segment.
The major strategies followed by the market participants are Product Launches as the key developmental strategy to keep pace with the changing demands of end users. For instance, In January, 2025, Microsoft Corporation unveiled the integration of advanced GAN models into its Azure AI platform, enhancing capabilities for synthetic data generation and AI-driven media creation. The new models allow businesses to generate high-quality, AI-powered images, videos, and text while maintaining accuracy and realism. Additionally, In December, 2024, Amazon Web Services, Inc. unveiled new tools to help businesses embrace generative AI, focusing on making it easy to build generative AI applications with security and privacy built in. These tools provide enterprises with scalable, cloud-based AI solutions, enabling them to generate synthetic data, enhance media content, and automate workflows efficiently.
Based on the Analysis presented in the KBV Cardinal matrix; Google, Inc., Microsoft Corporation and Amazon Web Services, Inc. are the forerunners in the Generative Adversarial Networks Market. In May, 2024, Google LLC unveiled a new technique to tag text as AI-generated without modifying its content. This functionality has been added to Google DeepMind's SynthID tool, previously designed to detect AI-generated images and audio. Companies such as NVIDIA Corporation, IBM Corporation and OpenAI, L.L.C. are some of the key innovators in Generative Adversarial Networks Market.
Market Growth Factors
Beyond gaming and VR, GANs also expand into Augmented Reality (AR) and Mixed Reality (MR), enhancing experiences in education, real estate, and healthcare. In AR gaming, for instance, GANs can generate realistic overlays that blend virtual elements seamlessly with the real world, improving user engagement. The ability of GANs to create adaptive avatars, personalized game assets, and lifelike environments is pushing the boundaries of interactive entertainment. Therefore, as GAN technology continues to advance, it is set to further revolutionize gaming and VR, offering richer, more immersive experiences to users across the globe.
GANs enhance dynamic ads personalization, where ad creatives are adjusted in real-time based on user interactions. For instance, an e-commerce platform can use GANs to dynamically alter product recommendations, banners, or promotional images shown to each user, depending on their browsing history and preferences. This level of personalization significantly increases user engagement and improves the chances of conversion. This enhances the user experience and fosters a stronger emotional connection with the brand. Thus, as technology advances, the role of GANs in personalized marketing is expected to expand even further.
Market Restraining Factors
Cloud-based solutions offering scalable computational resources have emerged as a potential remedy to this issue, allowing businesses to access powerful hardware without significant upfront investment. However, these services can become costly, particularly for projects requiring prolonged training sessions or extensive experimentation. As a result, the high computational costs remain a critical challenge for the market.
Technology Outlook
Based on technology, the market is classified into conditional GANs, traditional GANs, and cycle GANs. The conditional GANs segment garnered 42% revenue share in the market in 2023. The growth of the conditional GANs segment is primarily driven by their ability to generate controlled and targeted outputs based on specific input conditions or labels. This flexibility has made conditional GANs highly valuable across industries that require precise data generation, such as healthcare, retail, and entertainment. In healthcare, cGANs create synthetic medical images with specific pathologies, aiding diagnostics and research. In the fashion and e-commerce sectors, they enable personalized product recommendations and virtual try-ons, enhancing customer engagement.
Application Outlook
On the basis of application, the market is divided into image generation, text generation, video generation, audio & speech generation, and 3D object generation. The video generation segment witnessed 21% revenue share in the market in 2023. The video generation segment is experiencing strong growth due to the rising demand for synthetic video content in gaming, film production, virtual reality (VR), and augmented reality (AR) applications. GANs enable the creation of realistic video sequences, special effects, and deepfake content, offering innovative tools for filmmakers, game developers, and content creators. The increasing popularity of immersive experiences in gaming and entertainment, coupled with advancements in video editing and enhancement tools, is driving the adoption of GANs in video generation.
Deployment Outlook
By deployment, the market is bifurcated into cloud and on-premises. The cloud segment garnered 58% revenue share in the market in 2023. Cloud platforms allow businesses to access high-performance computing resources without significant upfront investments in infrastructure. This is particularly valuable for training complex GAN models requiring substantial computational power and storage. Additionally, cloud-based GAN solutions offer the advantage of easy integration, remote accessibility, and collaboration among geographically dispersed teams, making them ideal for industries such as media, entertainment, healthcare, and retail. The growing popularity of cloud service providers like AWS, Google Cloud, and Microsoft Azure, which offer specialized machine learning and AI services, further fuels the demand for cloud-based GAN deployments.
Type Outlook
Based on type, the market is segmented into image-based GANs, video-based GANs, text-based GANs, and audio-based GANs. The video-based GANs segment recorded 27% revenue share in the market in 2023. These GANs are used in film production, gaming, virtual reality (VR), and augmented reality (AR) applications to create lifelike video sequences, special effects, and immersive environments. Video-based GANs are crucial in deepfake creation, editing, and content enhancement. The growing popularity of VR/AR experiences and the demand for dynamic social media and advertising content have significantly contributed to the segment's growth.
Industry Vertical Outlook
On the basis of industry vertical, the market is segmented into media & entertainment, healthcare, retail & e-commerce, finance & banking, automotive, and others. The media & entertainment segment witnessed 21% revenue share in the market in 2023. The media and entertainment sector is predominantly driven by the growing demand for visually appealing, high-quality content in digital media, gaming, and films. GANs enable the creation of hyper-realistic visual effects, animations, and characters, reducing production costs and timelines while enhancing creativity. The rise of deepfake technology, virtual influencers, and augmented reality (AR) content has further boosted GAN adoption in this sector.
Regional Outlook
Region-wise, the market is analyzed across North America, Europe, Asia Pacific, and LAMEA. The North America segment acquired 39% revenue share in the market in 2023. The region's sophisticated technological infrastructure, strong R&D investments, and the presence of major tech giants and startups specializing in artificial intelligence are the primary factors driving market growth in North America. The widespread adoption of GANs across industries such as media & entertainment, healthcare, and finance has fueled market expansion. North America's vibrant entertainment sector leverages GANs for content creation, visual effects, and gaming, while the healthcare industry uses the technology for medical imaging and diagnostics.
Recent Strategies Deployed in the Market
- Nov-2024: NVIDIA Corporation unveiled a new suite of GAN-based tools aimed at accelerating AI research and development, focusing on applications in computer graphics and deep learning. The new tools enhance NVIDIA's existing AI ecosystem, particularly benefiting industries such as gaming, film production, and virtual reality. By improving the efficiency and realism of AI-generated images and animations, NVIDIA continues to drive innovation in GAN-based visual computing technologies.
- Oct-2024: IBM Corporation unveiled Granite 3.0, a state-of-the-art enterprise AI model series emphasizing performance, safety, and efficiency. Featuring instruction-tuned LLMs, MoE models, and speculative decoding, it ensures transparency and trust. Available on IBM watsonx and partner platforms, it supports enterprise AI applications, including RAG, cybersecurity, and tool-based automation.
- Oct-2024: OpenAI, L.L.C. unveiled an updated version of its DALL*E model, improving image generation capabilities and expanding its application in creative industries. The latest version includes enhanced resolution, better contextual understanding, and improved fine-tuning features, making AI-generated artwork more realistic and customizable. With this advancement, OpenAI is strengthening its role in the AI-powered creative sector, catering to digital artists, marketers, and media professionals.
- Jun-2024: Synthesia Limited unveiled a new feature allowing users to create multilingual AI-generated videos, broadening its reach in global markets. This feature enables businesses to scale their video content production effortlessly, offering personalized, localized content for international audiences. By enhancing its AI-driven video synthesis capabilities, Synthesia is meeting the growing demand for automated content creation in industries such as marketing, corporate training, and e-learning.
- May-2024: Microsoft Corporation announced the partnership with Truecaller, a called ID and Caller Blocking Application to integrate Microsoft Azure AI Speech's Personal Voice Technology that allows Truecaller Assistance users to create a digital version of their voice for the Assistant.
List of Key Companies Profiled
- Amazon Web Services, Inc. (Amazon.com, Inc.)
- Google LLC (Alphabet Inc.)
- IBM Corporation
- Markovate Inc.
- Meta Platforms, Inc.
- Microsoft Corporation
- NVIDIA Corporation
- OpenAI, L.L.C.
- Stability AI Ltd.
- Synthesia Limited
Global Generative Adversarial Networks Market Report Segmentation
By Technology
- Conditional GANs
- Traditional GANs
- Cycle GANs
By Application
- Image Generation
- Text Generation
- Video Generation
- Audio & Speech Generation
- 3D Object Generation
By Deployment
- Cloud
- On-Premises
By Type
- Image-Based GANs
- Video-Based GANs
- Text-Based GANs
- Audio-Based GANs
By Industry Vertical
- Media & Entertainment
- Healthcare
- Retail & E-commerce
- Finance & Banking
- Automotive
- Other Industry Vertical
By Geography
- North America
- US
- Canada
- Mexico
- Rest of North America
- Europe
- Germany
- UK
- France
- Russia
- Spain
- Italy
- Rest of Europe
- Asia Pacific
- China
- Japan
- India
- South Korea
- Singapore
- Malaysia
- Rest of Asia Pacific
- LAMEA
- Brazil
- Argentina
- UAE
- Saudi Arabia
- South Africa
- Nigeria
- Rest of LAMEA
Table of Contents
Chapter 1. Market Scope & Methodology
- 1.1 Market Definition
- 1.2 Objectives
- 1.3 Market Scope
- 1.4 Segmentation
- 1.4.1 Global Generative Adversarial Networks Market, by Technology
- 1.4.2 Global Generative Adversarial Networks Market, by Application
- 1.4.3 Global Generative Adversarial Networks Market, by Deployment
- 1.4.4 Global Generative Adversarial Networks Market, by Type
- 1.4.5 Global Generative Adversarial Networks Market, by Industry Vertical
- 1.4.6 Global Generative Adversarial Networks Market, by Geography
- 1.5 Methodology for the research
Chapter 2. Market at a Glance
- 2.1 Key Highlights
Chapter 3. Market Overview
- 3.1 Introduction
- 3.1.1 Overview
- 3.1.1.1 Market Composition and Scenario
- 3.1.1 Overview
- 3.2 Key Factors Impacting the Market
- 3.2.1 Market Drivers
- 3.2.2 Market Restraints
- 3.2.3 Market Opportunities
- 3.2.4 Market Challenges
Chapter 4. Competition Analysis - Global
- 4.1 KBV Cardinal Matrix
- 4.2 Recent Industry Wide Strategic Developments
- 4.2.1 Partnerships, Collaborations and Agreements
- 4.2.2 Product Launches and Product Expansions
- 4.3 Market Share Analysis, 2023
- 4.4 Top Winning Strategies
- 4.4.1 Key Leading Strategies: Percentage Distribution (2020-2024)
- 4.4.2 Key Strategic Move: (Product Launches and Product Expansions: 2021, Oct - 2025, Jan) Leading Players
- 4.5 Porter Five Forces Analysis
Chapter 5. Global Generative Adversarial Networks Market by Technology
- 5.1 Global Conditional GANs Market by Region
- 5.2 Global Traditional GANs Market by Region
- 5.3 Global Cycle GANs Market by Region
Chapter 6. Global Generative Adversarial Networks Market by Application
- 6.1 Global Image Generation Market by Region
- 6.2 Global Text Generation Market by Region
- 6.3 Global Video Generation Market by Region
- 6.4 Global Audio & Speech Generation Market by Region
- 6.5 Global 3D Object Generation Market by Region
Chapter 7. Global Generative Adversarial Networks Market by Deployment
- 7.1 Global Cloud Market by Region
- 7.2 Global On-Premises Market by Region
Chapter 8. Global Generative Adversarial Networks Market by Type
- 8.1 Global Image-Based GANs Market by Region
- 8.2 Global Video-Based GANs Market by Region
- 8.3 Global Text-Based GANs Market by Region
- 8.4 Global Audio-Based GANs Market by Region
Chapter 9. Global Generative Adversarial Networks Market by Industry Vertical
- 9.1 Global Media & Entertainment Market by Region
- 9.2 Global Healthcare Market by Region
- 9.3 Global Retail & E-commerce Market by Region
- 9.4 Global Finance & Banking Market by Region
- 9.5 Global Automotive Market by Region
- 9.6 Global Other Industry Vertical Market by Region
Chapter 10. Global Generative Adversarial Networks Market by Region
- 10.1 North America Generative Adversarial Networks Market
- 10.1.1 North America Generative Adversarial Networks Market by Technology
- 10.1.1.1 North America Conditional GANs Market by Country
- 10.1.1.2 North America Traditional GANs Market by Country
- 10.1.1.3 North America Cycle GANs Market by Country
- 10.1.2 North America Generative Adversarial Networks Market by Application
- 10.1.2.1 North America Image Generation Market by Region
- 10.1.2.2 North America Text Generation Market by Region
- 10.1.2.3 North America Video Generation Market by Region
- 10.1.2.4 North America Audio & Speech Generation Market by Region
- 10.1.2.5 North America 3D Object Generation Market by Region
- 10.1.3 North America Generative Adversarial Networks Market by Deployment
- 10.1.3.1 North America Cloud Market by Country
- 10.1.3.2 North America On-Premises Market by Country
- 10.1.4 North America Generative Adversarial Networks Market by Type
- 10.1.4.1 North America Image-Based GANs Market by Country
- 10.1.4.2 North America Video-Based GANs Market by Country
- 10.1.4.3 North America Text-Based GANs Market by Country
- 10.1.4.4 North America Audio-Based GANs Market by Country
- 10.1.5 North America Generative Adversarial Networks Market by Industry Vertical
- 10.1.5.1 North America Media & Entertainment Market by Country
- 10.1.5.2 North America Healthcare Market by Country
- 10.1.5.3 North America Retail & E-commerce Market by Country
- 10.1.5.4 North America Finance & Banking Market by Country
- 10.1.5.5 North America Automotive Market by Country
- 10.1.5.6 North America Other Industry Vertical Market by Country
- 10.1.6 North America Generative Adversarial Networks Market by Country
- 10.1.6.1 US Generative Adversarial Networks Market
- 10.1.6.1.1 US Generative Adversarial Networks Market by Technology
- 10.1.6.1.2 US Generative Adversarial Networks Market by Application
- 10.1.6.1.3 US Generative Adversarial Networks Market by Deployment
- 10.1.6.1.4 US Generative Adversarial Networks Market by Type
- 10.1.6.1.5 US Generative Adversarial Networks Market by Industry Vertical
- 10.1.6.2 Canada Generative Adversarial Networks Market
- 10.1.6.2.1 Canada Generative Adversarial Networks Market by Technology
- 10.1.6.2.2 Canada Generative Adversarial Networks Market by Application
- 10.1.6.2.3 Canada Generative Adversarial Networks Market by Deployment
- 10.1.6.2.4 Canada Generative Adversarial Networks Market by Type
- 10.1.6.2.5 Canada Generative Adversarial Networks Market by Industry Vertical
- 10.1.6.3 Mexico Generative Adversarial Networks Market
- 10.1.6.3.1 Mexico Generative Adversarial Networks Market by Technology
- 10.1.6.3.2 Mexico Generative Adversarial Networks Market by Application
- 10.1.6.3.3 Mexico Generative Adversarial Networks Market by Deployment
- 10.1.6.3.4 Mexico Generative Adversarial Networks Market by Type
- 10.1.6.3.5 Mexico Generative Adversarial Networks Market by Industry Vertical
- 10.1.6.4 Rest of North America Generative Adversarial Networks Market
- 10.1.6.4.1 Rest of North America Generative Adversarial Networks Market by Technology
- 10.1.6.4.2 Rest of North America Generative Adversarial Networks Market by Application
- 10.1.6.4.3 Rest of North America Generative Adversarial Networks Market by Deployment
- 10.1.6.4.4 Rest of North America Generative Adversarial Networks Market by Type
- 10.1.6.4.5 Rest of North America Generative Adversarial Networks Market by Industry Vertical
- 10.1.6.1 US Generative Adversarial Networks Market
- 10.1.1 North America Generative Adversarial Networks Market by Technology
- 10.2 Europe Generative Adversarial Networks Market
- 10.2.1 Europe Generative Adversarial Networks Market by Technology
- 10.2.1.1 Europe Conditional GANs Market by Country
- 10.2.1.2 Europe Traditional GANs Market by Country
- 10.2.1.3 Europe Cycle GANs Market by Country
- 10.2.2 Europe Generative Adversarial Networks Market by Application
- 10.2.2.1 Europe Image Generation Market by Country
- 10.2.2.2 Europe Text Generation Market by Country
- 10.2.2.3 Europe Video Generation Market by Country
- 10.2.2.4 Europe Audio & Speech Generation Market by Country
- 10.2.2.5 Europe 3D Object Generation Market by Country
- 10.2.3 Europe Generative Adversarial Networks Market by Deployment
- 10.2.3.1 Europe Cloud Market by Country
- 10.2.3.2 Europe On-Premises Market by Country
- 10.2.4 Europe Generative Adversarial Networks Market by Type
- 10.2.4.1 Europe Image-Based GANs Market by Country
- 10.2.4.2 Europe Video-Based GANs Market by Country
- 10.2.4.3 Europe Text-Based GANs Market by Country
- 10.2.4.4 Europe Audio-Based GANs Market by Country
- 10.2.5 Europe Generative Adversarial Networks Market by Industry Vertical
- 10.2.5.1 Europe Media & Entertainment Market by Country
- 10.2.5.2 Europe Healthcare Market by Country
- 10.2.5.3 Europe Retail & E-commerce Market by Country
- 10.2.5.4 Europe Finance & Banking Market by Country
- 10.2.5.5 Europe Automotive Market by Country
- 10.2.5.6 Europe Other Industry Vertical Market by Country
- 10.2.6 Europe Generative Adversarial Networks Market by Country
- 10.2.6.1 Germany Generative Adversarial Networks Market
- 10.2.6.1.1 Germany Generative Adversarial Networks Market by Technology
- 10.2.6.1.2 Germany Generative Adversarial Networks Market by Application
- 10.2.6.1.3 Germany Generative Adversarial Networks Market by Deployment
- 10.2.6.1.4 Germany Generative Adversarial Networks Market by Type
- 10.2.6.1.5 Germany Generative Adversarial Networks Market by Industry Vertical
- 10.2.6.2 UK Generative Adversarial Networks Market
- 10.2.6.2.1 UK Generative Adversarial Networks Market by Technology
- 10.2.6.2.2 UK Generative Adversarial Networks Market by Application
- 10.2.6.2.3 UK Generative Adversarial Networks Market by Deployment
- 10.2.6.2.4 UK Generative Adversarial Networks Market by Type
- 10.2.6.2.5 UK Generative Adversarial Networks Market by Industry Vertical
- 10.2.6.3 France Generative Adversarial Networks Market
- 10.2.6.3.1 France Generative Adversarial Networks Market by Technology
- 10.2.6.3.2 France Generative Adversarial Networks Market by Application
- 10.2.6.3.3 France Generative Adversarial Networks Market by Deployment
- 10.2.6.3.4 France Generative Adversarial Networks Market by Type
- 10.2.6.3.5 France Generative Adversarial Networks Market by Industry Vertical
- 10.2.6.4 Russia Generative Adversarial Networks Market
- 10.2.6.4.1 Russia Generative Adversarial Networks Market by Technology
- 10.2.6.4.2 Russia Generative Adversarial Networks Market by Application
- 10.2.6.4.3 Russia Generative Adversarial Networks Market by Deployment
- 10.2.6.4.4 Russia Generative Adversarial Networks Market by Type
- 10.2.6.4.5 Russia Generative Adversarial Networks Market by Industry Vertical
- 10.2.6.5 Spain Generative Adversarial Networks Market
- 10.2.6.5.1 Spain Generative Adversarial Networks Market by Technology
- 10.2.6.5.2 Spain Generative Adversarial Networks Market by Application
- 10.2.6.5.3 Spain Generative Adversarial Networks Market by Deployment
- 10.2.6.5.4 Spain Generative Adversarial Networks Market by Type
- 10.2.6.5.5 Spain Generative Adversarial Networks Market by Industry Vertical
- 10.2.6.6 Italy Generative Adversarial Networks Market
- 10.2.6.6.1 Italy Generative Adversarial Networks Market by Technology
- 10.2.6.6.2 Italy Generative Adversarial Networks Market by Application
- 10.2.6.6.3 Italy Generative Adversarial Networks Market by Deployment
- 10.2.6.6.4 Italy Generative Adversarial Networks Market by Type
- 10.2.6.6.5 Italy Generative Adversarial Networks Market by Industry Vertical
- 10.2.6.7 Rest of Europe Generative Adversarial Networks Market
- 10.2.6.7.1 Rest of Europe Generative Adversarial Networks Market by Technology
- 10.2.6.7.2 Rest of Europe Generative Adversarial Networks Market by Application
- 10.2.6.7.3 Rest of Europe Generative Adversarial Networks Market by Deployment
- 10.2.6.7.4 Rest of Europe Generative Adversarial Networks Market by Type
- 10.2.6.7.5 Rest of Europe Generative Adversarial Networks Market by Industry Vertical
- 10.2.6.1 Germany Generative Adversarial Networks Market
- 10.2.1 Europe Generative Adversarial Networks Market by Technology
- 10.3 Asia Pacific Generative Adversarial Networks Market
- 10.3.1 Asia Pacific Generative Adversarial Networks Market by Technology
- 10.3.1.1 Asia Pacific Conditional GANs Market by Country
- 10.3.1.2 Asia Pacific Traditional GANs Market by Country
- 10.3.1.3 Asia Pacific Cycle GANs Market by Country
- 10.3.2 Asia Pacific Generative Adversarial Networks Market by Application
- 10.3.2.1 Asia Pacific Image Generation Market by Country
- 10.3.2.2 Asia Pacific Text Generation Market by Country
- 10.3.2.3 Asia Pacific Video Generation Market by Country
- 10.3.2.4 Asia Pacific Audio & Speech Generation Market by Country
- 10.3.2.5 Asia Pacific 3D Object Generation Market by Country
- 10.3.3 Asia Pacific Generative Adversarial Networks Market by Deployment
- 10.3.3.1 Asia Pacific Cloud Market by Country
- 10.3.3.2 Asia Pacific On-Premises Market by Country
- 10.3.4 Asia Pacific Generative Adversarial Networks Market by Type
- 10.3.4.1 Asia Pacific Image-Based GANs Market by Country
- 10.3.4.2 Asia Pacific Video-Based GANs Market by Country
- 10.3.4.3 Asia Pacific Text-Based GANs Market by Country
- 10.3.4.4 Asia Pacific Audio-Based GANs Market by Country
- 10.3.5 Asia Pacific Generative Adversarial Networks Market by Industry Vertical
- 10.3.5.1 Asia Pacific Media & Entertainment Market by Country
- 10.3.5.2 Asia Pacific Healthcare Market by Country
- 10.3.5.3 Asia Pacific Retail & E-commerce Market by Country
- 10.3.5.4 Asia Pacific Finance & Banking Market by Country
- 10.3.5.5 Asia Pacific Automotive Market by Country
- 10.3.5.6 Asia Pacific Other Industry Vertical Market by Country
- 10.3.6 Asia Pacific Generative Adversarial Networks Market by Country
- 10.3.6.1 China Generative Adversarial Networks Market
- 10.3.6.1.1 China Generative Adversarial Networks Market by Technology
- 10.3.6.1.2 China Generative Adversarial Networks Market by Application
- 10.3.6.1.3 China Generative Adversarial Networks Market by Deployment
- 10.3.6.1.4 China Generative Adversarial Networks Market by Type
- 10.3.6.1.5 China Generative Adversarial Networks Market by Industry Vertical
- 10.3.6.2 Japan Generative Adversarial Networks Market
- 10.3.6.2.1 Japan Generative Adversarial Networks Market by Technology
- 10.3.6.2.2 Japan Generative Adversarial Networks Market by Application
- 10.3.6.2.3 Japan Generative Adversarial Networks Market by Deployment
- 10.3.6.2.4 Japan Generative Adversarial Networks Market by Type
- 10.3.6.2.5 Japan Generative Adversarial Networks Market by Industry Vertical
- 10.3.6.3 India Generative Adversarial Networks Market
- 10.3.6.3.1 India Generative Adversarial Networks Market by Technology
- 10.3.6.3.2 India Generative Adversarial Networks Market by Application
- 10.3.6.3.3 India Generative Adversarial Networks Market by Deployment
- 10.3.6.3.4 India Generative Adversarial Networks Market by Type
- 10.3.6.3.5 India Generative Adversarial Networks Market by Industry Vertical
- 10.3.6.4 South Korea Generative Adversarial Networks Market
- 10.3.6.4.1 South Korea Generative Adversarial Networks Market by Technology
- 10.3.6.4.2 South Korea Generative Adversarial Networks Market by Application
- 10.3.6.4.3 South Korea Generative Adversarial Networks Market by Deployment
- 10.3.6.4.4 South Korea Generative Adversarial Networks Market by Type
- 10.3.6.4.5 South Korea Generative Adversarial Networks Market by Industry Vertical
- 10.3.6.5 Singapore Generative Adversarial Networks Market
- 10.3.6.5.1 Singapore Generative Adversarial Networks Market by Technology
- 10.3.6.5.2 Singapore Generative Adversarial Networks Market by Application
- 10.3.6.5.3 Singapore Generative Adversarial Networks Market by Deployment
- 10.3.6.5.4 Singapore Generative Adversarial Networks Market by Type
- 10.3.6.5.5 Singapore Generative Adversarial Networks Market by Industry Vertical
- 10.3.6.6 Malaysia Generative Adversarial Networks Market
- 10.3.6.6.1 Malaysia Generative Adversarial Networks Market by Technology
- 10.3.6.6.2 Malaysia Generative Adversarial Networks Market by Application
- 10.3.6.6.3 Malaysia Generative Adversarial Networks Market by Deployment
- 10.3.6.6.4 Malaysia Generative Adversarial Networks Market by Type
- 10.3.6.6.5 Malaysia Generative Adversarial Networks Market by Industry Vertical
- 10.3.6.7 Rest of Asia Pacific Generative Adversarial Networks Market
- 10.3.6.7.1 Rest of Asia Pacific Generative Adversarial Networks Market by Technology
- 10.3.6.7.2 Rest of Asia Pacific Generative Adversarial Networks Market by Application
- 10.3.6.7.3 Rest of Asia Pacific Generative Adversarial Networks Market by Deployment
- 10.3.6.7.4 Rest of Asia Pacific Generative Adversarial Networks Market by Type
- 10.3.6.7.5 Rest of Asia Pacific Generative Adversarial Networks Market by Industry Vertical
- 10.3.6.1 China Generative Adversarial Networks Market
- 10.3.1 Asia Pacific Generative Adversarial Networks Market by Technology
- 10.4 LAMEA Generative Adversarial Networks Market
- 10.4.1 LAMEA Generative Adversarial Networks Market by Technology
- 10.4.1.1 LAMEA Conditional GANs Market by Country
- 10.4.1.2 LAMEA Traditional GANs Market by Country
- 10.4.1.3 LAMEA Cycle GANs Market by Country
- 10.4.2 LAMEA Generative Adversarial Networks Market by Application
- 10.4.2.1 LAMEA Image Generation Market by Country
- 10.4.2.2 LAMEA Text Generation Market by Country
- 10.4.2.3 LAMEA Video Generation Market by Country
- 10.4.2.4 LAMEA Audio & Speech Generation Market by Country
- 10.4.2.5 LAMEA 3D Object Generation Market by Country
- 10.4.3 LAMEA Generative Adversarial Networks Market by Deployment
- 10.4.3.1 LAMEA Cloud Market by Country
- 10.4.3.2 LAMEA On-Premises Market by Country
- 10.4.4 LAMEA Generative Adversarial Networks Market by Type
- 10.4.4.1 LAMEA Image-Based GANs Market by Country
- 10.4.4.2 LAMEA Video-Based GANs Market by Country
- 10.4.4.3 LAMEA Text-Based GANs Market by Country
- 10.4.4.4 LAMEA Audio-Based GANs Market by Country
- 10.4.5 LAMEA Generative Adversarial Networks Market by Industry Vertical
- 10.4.5.1 LAMEA Media & Entertainment Market by Country
- 10.4.5.2 LAMEA Healthcare Market by Country
- 10.4.5.3 LAMEA Retail & E-commerce Market by Country
- 10.4.5.4 LAMEA Finance & Banking Market by Country
- 10.4.5.5 LAMEA Automotive Market by Country
- 10.4.5.6 LAMEA Other Industry Vertical Market by Country
- 10.4.6 LAMEA Generative Adversarial Networks Market by Country
- 10.4.6.1 Brazil Generative Adversarial Networks Market
- 10.4.6.1.1 Brazil Generative Adversarial Networks Market by Technology
- 10.4.6.1.2 Brazil Generative Adversarial Networks Market by Application
- 10.4.6.1.3 Brazil Generative Adversarial Networks Market by Deployment
- 10.4.6.1.4 Brazil Generative Adversarial Networks Market by Type
- 10.4.6.1.5 Brazil Generative Adversarial Networks Market by Industry Vertical
- 10.4.6.2 Argentina Generative Adversarial Networks Market
- 10.4.6.2.1 Argentina Generative Adversarial Networks Market by Technology
- 10.4.6.2.2 Argentina Generative Adversarial Networks Market by Application
- 10.4.6.2.3 Argentina Generative Adversarial Networks Market by Deployment
- 10.4.6.2.4 Argentina Generative Adversarial Networks Market by Type
- 10.4.6.2.5 Argentina Generative Adversarial Networks Market by Industry Vertical
- 10.4.6.3 UAE Generative Adversarial Networks Market
- 10.4.6.3.1 UAE Generative Adversarial Networks Market by Technology
- 10.4.6.3.2 UAE Generative Adversarial Networks Market by Application
- 10.4.6.3.3 UAE Generative Adversarial Networks Market by Deployment
- 10.4.6.3.4 UAE Generative Adversarial Networks Market by Type
- 10.4.6.3.5 UAE Generative Adversarial Networks Market by Industry Vertical
- 10.4.6.4 Saudi Arabia Generative Adversarial Networks Market
- 10.4.6.4.1 Saudi Arabia Generative Adversarial Networks Market by Technology
- 10.4.6.4.2 Saudi Arabia Generative Adversarial Networks Market by Application
- 10.4.6.4.3 Saudi Arabia Generative Adversarial Networks Market by Deployment
- 10.4.6.4.4 Saudi Arabia Generative Adversarial Networks Market by Type
- 10.4.6.4.5 Saudi Arabia Generative Adversarial Networks Market by Industry Vertical
- 10.4.6.5 South Africa Generative Adversarial Networks Market
- 10.4.6.5.1 South Africa Generative Adversarial Networks Market by Technology
- 10.4.6.5.2 South Africa Generative Adversarial Networks Market by Application
- 10.4.6.5.3 South Africa Generative Adversarial Networks Market by Deployment
- 10.4.6.5.4 South Africa Generative Adversarial Networks Market by Type
- 10.4.6.5.5 South Africa Generative Adversarial Networks Market by Industry Vertical
- 10.4.6.6 Nigeria Generative Adversarial Networks Market
- 10.4.6.6.1 Nigeria Generative Adversarial Networks Market by Technology
- 10.4.6.6.2 Nigeria Generative Adversarial Networks Market by Application
- 10.4.6.6.3 Nigeria Generative Adversarial Networks Market by Deployment
- 10.4.6.6.4 Nigeria Generative Adversarial Networks Market by Type
- 10.4.6.6.5 Nigeria Generative Adversarial Networks Market by Industry Vertical
- 10.4.6.7 Rest of LAMEA Generative Adversarial Networks Market
- 10.4.6.7.1 Rest of LAMEA Generative Adversarial Networks Market by Technology
- 10.4.6.7.2 Rest of LAMEA Generative Adversarial Networks Market by Application
- 10.4.6.7.3 Rest of LAMEA Generative Adversarial Networks Market by Deployment
- 10.4.6.7.4 Rest of LAMEA Generative Adversarial Networks Market by Type
- 10.4.6.7.5 Rest of LAMEA Generative Adversarial Networks Market by Industry Vertical
- 10.4.6.1 Brazil Generative Adversarial Networks Market
- 10.4.1 LAMEA Generative Adversarial Networks Market by Technology
Chapter 11. Company Profiles
- 11.1 Amazon Web Services, Inc. (Amazon.com, Inc.)
- 11.1.1 Company Overview
- 11.1.2 Financial Analysis
- 11.1.3 Segmental and Regional Analysis
- 11.1.4 Recent strategies and developments:
- 11.1.4.1 Product Launches and Product Expansions:
- 11.1.5 SWOT Analysis
- 11.2 Google LLC (Alphabet Inc.)
- 11.2.1 Company Overview
- 11.2.2 Financial Analysis
- 11.2.3 Segmental and Regional Analysis
- 11.2.4 Research & Development Expense
- 11.2.5 Recent strategies and developments:
- 11.2.5.1 Product Launches and Product Expansions:
- 11.2.6 SWOT Analysis
- 11.3 IBM Corporation
- 11.3.1 Company Overview
- 11.3.2 Financial Analysis
- 11.3.3 Regional & Segmental Analysis
- 11.3.4 Research & Development Expenses
- 11.3.5 Recent strategies and developments:
- 11.3.5.1 Product Launches and Product Expansions:
- 11.3.6 SWOT Analysis
- 11.4 Markovate Inc.
- 11.4.1 Company Overview
- 11.4.2 SWOT Analysis
- 11.5 Meta Platforms, Inc.
- 11.5.1 Company Overview
- 11.5.2 Financial Analysis
- 11.5.3 Segment and Regional Analysis
- 11.5.4 Research & Development Expense
- 11.5.5 SWOT Analysis
- 11.6 Microsoft Corporation
- 11.6.1 Company Overview
- 11.6.2 Financial Analysis
- 11.6.3 Segmental and Regional Analysis
- 11.6.4 Research & Development Expenses
- 11.6.5 Recent strategies and developments:
- 11.6.5.1 Partnerships, Collaborations, and Agreements:
- 11.6.5.2 Product Launches and Product Expansions:
- 11.6.6 SWOT Analysis
- 11.7 NVIDIA Corporation
- 11.7.1 Company Overview
- 11.7.2 Financial Analysis
- 11.7.3 Segmental and Regional Analysis
- 11.7.4 Research & Development Expenses
- 11.7.5 Recent strategies and developments:
- 11.7.5.1 Partnerships, Collaborations, and Agreements:
- 11.7.5.2 Product Launches and Product Expansions:
- 11.7.6 SWOT Analysis
- 11.8 OpenAI, L.L.C.
- 11.8.1 Company Overview
- 11.8.2 Recent strategies and developments:
- 11.8.2.1 Product Launches and Product Expansions:
- 11.8.3 SWOT Analysis
- 11.9 Stability AI Ltd.
- 11.9.1 Company Overview
- 11.10. Synthesia Limited
- 11.10.1 Company Overview
- 11.10.2 Recent strategies and developments:
- 11.10.2.1 Product Launches and Product Expansions:
