|
|
市場調査レポート
商品コード
1635200
加熱式タバコの世界市場規模、シェア、動向分析レポート:流通チャネル別、コンポーネント別、地域別、展望と予測、2024年~2031年Global Heat-Not-Burn Market Size, Share & Trends Analysis Report By Distribution Channel, By Component (Sticks, Loose-leaf, Devices, Capsules, Vaporizers, and Other Component), By Regional Outlook and Forecast, 2024 - 2031 |
||||||

|
|||||||
|
|||||||


| 加熱式タバコの世界市場規模、シェア、動向分析レポート:流通チャネル別、コンポーネント別、地域別、展望と予測、2024年~2031年 |
|
出版日: 2024年12月31日
発行: KBV Research
ページ情報: 英文 218 Pages
納期: 即納可能
|

全表示
- 概要
- 図表
- 目次
世界の加熱式タバコの市場規模は、予測期間中に30.9%のCAGRで市場成長し、2031年までに1,319億6,000万米ドルに達すると予想されています。
さらに、初期のHNBデバイスは、加熱の不安定さ、バッテリー寿命の短さ、ユーザーインターフェイスの複雑さなどの課題に直面しており、その魅力は限定的でした。しかし、現代のHNB製品は最先端の技術を取り入れることでこれらの障壁を克服し、より効率的で使いやすく、信頼性の高い製品となっています。最も重要な進歩の1つは、精密加熱メカニズムの開発です。したがって、この継続的な進化は、市場の将来を形作る上での技術の重要な役割を強調しています。
しかし、世界中の政府はタバコ製品の公衆衛生への影響にますます注目しており、HNBデバイスに対する規制が厳しくなっています。これらの規制は、従来のタバコに適用される規制と同等か、それ以上に厳しい場合がよくあります。多くの当局は、製品の市場投入を許可する前に、パッケージに広範な健康警告を記載すること、厳しい広告制限を課すこと、費用のかかる健康および安全性の研究を義務付けています。したがって、これらの要因は市場の成長を妨げる可能性があります。
流通チャネルの展望
流通チャネルに基づいて、市場はオンラインと小売店に分かれています。オンラインセグメントは、2023年に市場で22%の収益シェアを獲得しました。顧客は、自宅でくつろぎながら、幅広いHNBアイテムを閲覧し、コストを評価し、レビューを読むことができます。詳細な製品説明とビデオデモが利用できるため、情報に基づいた購入決定をさらに行うことができます。
コンポーネントの展望
コンポーネント別に見ると、市場はスティック、ルーズリーフ、デバイス、カプセル、気化器、その他に分類されます。ルーズリーフセグメントは、2023年に市場で24%の収益シェアを獲得しました。ルーズリーフセグメントは、本格的でカスタマイズ可能な喫煙体験を求める従来のタバコユーザーにアピールすることで繁栄しています。ユーザーは、好みに応じてタバコの量とブレンドを調整できる柔軟性を高く評価しており、これはパーソナライズされた消費オプションの需要の高まりと一致しています。
地域の展望
地域別に見ると、市場は北米、欧州、アジア太平洋、ラテンアメリカ、中東・アフリカにわたって分析されています。北米セグメントは、2023年に市場で26%の収益シェアを記録しました。北米セグメントは、この地域の健康志向の消費者ベースの拡大とHNBデバイスの技術的進歩によって繁栄しています。従来の喫煙による健康への影響に対する意識の高まりに支えられた、リスクの少ない代替品への移行は、HNB製品の需要を促進しています。
目次
第1章 市場範囲と調査手法
- 市場の定義
- 目的
- 市場範囲
- セグメンテーション
- 調査手法
第2章 市場要覧
- 主なハイライト
第3章 市場概要
- イントロダクション
- 概要
- 市場構成とシナリオ
- 概要
- 市場に影響を与える主な要因
- 市場促進要因
- 市場抑制要因
- 市場機会
- 市場の課題
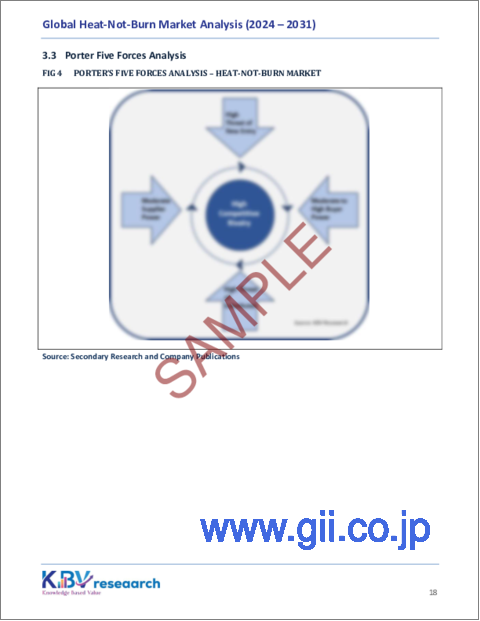
- ポーターのファイブフォース分析
第4章 世界の加熱式タバコ市場:流通チャネル別
- 世界のオンラインマーケット:地域別
- 世界の小売店市場:地域別
- 世界の加熱式タバコ市場:小売店タイプ別
第5章 世界の加熱式タバコ市場:コンポーネント別
- 世界のスティック市場:地域別
- 世界のルーズリーフ市場:地域別
- 世界のデバイス市場:地域別
- 世界のカプセル市場:地域別
- 世界の気化器市場:地域別
- 世界のその他のンポーネント市場:地域別
第6章 世界の加熱式タバコ市場:地域別
- 北米
- 北米の市場:国別
- 米国
- カナダ
- メキシコ
- その他北米地域
- 北米の市場:国別
- 欧州
- 欧州の市場:国別
- ドイツ
- 英国
- フランス
- ロシア
- スペイン
- イタリア
- その他欧州地域
- 欧州の市場:国別
- アジア太平洋
- アジア太平洋の市場:国別
- 日本
- 韓国
- 中国
- インド
- マレーシア
- 台湾
- その他アジア太平洋
- アジア太平洋の市場:国別
- ラテンアメリカ、中東・アフリカ
- ラテンアメリカ、中東・アフリカの市場:国別
- アラブ首長国連邦
- サウジアラビア
- 南アフリカ
- エジプト
- トルコ
- ナイジェリア
- その他ラテンアメリカ、中東・アフリカ地域
- ラテンアメリカ、中東・アフリカの市場:国別
第7章 企業プロファイル
- British American Tobacco PLC
- Imperial Brands PLC
- Japan Tobacco, Inc(Government of Japan)
- Korea Tobacco & Ginseng Corporation(KT&G Corporation)
- Philip Morris International Inc
- PAX Labs, Inc
第8章 加熱式タバコ市場の成功必須条件
LIST OF TABLES
- TABLE 1 Global Heat-Not-Burn Market, 2020 - 2023, USD Million
- TABLE 2 Global Heat-Not-Burn Market, 2024 - 2031, USD Million
- TABLE 3 Global Heat-Not-Burn Market by Distribution Channel, 2020 - 2023, USD Million
- TABLE 4 Global Heat-Not-Burn Market by Distribution Channel, 2024 - 2031, USD Million
- TABLE 5 Global Online Market by Region, 2020 - 2023, USD Million
- TABLE 6 Global Online Market by Region, 2024 - 2031, USD Million
- TABLE 7 Global Retail Store Market by Region, 2020 - 2023, USD Million
- TABLE 8 Global Retail Store Market by Region, 2024 - 2031, USD Million
- TABLE 9 Global Heat-Not-Burn Market by Retail Store Type, 2020 - 2023, USD Million
- TABLE 10 Global Heat-Not-Burn Market by Retail Store Type, 2024 - 2031, USD Million
- TABLE 11 Global Convenience Store Market by Region, 2020 - 2023, USD Million
- TABLE 12 Global Convenience Store Market by Region, 2024 - 2031, USD Million
- TABLE 13 Global Tobacconist Store Market by Region, 2020 - 2023, USD Million
- TABLE 14 Global Tobacconist Store Market by Region, 2024 - 2031, USD Million
- TABLE 15 Global Grocery Store Market by Region, 2020 - 2023, USD Million
- TABLE 16 Global Grocery Store Market by Region, 2024 - 2031, USD Million
- TABLE 17 Global Drug Store Market by Region, 2020 - 2023, USD Million
- TABLE 18 Global Drug Store Market by Region, 2024 - 2031, USD Million
- TABLE 19 Global Other Retail Store Type Market by Region, 2020 - 2023, USD Million
- TABLE 20 Global Other Retail Store Type Market by Region, 2024 - 2031, USD Million
- TABLE 21 Global Heat-Not-Burn Market by Component, 2020 - 2023, USD Million
- TABLE 22 Global Heat-Not-Burn Market by Component, 2024 - 2031, USD Million
- TABLE 23 Global Sticks Market by Region, 2020 - 2023, USD Million
- TABLE 24 Global Sticks Market by Region, 2024 - 2031, USD Million
- TABLE 25 Global Loose-leaf Market by Region, 2020 - 2023, USD Million
- TABLE 26 Global Loose-leaf Market by Region, 2024 - 2031, USD Million
- TABLE 27 Global Devices Market by Region, 2020 - 2023, USD Million
- TABLE 28 Global Devices Market by Region, 2024 - 2031, USD Million
- TABLE 29 Global Capsules Market by Region, 2020 - 2023, USD Million
- TABLE 30 Global Capsules Market by Region, 2024 - 2031, USD Million
- TABLE 31 Global Vaporizers Market by Region, 2020 - 2023, USD Million
- TABLE 32 Global Vaporizers Market by Region, 2024 - 2031, USD Million
- TABLE 33 Global Other Component Market by Region, 2020 - 2023, USD Million
- TABLE 34 Global Other Component Market by Region, 2024 - 2031, USD Million
- TABLE 35 Global Heat-Not-Burn Market by Region, 2020 - 2023, USD Million
- TABLE 36 Global Heat-Not-Burn Market by Region, 2024 - 2031, USD Million
- TABLE 37 North America Heat-Not-Burn Market, 2020 - 2023, USD Million
- TABLE 38 North America Heat-Not-Burn Market, 2024 - 2031, USD Million
- TABLE 39 North America Heat-Not-Burn Market by Distribution Channel, 2020 - 2023, USD Million
- TABLE 40 North America Heat-Not-Burn Market by Distribution Channel, 2024 - 2031, USD Million
- TABLE 41 North America Online Market by Country, 2020 - 2023, USD Million
- TABLE 42 North America Online Market by Country, 2024 - 2031, USD Million
- TABLE 43 North America Retail Store Market by Country, 2020 - 2023, USD Million
- TABLE 44 North America Retail Store Market by Country, 2024 - 2031, USD Million
- TABLE 45 North America Heat-Not-Burn Market by Retail Store Type, 2020 - 2023, USD Million
- TABLE 46 North America Heat-Not-Burn Market by Retail Store Type, 2024 - 2031, USD Million
- TABLE 47 North America Convenience Store Market by Country, 2020 - 2023, USD Million
- TABLE 48 North America Convenience Store Market by Country, 2024 - 2031, USD Million
- TABLE 49 North America Tobacconist Store Market by Country, 2020 - 2023, USD Million
- TABLE 50 North America Tobacconist Store Market by Country, 2024 - 2031, USD Million
- TABLE 51 North America Grocery Store Market by Country, 2020 - 2023, USD Million
- TABLE 52 North America Grocery Store Market by Country, 2024 - 2031, USD Million
- TABLE 53 North America Drug Store Market by Country, 2020 - 2023, USD Million
- TABLE 54 North America Drug Store Market by Country, 2024 - 2031, USD Million
- TABLE 55 North America Other Retail Store Type Market by Country, 2020 - 2023, USD Million
- TABLE 56 North America Other Retail Store Type Market by Country, 2024 - 2031, USD Million
- TABLE 57 North America Heat-Not-Burn Market by Component, 2020 - 2023, USD Million
- TABLE 58 North America Heat-Not-Burn Market by Component, 2024 - 2031, USD Million
- TABLE 59 North America Sticks Market by Country, 2020 - 2023, USD Million
- TABLE 60 North America Sticks Market by Country, 2024 - 2031, USD Million
- TABLE 61 North America Loose-leaf Market by Country, 2020 - 2023, USD Million
- TABLE 62 North America Loose-leaf Market by Country, 2024 - 2031, USD Million
- TABLE 63 North America Devices Market by Country, 2020 - 2023, USD Million
- TABLE 64 North America Devices Market by Country, 2024 - 2031, USD Million
- TABLE 65 North America Capsules Market by Country, 2020 - 2023, USD Million
- TABLE 66 North America Capsules Market by Country, 2024 - 2031, USD Million
- TABLE 67 North America Vaporizers Market by Country, 2020 - 2023, USD Million
- TABLE 68 North America Vaporizers Market by Country, 2024 - 2031, USD Million
- TABLE 69 North America Other Component Market by Country, 2020 - 2023, USD Million
- TABLE 70 North America Other Component Market by Country, 2024 - 2031, USD Million
- TABLE 71 North America Heat-Not-Burn Market by Country, 2020 - 2023, USD Million
- TABLE 72 North America Heat-Not-Burn Market by Country, 2024 - 2031, USD Million
- TABLE 73 US Heat-Not-Burn Market, 2020 - 2023, USD Million
- TABLE 74 US Heat-Not-Burn Market, 2024 - 2031, USD Million
- TABLE 75 US Heat-Not-Burn Market by Distribution Channel, 2020 - 2023, USD Million
- TABLE 76 US Heat-Not-Burn Market by Distribution Channel, 2024 - 2031, USD Million
- TABLE 77 US Heat-Not-Burn Market by Retail Store Type, 2020 - 2023, USD Million
- TABLE 78 US Heat-Not-Burn Market by Retail Store Type, 2024 - 2031, USD Million
- TABLE 79 US Heat-Not-Burn Market by Component, 2020 - 2023, USD Million
- TABLE 80 US Heat-Not-Burn Market by Component, 2024 - 2031, USD Million
- TABLE 81 Canada Heat-Not-Burn Market, 2020 - 2023, USD Million
- TABLE 82 Canada Heat-Not-Burn Market, 2024 - 2031, USD Million
- TABLE 83 Canada Heat-Not-Burn Market by Distribution Channel, 2020 - 2023, USD Million
- TABLE 84 Canada Heat-Not-Burn Market by Distribution Channel, 2024 - 2031, USD Million
- TABLE 85 Canada Heat-Not-Burn Market by Retail Store Type, 2020 - 2023, USD Million
- TABLE 86 Canada Heat-Not-Burn Market by Retail Store Type, 2024 - 2031, USD Million
- TABLE 87 Canada Heat-Not-Burn Market by Component, 2020 - 2023, USD Million
- TABLE 88 Canada Heat-Not-Burn Market by Component, 2024 - 2031, USD Million
- TABLE 89 Mexico Heat-Not-Burn Market, 2020 - 2023, USD Million
- TABLE 90 Mexico Heat-Not-Burn Market, 2024 - 2031, USD Million
- TABLE 91 Mexico Heat-Not-Burn Market by Distribution Channel, 2020 - 2023, USD Million
- TABLE 92 Mexico Heat-Not-Burn Market by Distribution Channel, 2024 - 2031, USD Million
- TABLE 93 Mexico Heat-Not-Burn Market by Retail Store Type, 2020 - 2023, USD Million
- TABLE 94 Mexico Heat-Not-Burn Market by Retail Store Type, 2024 - 2031, USD Million
- TABLE 95 Mexico Heat-Not-Burn Market by Component, 2020 - 2023, USD Million
- TABLE 96 Mexico Heat-Not-Burn Market by Component, 2024 - 2031, USD Million
- TABLE 97 Rest of North America Heat-Not-Burn Market, 2020 - 2023, USD Million
- TABLE 98 Rest of North America Heat-Not-Burn Market, 2024 - 2031, USD Million
- TABLE 99 Rest of North America Heat-Not-Burn Market by Distribution Channel, 2020 - 2023, USD Million
- TABLE 100 Rest of North America Heat-Not-Burn Market by Distribution Channel, 2024 - 2031, USD Million
- TABLE 101 Rest of North America Heat-Not-Burn Market by Retail Store Type, 2020 - 2023, USD Million
- TABLE 102 Rest of North America Heat-Not-Burn Market by Retail Store Type, 2024 - 2031, USD Million
- TABLE 103 Rest of North America Heat-Not-Burn Market by Component, 2020 - 2023, USD Million
- TABLE 104 Rest of North America Heat-Not-Burn Market by Component, 2024 - 2031, USD Million
- TABLE 105 Europe Heat-Not-Burn Market, 2020 - 2023, USD Million
- TABLE 106 Europe Heat-Not-Burn Market, 2024 - 2031, USD Million
- TABLE 107 Europe Heat-Not-Burn Market by Distribution Channel, 2020 - 2023, USD Million
- TABLE 108 Europe Heat-Not-Burn Market by Distribution Channel, 2024 - 2031, USD Million
- TABLE 109 Europe Online Market by Country, 2020 - 2023, USD Million
- TABLE 110 Europe Online Market by Country, 2024 - 2031, USD Million
- TABLE 111 Europe Retail Store Market by Country, 2020 - 2023, USD Million
- TABLE 112 Europe Retail Store Market by Country, 2024 - 2031, USD Million
- TABLE 113 Europe Heat-Not-Burn Market by Retail Store Type, 2020 - 2023, USD Million
- TABLE 114 Europe Heat-Not-Burn Market by Retail Store Type, 2024 - 2031, USD Million
- TABLE 115 Europe Convenience Store Market by Country, 2020 - 2023, USD Million
- TABLE 116 Europe Convenience Store Market by Country, 2024 - 2031, USD Million
- TABLE 117 Europe Tobacconist Store Market by Country, 2020 - 2023, USD Million
- TABLE 118 Europe Tobacconist Store Market by Country, 2024 - 2031, USD Million
- TABLE 119 Europe Grocery Store Market by Country, 2020 - 2023, USD Million
- TABLE 120 Europe Grocery Store Market by Country, 2024 - 2031, USD Million
- TABLE 121 Europe Drug Store Market by Country, 2020 - 2023, USD Million
- TABLE 122 Europe Drug Store Market by Country, 2024 - 2031, USD Million
- TABLE 123 Europe Other Retail Store Type Market by Country, 2020 - 2023, USD Million
- TABLE 124 Europe Other Retail Store Type Market by Country, 2024 - 2031, USD Million
- TABLE 125 Europe Heat-Not-Burn Market by Component, 2020 - 2023, USD Million
- TABLE 126 Europe Heat-Not-Burn Market by Component, 2024 - 2031, USD Million
- TABLE 127 Europe Sticks Market by Country, 2020 - 2023, USD Million
- TABLE 128 Europe Sticks Market by Country, 2024 - 2031, USD Million
- TABLE 129 Europe Loose-leaf Market by Country, 2020 - 2023, USD Million
- TABLE 130 Europe Loose-leaf Market by Country, 2024 - 2031, USD Million
- TABLE 131 Europe Devices Market by Country, 2020 - 2023, USD Million
- TABLE 132 Europe Devices Market by Country, 2024 - 2031, USD Million
- TABLE 133 Europe Capsules Market by Country, 2020 - 2023, USD Million
- TABLE 134 Europe Capsules Market by Country, 2024 - 2031, USD Million
- TABLE 135 Europe Vaporizers Market by Country, 2020 - 2023, USD Million
- TABLE 136 Europe Vaporizers Market by Country, 2024 - 2031, USD Million
- TABLE 137 Europe Other Component Market by Country, 2020 - 2023, USD Million
- TABLE 138 Europe Other Component Market by Country, 2024 - 2031, USD Million
- TABLE 139 Europe Heat-Not-Burn Market by Country, 2020 - 2023, USD Million
- TABLE 140 Europe Heat-Not-Burn Market by Country, 2024 - 2031, USD Million
- TABLE 141 Germany Heat-Not-Burn Market, 2020 - 2023, USD Million
- TABLE 142 Germany Heat-Not-Burn Market, 2024 - 2031, USD Million
- TABLE 143 Germany Heat-Not-Burn Market by Distribution Channel, 2020 - 2023, USD Million
- TABLE 144 Germany Heat-Not-Burn Market by Distribution Channel, 2024 - 2031, USD Million
- TABLE 145 Germany Heat-Not-Burn Market by Retail Store Type, 2020 - 2023, USD Million
- TABLE 146 Germany Heat-Not-Burn Market by Retail Store Type, 2024 - 2031, USD Million
- TABLE 147 Germany Heat-Not-Burn Market by Component, 2020 - 2023, USD Million
- TABLE 148 Germany Heat-Not-Burn Market by Component, 2024 - 2031, USD Million
- TABLE 149 UK Heat-Not-Burn Market, 2020 - 2023, USD Million
- TABLE 150 UK Heat-Not-Burn Market, 2024 - 2031, USD Million
- TABLE 151 UK Heat-Not-Burn Market by Distribution Channel, 2020 - 2023, USD Million
- TABLE 152 UK Heat-Not-Burn Market by Distribution Channel, 2024 - 2031, USD Million
- TABLE 153 UK Heat-Not-Burn Market by Retail Store Type, 2020 - 2023, USD Million
- TABLE 154 UK Heat-Not-Burn Market by Retail Store Type, 2024 - 2031, USD Million
- TABLE 155 UK Heat-Not-Burn Market by Component, 2020 - 2023, USD Million
- TABLE 156 UK Heat-Not-Burn Market by Component, 2024 - 2031, USD Million
- TABLE 157 France Heat-Not-Burn Market, 2020 - 2023, USD Million
- TABLE 158 France Heat-Not-Burn Market, 2024 - 2031, USD Million
- TABLE 159 France Heat-Not-Burn Market by Distribution Channel, 2020 - 2023, USD Million
- TABLE 160 France Heat-Not-Burn Market by Distribution Channel, 2024 - 2031, USD Million
- TABLE 161 France Heat-Not-Burn Market by Retail Store Type, 2020 - 2023, USD Million
- TABLE 162 France Heat-Not-Burn Market by Retail Store Type, 2024 - 2031, USD Million
- TABLE 163 France Heat-Not-Burn Market by Component, 2020 - 2023, USD Million
- TABLE 164 France Heat-Not-Burn Market by Component, 2024 - 2031, USD Million
- TABLE 165 Russia Heat-Not-Burn Market, 2020 - 2023, USD Million
- TABLE 166 Russia Heat-Not-Burn Market, 2024 - 2031, USD Million
- TABLE 167 Russia Heat-Not-Burn Market by Distribution Channel, 2020 - 2023, USD Million
- TABLE 168 Russia Heat-Not-Burn Market by Distribution Channel, 2024 - 2031, USD Million
- TABLE 169 Russia Heat-Not-Burn Market by Retail Store Type, 2020 - 2023, USD Million
- TABLE 170 Russia Heat-Not-Burn Market by Retail Store Type, 2024 - 2031, USD Million
- TABLE 171 Russia Heat-Not-Burn Market by Component, 2020 - 2023, USD Million
- TABLE 172 Russia Heat-Not-Burn Market by Component, 2024 - 2031, USD Million
- TABLE 173 Spain Heat-Not-Burn Market, 2020 - 2023, USD Million
- TABLE 174 Spain Heat-Not-Burn Market, 2024 - 2031, USD Million
- TABLE 175 Spain Heat-Not-Burn Market by Distribution Channel, 2020 - 2023, USD Million
- TABLE 176 Spain Heat-Not-Burn Market by Distribution Channel, 2024 - 2031, USD Million
- TABLE 177 Spain Heat-Not-Burn Market by Retail Store Type, 2020 - 2023, USD Million
- TABLE 178 Spain Heat-Not-Burn Market by Retail Store Type, 2024 - 2031, USD Million
- TABLE 179 Spain Heat-Not-Burn Market by Component, 2020 - 2023, USD Million
- TABLE 180 Spain Heat-Not-Burn Market by Component, 2024 - 2031, USD Million
- TABLE 181 Italy Heat-Not-Burn Market, 2020 - 2023, USD Million
- TABLE 182 Italy Heat-Not-Burn Market, 2024 - 2031, USD Million
- TABLE 183 Italy Heat-Not-Burn Market by Distribution Channel, 2020 - 2023, USD Million
- TABLE 184 Italy Heat-Not-Burn Market by Distribution Channel, 2024 - 2031, USD Million
- TABLE 185 Italy Heat-Not-Burn Market by Retail Store Type, 2020 - 2023, USD Million
- TABLE 186 Italy Heat-Not-Burn Market by Retail Store Type, 2024 - 2031, USD Million
- TABLE 187 Italy Heat-Not-Burn Market by Component, 2020 - 2023, USD Million
- TABLE 188 Italy Heat-Not-Burn Market by Component, 2024 - 2031, USD Million
- TABLE 189 Rest of Europe Heat-Not-Burn Market, 2020 - 2023, USD Million
- TABLE 190 Rest of Europe Heat-Not-Burn Market, 2024 - 2031, USD Million
- TABLE 191 Rest of Europe Heat-Not-Burn Market by Distribution Channel, 2020 - 2023, USD Million
- TABLE 192 Rest of Europe Heat-Not-Burn Market by Distribution Channel, 2024 - 2031, USD Million
- TABLE 193 Rest of Europe Heat-Not-Burn Market by Retail Store Type, 2020 - 2023, USD Million
- TABLE 194 Rest of Europe Heat-Not-Burn Market by Retail Store Type, 2024 - 2031, USD Million
- TABLE 195 Rest of Europe Heat-Not-Burn Market by Component, 2020 - 2023, USD Million
- TABLE 196 Rest of Europe Heat-Not-Burn Market by Component, 2024 - 2031, USD Million
- TABLE 197 Asia Pacific Heat-Not-Burn Market, 2020 - 2023, USD Million
- TABLE 198 Asia Pacific Heat-Not-Burn Market, 2024 - 2031, USD Million
- TABLE 199 Asia Pacific Heat-Not-Burn Market by Distribution Channel, 2020 - 2023, USD Million
- TABLE 200 Asia Pacific Heat-Not-Burn Market by Distribution Channel, 2024 - 2031, USD Million
- TABLE 201 Asia Pacific Online Market by Country, 2020 - 2023, USD Million
- TABLE 202 Asia Pacific Online Market by Country, 2024 - 2031, USD Million
- TABLE 203 Asia Pacific Retail Store Market by Country, 2020 - 2023, USD Million
- TABLE 204 Asia Pacific Retail Store Market by Country, 2024 - 2031, USD Million
- TABLE 205 Asia Pacific Heat-Not-Burn Market by Retail Store Type, 2020 - 2023, USD Million
- TABLE 206 Asia Pacific Heat-Not-Burn Market by Retail Store Type, 2024 - 2031, USD Million
- TABLE 207 Asia Pacific Convenience Store Market by Country, 2020 - 2023, USD Million
- TABLE 208 Asia Pacific Convenience Store Market by Country, 2024 - 2031, USD Million
- TABLE 209 Asia Pacific Tobacconist Store Market by Country, 2020 - 2023, USD Million
- TABLE 210 Asia Pacific Tobacconist Store Market by Country, 2024 - 2031, USD Million
- TABLE 211 Asia Pacific Grocery Store Market by Country, 2020 - 2023, USD Million
- TABLE 212 Asia Pacific Grocery Store Market by Country, 2024 - 2031, USD Million
- TABLE 213 Asia Pacific Drug Store Market by Country, 2020 - 2023, USD Million
- TABLE 214 Asia Pacific Drug Store Market by Country, 2024 - 2031, USD Million
- TABLE 215 Asia Pacific Other Retail Store Type Market by Country, 2020 - 2023, USD Million
- TABLE 216 Asia Pacific Other Retail Store Type Market by Country, 2024 - 2031, USD Million
- TABLE 217 Asia Pacific Heat-Not-Burn Market by Component, 2020 - 2023, USD Million
- TABLE 218 Asia Pacific Heat-Not-Burn Market by Component, 2024 - 2031, USD Million
- TABLE 219 Asia Pacific Sticks Market by Country, 2020 - 2023, USD Million
- TABLE 220 Asia Pacific Sticks Market by Country, 2024 - 2031, USD Million
- TABLE 221 Asia Pacific Loose-leaf Market by Country, 2020 - 2023, USD Million
- TABLE 222 Asia Pacific Loose-leaf Market by Country, 2024 - 2031, USD Million
- TABLE 223 Asia Pacific Devices Market by Country, 2020 - 2023, USD Million
- TABLE 224 Asia Pacific Devices Market by Country, 2024 - 2031, USD Million
- TABLE 225 Asia Pacific Capsules Market by Country, 2020 - 2023, USD Million
- TABLE 226 Asia Pacific Capsules Market by Country, 2024 - 2031, USD Million
- TABLE 227 Asia Pacific Vaporizers Market by Country, 2020 - 2023, USD Million
- TABLE 228 Asia Pacific Vaporizers Market by Country, 2024 - 2031, USD Million
- TABLE 229 Asia Pacific Other Component Market by Country, 2020 - 2023, USD Million
- TABLE 230 Asia Pacific Other Component Market by Country, 2024 - 2031, USD Million
- TABLE 231 Asia Pacific Heat-Not-Burn Market by Country, 2020 - 2023, USD Million
- TABLE 232 Asia Pacific Heat-Not-Burn Market by Country, 2024 - 2031, USD Million
- TABLE 233 Japan Heat-Not-Burn Market, 2020 - 2023, USD Million
- TABLE 234 Japan Heat-Not-Burn Market, 2024 - 2031, USD Million
- TABLE 235 Japan Heat-Not-Burn Market by Distribution Channel, 2020 - 2023, USD Million
- TABLE 236 Japan Heat-Not-Burn Market by Distribution Channel, 2024 - 2031, USD Million
- TABLE 237 Japan Heat-Not-Burn Market by Retail Store Type, 2020 - 2023, USD Million
- TABLE 238 Japan Heat-Not-Burn Market by Retail Store Type, 2024 - 2031, USD Million
- TABLE 239 Japan Heat-Not-Burn Market by Component, 2020 - 2023, USD Million
- TABLE 240 Japan Heat-Not-Burn Market by Component, 2024 - 2031, USD Million
- TABLE 241 South Korea Heat-Not-Burn Market, 2020 - 2023, USD Million
- TABLE 242 South Korea Heat-Not-Burn Market, 2024 - 2031, USD Million
- TABLE 243 South Korea Heat-Not-Burn Market by Distribution Channel, 2020 - 2023, USD Million
- TABLE 244 South Korea Heat-Not-Burn Market by Distribution Channel, 2024 - 2031, USD Million
- TABLE 245 South Korea Heat-Not-Burn Market by Retail Store Type, 2020 - 2023, USD Million
- TABLE 246 South Korea Heat-Not-Burn Market by Retail Store Type, 2024 - 2031, USD Million
- TABLE 247 South Korea Heat-Not-Burn Market by Component, 2020 - 2023, USD Million
- TABLE 248 South Korea Heat-Not-Burn Market by Component, 2024 - 2031, USD Million
- TABLE 249 China Heat-Not-Burn Market, 2020 - 2023, USD Million
- TABLE 250 China Heat-Not-Burn Market, 2024 - 2031, USD Million
- TABLE 251 China Heat-Not-Burn Market by Distribution Channel, 2020 - 2023, USD Million
- TABLE 252 China Heat-Not-Burn Market by Distribution Channel, 2024 - 2031, USD Million
- TABLE 253 China Heat-Not-Burn Market by Retail Store Type, 2020 - 2023, USD Million
- TABLE 254 China Heat-Not-Burn Market by Retail Store Type, 2024 - 2031, USD Million
- TABLE 255 China Heat-Not-Burn Market by Component, 2020 - 2023, USD Million
- TABLE 256 China Heat-Not-Burn Market by Component, 2024 - 2031, USD Million
- TABLE 257 India Heat-Not-Burn Market, 2020 - 2023, USD Million
- TABLE 258 India Heat-Not-Burn Market, 2024 - 2031, USD Million
- TABLE 259 India Heat-Not-Burn Market by Distribution Channel, 2020 - 2023, USD Million
- TABLE 260 India Heat-Not-Burn Market by Distribution Channel, 2024 - 2031, USD Million
- TABLE 261 India Heat-Not-Burn Market by Retail Store Type, 2020 - 2023, USD Million
- TABLE 262 India Heat-Not-Burn Market by Retail Store Type, 2024 - 2031, USD Million
- TABLE 263 India Heat-Not-Burn Market by Component, 2020 - 2023, USD Million
- TABLE 264 India Heat-Not-Burn Market by Component, 2024 - 2031, USD Million
- TABLE 265 Malaysia Heat-Not-Burn Market, 2020 - 2023, USD Million
- TABLE 266 Malaysia Heat-Not-Burn Market, 2024 - 2031, USD Million
- TABLE 267 Malaysia Heat-Not-Burn Market by Distribution Channel, 2020 - 2023, USD Million
- TABLE 268 Malaysia Heat-Not-Burn Market by Distribution Channel, 2024 - 2031, USD Million
- TABLE 269 Malaysia Heat-Not-Burn Market by Retail Store Type, 2020 - 2023, USD Million
- TABLE 270 Malaysia Heat-Not-Burn Market by Retail Store Type, 2024 - 2031, USD Million
- TABLE 271 Malaysia Heat-Not-Burn Market by Component, 2020 - 2023, USD Million
- TABLE 272 Malaysia Heat-Not-Burn Market by Component, 2024 - 2031, USD Million
- TABLE 273 Taiwan Heat-Not-Burn Market, 2020 - 2023, USD Million
- TABLE 274 Taiwan Heat-Not-Burn Market, 2024 - 2031, USD Million
- TABLE 275 Taiwan Heat-Not-Burn Market by Distribution Channel, 2020 - 2023, USD Million
- TABLE 276 Taiwan Heat-Not-Burn Market by Distribution Channel, 2024 - 2031, USD Million
- TABLE 277 Taiwan Heat-Not-Burn Market by Retail Store Type, 2020 - 2023, USD Million
- TABLE 278 Taiwan Heat-Not-Burn Market by Retail Store Type, 2024 - 2031, USD Million
- TABLE 279 Taiwan Heat-Not-Burn Market by Component, 2020 - 2023, USD Million
- TABLE 280 Taiwan Heat-Not-Burn Market by Component, 2024 - 2031, USD Million
- TABLE 281 Rest of Asia Pacific Heat-Not-Burn Market, 2020 - 2023, USD Million
- TABLE 282 Rest of Asia Pacific Heat-Not-Burn Market, 2024 - 2031, USD Million
- TABLE 283 Rest of Asia Pacific Heat-Not-Burn Market by Distribution Channel, 2020 - 2023, USD Million
- TABLE 284 Rest of Asia Pacific Heat-Not-Burn Market by Distribution Channel, 2024 - 2031, USD Million
- TABLE 285 Rest of Asia Pacific Heat-Not-Burn Market by Retail Store Type, 2020 - 2023, USD Million
- TABLE 286 Rest of Asia Pacific Heat-Not-Burn Market by Retail Store Type, 2024 - 2031, USD Million
- TABLE 287 Rest of Asia Pacific Heat-Not-Burn Market by Component, 2020 - 2023, USD Million
- TABLE 288 Rest of Asia Pacific Heat-Not-Burn Market by Component, 2024 - 2031, USD Million
- TABLE 289 LAMEA Heat-Not-Burn Market, 2020 - 2023, USD Million
- TABLE 290 LAMEA Heat-Not-Burn Market, 2024 - 2031, USD Million
- TABLE 291 LAMEA Heat-Not-Burn Market by Distribution Channel, 2020 - 2023, USD Million
- TABLE 292 LAMEA Heat-Not-Burn Market by Distribution Channel, 2024 - 2031, USD Million
- TABLE 293 LAMEA Online Market by Country, 2020 - 2023, USD Million
- TABLE 294 LAMEA Online Market by Country, 2024 - 2031, USD Million
- TABLE 295 LAMEA Retail Store Market by Country, 2020 - 2023, USD Million
- TABLE 296 LAMEA Retail Store Market by Country, 2024 - 2031, USD Million
- TABLE 297 LAMEA Heat-Not-Burn Market by Retail Store Type, 2020 - 2023, USD Million
- TABLE 298 LAMEA Heat-Not-Burn Market by Retail Store Type, 2024 - 2031, USD Million
- TABLE 299 LAMEA Convenience Store Market by Country, 2020 - 2023, USD Million
- TABLE 300 LAMEA Convenience Store Market by Country, 2024 - 2031, USD Million
- TABLE 301 LAMEA Tobacconist Store Market by Country, 2020 - 2023, USD Million
- TABLE 302 LAMEA Tobacconist Store Market by Country, 2024 - 2031, USD Million
- TABLE 303 LAMEA Grocery Store Market by Country, 2020 - 2023, USD Million
- TABLE 304 LAMEA Grocery Store Market by Country, 2024 - 2031, USD Million
- TABLE 305 LAMEA Drug Store Market by Country, 2020 - 2023, USD Million
- TABLE 306 LAMEA Drug Store Market by Country, 2024 - 2031, USD Million
- TABLE 307 LAMEA Other Retail Store Type Market by Country, 2020 - 2023, USD Million
- TABLE 308 LAMEA Other Retail Store Type Market by Country, 2024 - 2031, USD Million
- TABLE 309 LAMEA Heat-Not-Burn Market by Component, 2020 - 2023, USD Million
- TABLE 310 LAMEA Heat-Not-Burn Market by Component, 2024 - 2031, USD Million
- TABLE 311 LAMEA Sticks Market by Country, 2020 - 2023, USD Million
- TABLE 312 LAMEA Sticks Market by Country, 2024 - 2031, USD Million
- TABLE 313 LAMEA Loose-leaf Market by Country, 2020 - 2023, USD Million
- TABLE 314 LAMEA Loose-leaf Market by Country, 2024 - 2031, USD Million
- TABLE 315 LAMEA Devices Market by Country, 2020 - 2023, USD Million
- TABLE 316 LAMEA Devices Market by Country, 2024 - 2031, USD Million
- TABLE 317 LAMEA Capsules Market by Country, 2020 - 2023, USD Million
- TABLE 318 LAMEA Capsules Market by Country, 2024 - 2031, USD Million
- TABLE 319 LAMEA Vaporizers Market by Country, 2020 - 2023, USD Million
- TABLE 320 LAMEA Vaporizers Market by Country, 2024 - 2031, USD Million
- TABLE 321 LAMEA Other Component Market by Country, 2020 - 2023, USD Million
- TABLE 322 LAMEA Other Component Market by Country, 2024 - 2031, USD Million
- TABLE 323 LAMEA Heat-Not-Burn Market by Country, 2020 - 2023, USD Million
- TABLE 324 LAMEA Heat-Not-Burn Market by Country, 2024 - 2031, USD Million
- TABLE 325 UAE Heat-Not-Burn Market, 2020 - 2023, USD Million
- TABLE 326 UAE Heat-Not-Burn Market, 2024 - 2031, USD Million
- TABLE 327 UAE Heat-Not-Burn Market by Distribution Channel, 2020 - 2023, USD Million
- TABLE 328 UAE Heat-Not-Burn Market by Distribution Channel, 2024 - 2031, USD Million
- TABLE 329 UAE Heat-Not-Burn Market by Retail Store Type, 2020 - 2023, USD Million
- TABLE 330 UAE Heat-Not-Burn Market by Retail Store Type, 2024 - 2031, USD Million
- TABLE 331 UAE Heat-Not-Burn Market by Component, 2020 - 2023, USD Million
- TABLE 332 UAE Heat-Not-Burn Market by Component, 2024 - 2031, USD Million
- TABLE 333 Saudi Arabia Heat-Not-Burn Market, 2020 - 2023, USD Million
- TABLE 334 Saudi Arabia Heat-Not-Burn Market, 2024 - 2031, USD Million
- TABLE 335 Saudi Arabia Heat-Not-Burn Market by Distribution Channel, 2020 - 2023, USD Million
- TABLE 336 Saudi Arabia Heat-Not-Burn Market by Distribution Channel, 2024 - 2031, USD Million
- TABLE 337 Saudi Arabia Heat-Not-Burn Market by Retail Store Type, 2020 - 2023, USD Million
- TABLE 338 Saudi Arabia Heat-Not-Burn Market by Retail Store Type, 2024 - 2031, USD Million
- TABLE 339 Saudi Arabia Heat-Not-Burn Market by Component, 2020 - 2023, USD Million
- TABLE 340 Saudi Arabia Heat-Not-Burn Market by Component, 2024 - 2031, USD Million
- TABLE 341 South Africa Heat-Not-Burn Market, 2020 - 2023, USD Million
- TABLE 342 South Africa Heat-Not-Burn Market, 2024 - 2031, USD Million
- TABLE 343 South Africa Heat-Not-Burn Market by Distribution Channel, 2020 - 2023, USD Million
- TABLE 344 South Africa Heat-Not-Burn Market by Distribution Channel, 2024 - 2031, USD Million
- TABLE 345 South Africa Heat-Not-Burn Market by Retail Store Type, 2020 - 2023, USD Million
- TABLE 346 South Africa Heat-Not-Burn Market by Retail Store Type, 2024 - 2031, USD Million
- TABLE 347 South Africa Heat-Not-Burn Market by Component, 2020 - 2023, USD Million
- TABLE 348 South Africa Heat-Not-Burn Market by Component, 2024 - 2031, USD Million
- TABLE 349 Egypt Heat-Not-Burn Market, 2020 - 2023, USD Million
- TABLE 350 Egypt Heat-Not-Burn Market, 2024 - 2031, USD Million
- TABLE 351 Egypt Heat-Not-Burn Market by Distribution Channel, 2020 - 2023, USD Million
- TABLE 352 Egypt Heat-Not-Burn Market by Distribution Channel, 2024 - 2031, USD Million
- TABLE 353 Egypt Heat-Not-Burn Market by Retail Store Type, 2020 - 2023, USD Million
- TABLE 354 Egypt Heat-Not-Burn Market by Retail Store Type, 2024 - 2031, USD Million
- TABLE 355 Egypt Heat-Not-Burn Market by Component, 2020 - 2023, USD Million
- TABLE 356 Egypt Heat-Not-Burn Market by Component, 2024 - 2031, USD Million
- TABLE 357 Turkey Heat-Not-Burn Market, 2020 - 2023, USD Million
- TABLE 358 Turkey Heat-Not-Burn Market, 2024 - 2031, USD Million
- TABLE 359 Turkey Heat-Not-Burn Market by Distribution Channel, 2020 - 2023, USD Million
- TABLE 360 Turkey Heat-Not-Burn Market by Distribution Channel, 2024 - 2031, USD Million
- TABLE 361 Turkey Heat-Not-Burn Market by Retail Store Type, 2020 - 2023, USD Million
- TABLE 362 Turkey Heat-Not-Burn Market by Retail Store Type, 2024 - 2031, USD Million
- TABLE 363 Turkey Heat-Not-Burn Market by Component, 2020 - 2023, USD Million
- TABLE 364 Turkey Heat-Not-Burn Market by Component, 2024 - 2031, USD Million
- TABLE 365 Nigeria Heat-Not-Burn Market, 2020 - 2023, USD Million
- TABLE 366 Nigeria Heat-Not-Burn Market, 2024 - 2031, USD Million
- TABLE 367 Nigeria Heat-Not-Burn Market by Distribution Channel, 2020 - 2023, USD Million
- TABLE 368 Nigeria Heat-Not-Burn Market by Distribution Channel, 2024 - 2031, USD Million
- TABLE 369 Nigeria Heat-Not-Burn Market by Retail Store Type, 2020 - 2023, USD Million
- TABLE 370 Nigeria Heat-Not-Burn Market by Retail Store Type, 2024 - 2031, USD Million
- TABLE 371 Nigeria Heat-Not-Burn Market by Component, 2020 - 2023, USD Million
- TABLE 372 Nigeria Heat-Not-Burn Market by Component, 2024 - 2031, USD Million
- TABLE 373 Rest of LAMEA Heat-Not-Burn Market, 2020 - 2023, USD Million
- TABLE 374 Rest of LAMEA Heat-Not-Burn Market, 2024 - 2031, USD Million
- TABLE 375 Rest of LAMEA Heat-Not-Burn Market by Distribution Channel, 2020 - 2023, USD Million
- TABLE 376 Rest of LAMEA Heat-Not-Burn Market by Distribution Channel, 2024 - 2031, USD Million
- TABLE 377 Rest of LAMEA Heat-Not-Burn Market by Retail Store Type, 2020 - 2023, USD Million
- TABLE 378 Rest of LAMEA Heat-Not-Burn Market by Retail Store Type, 2024 - 2031, USD Million
- TABLE 379 Rest of LAMEA Heat-Not-Burn Market by Component, 2020 - 2023, USD Million
- TABLE 380 Rest of LAMEA Heat-Not-Burn Market by Component, 2024 - 2031, USD Million
- TABLE 381 Key Information - British American Tobacco PLC
- TABLE 382 Key Information - Imperial Brands PLC
- TABLE 383 key information - Japan Tobacco, Inc.
- TABLE 384 key Information - Korea Tobacco & Ginseng Corporation
- TABLE 385 Key Information - Philip Morris International Inc.
- TABLE 386 Key Information - PAX Labs, Inc.
The Global Heat-Not-Burn Market size is expected to reach $131.96 billion by 2031, rising at a market growth of 30.9% CAGR during the forecast period.
The Asia Pacific segment acquired 48% revenue share in the market in 2023. Countries like Japan and South Korea have been at the forefront of adopting HNB devices, driven by supportive regulatory environments and strong consumer interest in innovative smoking alternatives. Major HNB producers and rising disposable incomes in the area also contribute to the market's expansion. Aggressive marketing campaigns and the widespread availability of HNB products through retail and online channels contribute to the segment's dominance.
As awareness of the harmful effects of smoking traditional cigarettes continues to rise, consumers are increasingly seeking alternatives that align with their health-conscious lifestyles. This shift is largely driven by the well-documented health risks associated with combustible tobacco products, such as lung cancer, respiratory diseases, and cardiovascular issues. The act of traditional smoking involves the combustion of tobacco, which results in the emission of thousands of harmful chemicals, such as carbon monoxide and tar. Hence, growing health consciousness among consumers has become a critical factor in propelling the adoption of HNB products in the market.
Additionally, Early HNB devices faced challenges such as inconsistent heating, short battery life, and complex user interfaces, which limited their appeal. However, modern HNB products have overcome these barriers by incorporating cutting-edge technologies, making them more efficient, user-friendly, and reliable. One of the most significant advancements lies in developing precision heating mechanisms. Thus, this continuous evolution underscores the critical role of technology in shaping the market's future.
However, Governments worldwide are increasingly focused on the public health implications of tobacco products, leading to stringent regulations for HNB devices. These regulations are often as restrictive or even more stringent than those applied to traditional cigarettes. Many authorities require extensive health warnings on packaging, impose strict advertising limitations, and mandate costly health and safety studies before allowing products to enter the market. Hence, these factors may hamper the growth of the market.
Distribution Channel Outlook
Based on distribution channel, the market is bifurcated into online and retail store. The online segment procured 22% revenue share in the market in 2023. Customers can browse a wide range of HNB items, evaluate costs, and read reviews from the comfort of their homes. The availability of detailed product descriptions and video demonstrations further aids in making informed purchase decisions.
Component Outlook
By component, the market is divided into sticks, loose-leaf, devices, capsules, vaporizers, and others. The loose-leaf segment garnered 24% revenue share in the market in 2023. The loose-leaf segment thrives due to its appeal to traditional tobacco users seeking an authentic and customizable smoking experience. Users appreciate the flexibility to adjust the quantity and blend of tobacco according to their preferences, which aligns with the growing demand for personalized consumption options.
Regional Outlook
Region-wise, the market is analyzed across North America, Europe, Asia Pacific, and LAMEA. The North America segment recorded 26% revenue share in the market in 2023. The North America segment thrives on the region's growing health-conscious consumer base and technological advancements in HNB devices. The shift toward reduced-risk alternatives, supported by increasing awareness of the health impacts of traditional smoking, drives demand for HNB products.
List of Key Companies Profiled
- British American Tobacco PLC
- Imperial Brands PLC
- Japan Tobacco, Inc. (Government of Japan)
- Korea Tobacco & Ginseng Corporation (KT&G Corporation)
- Philip Morris International, Inc.
- PAX Labs, Inc.
Global Heat-Not-Burn Market Report Segmentation
By Distribution Channel
- Online
- Retail Store
- Convenience Store
- Tobacconist Store
- Grocery Store
- Drug Store
- Other Retail Store Type
By Component
- Sticks
- Loose-leaf
- Devices
- Capsules
- Vaporizers
- Other Component
By Geography
- North America
- US
- Canada
- Mexico
- Rest of North America
- Europe
- Germany
- UK
- France
- Russia
- Spain
- Italy
- Rest of Europe
- Asia Pacific
- Japan
- South Korea
- China
- India
- Malaysia
- Taiwan
- Rest of Asia Pacific
- LAMEA
- UAE
- Saudi Arabia
- South Africa
- Egypt
- Turkey
- Nigeria
- Rest of LAMEA
Table of Contents
Chapter 1. Market Scope & Methodology
- 1.1 Market Definition
- 1.2 Objectives
- 1.3 Market Scope
- 1.4 Segmentation
- 1.4.1 Global Heat-Not-Burn Market, by Distribution Channel
- 1.4.2 Global Heat-Not-Burn Market, by Component
- 1.4.3 Global Heat-Not-Burn Market, by Geography
- 1.5 Methodology for the research
Chapter 2. Market at a Glance
- 2.1 Key Highlights
Chapter 3. Market Overview
- 3.1 Introduction
- 3.1.1 Overview
- 3.1.1.1 Market Composition and Scenario
- 3.1.1 Overview
- 3.2 Key Factors Impacting the Market
- 3.2.1 Market Drivers
- 3.2.2 Market Restraints
- 3.2.3 Market Opportunities
- 3.2.4 Market Challenges
- 3.3 Porter Five Forces Analysis
Chapter 4. Global Heat-Not-Burn Market by Distribution Channel
- 4.1 Global Online Market by Region
- 4.2 Global Retail Store Market by Region
- 4.3 Global Heat-Not-Burn Market by Retail Store Type
- 4.3.1 Global Convenience Store Market by Region
- 4.3.2 Global Tobacconist Store Market by Region
- 4.3.3 Global Grocery Store Market by Region
- 4.3.4 Global Drug Store Market by Region
- 4.3.5 Global Other Retail Store Type Market by Region
Chapter 5. Global Heat-Not-Burn Market by Component
- 5.1 Global Sticks Market by Region
- 5.2 Global Loose-leaf Market by Region
- 5.3 Global Devices Market by Region
- 5.4 Global Capsules Market by Region
- 5.5 Global Vaporizers Market by Region
- 5.6 Global Other Component Market by Region
Chapter 6. Global Heat-Not-Burn Market by Region
- 6.1 North America Heat-Not-Burn Market
- 6.1.1 North America Heat-Not-Burn Market by Distribution Channel
- 6.1.1.1 North America Online Market by Country
- 6.1.1.2 North America Retail Store Market by Country
- 6.1.1.3 North America Heat-Not-Burn Market by Retail Store Type
- 6.1.1.3.1 North America Convenience Store Market by Country
- 6.1.1.3.2 North America Tobacconist Store Market by Country
- 6.1.1.3.3 North America Grocery Store Market by Country
- 6.1.1.3.4 North America Drug Store Market by Country
- 6.1.1.3.5 North America Other Retail Store Type Market by Country
- 6.1.2 North America Heat-Not-Burn Market by Component
- 6.1.2.1 North America Sticks Market by Country
- 6.1.2.2 North America Loose-leaf Market by Country
- 6.1.2.3 North America Devices Market by Country
- 6.1.2.4 North America Capsules Market by Country
- 6.1.2.5 North America Vaporizers Market by Country
- 6.1.2.6 North America Other Component Market by Country
- 6.1.3 North America Heat-Not-Burn Market by Country
- 6.1.3.1 US Heat-Not-Burn Market
- 6.1.3.1.1 US Heat-Not-Burn Market by Distribution Channel
- 6.1.3.1.1.1 US Heat-Not-Burn Market by Retail Store Type
- 6.1.3.1.2 US Heat-Not-Burn Market by Component
- 6.1.3.1.1 US Heat-Not-Burn Market by Distribution Channel
- 6.1.3.2 Canada Heat-Not-Burn Market
- 6.1.3.2.1 Canada Heat-Not-Burn Market by Distribution Channel
- 6.1.3.2.1.1 Canada Heat-Not-Burn Market by Retail Store Type
- 6.1.3.2.2 Canada Heat-Not-Burn Market by Component
- 6.1.3.2.1 Canada Heat-Not-Burn Market by Distribution Channel
- 6.1.3.3 Mexico Heat-Not-Burn Market
- 6.1.3.3.1 Mexico Heat-Not-Burn Market by Distribution Channel
- 6.1.3.3.1.1 Mexico Heat-Not-Burn Market by Retail Store Type
- 6.1.3.3.2 Mexico Heat-Not-Burn Market by Component
- 6.1.3.3.1 Mexico Heat-Not-Burn Market by Distribution Channel
- 6.1.3.4 Rest of North America Heat-Not-Burn Market
- 6.1.3.4.1 Rest of North America Heat-Not-Burn Market by Distribution Channel
- 6.1.3.4.1.1 Rest of North America Heat-Not-Burn Market by Retail Store Type
- 6.1.3.4.2 Rest of North America Heat-Not-Burn Market by Component
- 6.1.3.4.1 Rest of North America Heat-Not-Burn Market by Distribution Channel
- 6.1.3.1 US Heat-Not-Burn Market
- 6.1.1 North America Heat-Not-Burn Market by Distribution Channel
- 6.2 Europe Heat-Not-Burn Market
- 6.2.1 Europe Heat-Not-Burn Market by Distribution Channel
- 6.2.1.1 Europe Online Market by Country
- 6.2.1.2 Europe Retail Store Market by Country
- 6.2.1.3 Europe Heat-Not-Burn Market by Retail Store Type
- 6.2.1.3.1 Europe Convenience Store Market by Country
- 6.2.1.3.2 Europe Tobacconist Store Market by Country
- 6.2.1.3.3 Europe Grocery Store Market by Country
- 6.2.1.3.4 Europe Drug Store Market by Country
- 6.2.1.3.5 Europe Other Retail Store Type Market by Country
- 6.2.2 Europe Heat-Not-Burn Market by Component
- 6.2.2.1 Europe Sticks Market by Country
- 6.2.2.2 Europe Loose-leaf Market by Country
- 6.2.2.3 Europe Devices Market by Country
- 6.2.2.4 Europe Capsules Market by Country
- 6.2.2.5 Europe Vaporizers Market by Country
- 6.2.2.6 Europe Other Component Market by Country
- 6.2.3 Europe Heat-Not-Burn Market by Country
- 6.2.3.1 Germany Heat-Not-Burn Market
- 6.2.3.1.1 Germany Heat-Not-Burn Market by Distribution Channel
- 6.2.3.1.1.1 Germany Heat-Not-Burn Market by Retail Store Type
- 6.2.3.1.2 Germany Heat-Not-Burn Market by Component
- 6.2.3.1.1 Germany Heat-Not-Burn Market by Distribution Channel
- 6.2.3.2 UK Heat-Not-Burn Market
- 6.2.3.2.1 UK Heat-Not-Burn Market by Distribution Channel
- 6.2.3.2.1.1 UK Heat-Not-Burn Market by Retail Store Type
- 6.2.3.2.2 UK Heat-Not-Burn Market by Component
- 6.2.3.2.1 UK Heat-Not-Burn Market by Distribution Channel
- 6.2.3.3 France Heat-Not-Burn Market
- 6.2.3.3.1 France Heat-Not-Burn Market by Distribution Channel
- 6.2.3.3.1.1 France Heat-Not-Burn Market by Retail Store Type
- 6.2.3.3.2 France Heat-Not-Burn Market by Component
- 6.2.3.3.1 France Heat-Not-Burn Market by Distribution Channel
- 6.2.3.4 Russia Heat-Not-Burn Market
- 6.2.3.4.1 Russia Heat-Not-Burn Market by Distribution Channel
- 6.2.3.4.1.1 Russia Heat-Not-Burn Market by Retail Store Type
- 6.2.3.4.2 Russia Heat-Not-Burn Market by Component
- 6.2.3.4.1 Russia Heat-Not-Burn Market by Distribution Channel
- 6.2.3.5 Spain Heat-Not-Burn Market
- 6.2.3.5.1 Spain Heat-Not-Burn Market by Distribution Channel
- 6.2.3.5.1.1 Spain Heat-Not-Burn Market by Retail Store Type
- 6.2.3.5.2 Spain Heat-Not-Burn Market by Component
- 6.2.3.5.1 Spain Heat-Not-Burn Market by Distribution Channel
- 6.2.3.6 Italy Heat-Not-Burn Market
- 6.2.3.6.1 Italy Heat-Not-Burn Market by Distribution Channel
- 6.2.3.6.1.1 Italy Heat-Not-Burn Market by Retail Store Type
- 6.2.3.6.2 Italy Heat-Not-Burn Market by Component
- 6.2.3.6.1 Italy Heat-Not-Burn Market by Distribution Channel
- 6.2.3.7 Rest of Europe Heat-Not-Burn Market
- 6.2.3.7.1 Rest of Europe Heat-Not-Burn Market by Distribution Channel
- 6.2.3.7.1.1 Rest of Europe Heat-Not-Burn Market by Retail Store Type
- 6.2.3.7.2 Rest of Europe Heat-Not-Burn Market by Component
- 6.2.3.7.1 Rest of Europe Heat-Not-Burn Market by Distribution Channel
- 6.2.3.1 Germany Heat-Not-Burn Market
- 6.2.1 Europe Heat-Not-Burn Market by Distribution Channel
- 6.3 Asia Pacific Heat-Not-Burn Market
- 6.3.1 Asia Pacific Heat-Not-Burn Market by Distribution Channel
- 6.3.1.1 Asia Pacific Online Market by Country
- 6.3.1.2 Asia Pacific Retail Store Market by Country
- 6.3.1.3 Asia Pacific Heat-Not-Burn Market by Retail Store Type
- 6.3.1.3.1 Asia Pacific Convenience Store Market by Country
- 6.3.1.3.2 Asia Pacific Tobacconist Store Market by Country
- 6.3.1.3.3 Asia Pacific Grocery Store Market by Country
- 6.3.1.3.4 Asia Pacific Drug Store Market by Country
- 6.3.1.3.5 Asia Pacific Other Retail Store Type Market by Country
- 6.3.2 Asia Pacific Heat-Not-Burn Market by Component
- 6.3.2.1 Asia Pacific Sticks Market by Country
- 6.3.2.2 Asia Pacific Loose-leaf Market by Country
- 6.3.2.3 Asia Pacific Devices Market by Country
- 6.3.2.4 Asia Pacific Capsules Market by Country
- 6.3.2.5 Asia Pacific Vaporizers Market by Country
- 6.3.2.6 Asia Pacific Other Component Market by Country
- 6.3.3 Asia Pacific Heat-Not-Burn Market by Country
- 6.3.3.1 Japan Heat-Not-Burn Market
- 6.3.3.1.1 Japan Heat-Not-Burn Market by Distribution Channel
- 6.3.3.1.1.1 Japan Heat-Not-Burn Market by Retail Store Type
- 6.3.3.1.2 Japan Heat-Not-Burn Market by Component
- 6.3.3.1.1 Japan Heat-Not-Burn Market by Distribution Channel
- 6.3.3.2 South Korea Heat-Not-Burn Market
- 6.3.3.2.1 South Korea Heat-Not-Burn Market by Distribution Channel
- 6.3.3.2.1.1 South Korea Heat-Not-Burn Market by Retail Store Type
- 6.3.3.2.2 South Korea Heat-Not-Burn Market by Component
- 6.3.3.2.1 South Korea Heat-Not-Burn Market by Distribution Channel
- 6.3.3.3 China Heat-Not-Burn Market
- 6.3.3.3.1 China Heat-Not-Burn Market by Distribution Channel
- 6.3.3.3.1.1 China Heat-Not-Burn Market by Retail Store Type
- 6.3.3.3.2 China Heat-Not-Burn Market by Component
- 6.3.3.3.1 China Heat-Not-Burn Market by Distribution Channel
- 6.3.3.4 India Heat-Not-Burn Market
- 6.3.3.4.1 India Heat-Not-Burn Market by Distribution Channel
- 6.3.3.4.1.1 India Heat-Not-Burn Market by Retail Store Type
- 6.3.3.4.2 India Heat-Not-Burn Market by Component
- 6.3.3.4.1 India Heat-Not-Burn Market by Distribution Channel
- 6.3.3.5 Malaysia Heat-Not-Burn Market
- 6.3.3.5.1 Malaysia Heat-Not-Burn Market by Distribution Channel
- 6.3.3.5.1.1 Malaysia Heat-Not-Burn Market by Retail Store Type
- 6.3.3.5.2 Malaysia Heat-Not-Burn Market by Component
- 6.3.3.5.1 Malaysia Heat-Not-Burn Market by Distribution Channel
- 6.3.3.6 Taiwan Heat-Not-Burn Market
- 6.3.3.6.1 Taiwan Heat-Not-Burn Market by Distribution Channel
- 6.3.3.6.1.1 Taiwan Heat-Not-Burn Market by Retail Store Type
- 6.3.3.6.2 Taiwan Heat-Not-Burn Market by Component
- 6.3.3.6.1 Taiwan Heat-Not-Burn Market by Distribution Channel
- 6.3.3.7 Rest of Asia Pacific Heat-Not-Burn Market
- 6.3.3.7.1 Rest of Asia Pacific Heat-Not-Burn Market by Distribution Channel
- 6.3.3.7.1.1 Rest of Asia Pacific Heat-Not-Burn Market by Retail Store Type
- 6.3.3.7.2 Rest of Asia Pacific Heat-Not-Burn Market by Component
- 6.3.3.7.1 Rest of Asia Pacific Heat-Not-Burn Market by Distribution Channel
- 6.3.3.1 Japan Heat-Not-Burn Market
- 6.3.1 Asia Pacific Heat-Not-Burn Market by Distribution Channel
- 6.4 LAMEA Heat-Not-Burn Market
- 6.4.1 LAMEA Heat-Not-Burn Market by Distribution Channel
- 6.4.1.1 LAMEA Online Market by Country
- 6.4.1.2 LAMEA Retail Store Market by Country
- 6.4.1.3 LAMEA Heat-Not-Burn Market by Retail Store Type
- 6.4.1.3.1 LAMEA Convenience Store Market by Country
- 6.4.1.3.2 LAMEA Tobacconist Store Market by Country
- 6.4.1.3.3 LAMEA Grocery Store Market by Country
- 6.4.1.3.4 LAMEA Drug Store Market by Country
- 6.4.1.3.5 LAMEA Other Retail Store Type Market by Country
- 6.4.2 LAMEA Heat-Not-Burn Market by Component
- 6.4.2.1 LAMEA Sticks Market by Country
- 6.4.2.2 LAMEA Loose-leaf Market by Country
- 6.4.2.3 LAMEA Devices Market by Country
- 6.4.2.4 LAMEA Capsules Market by Country
- 6.4.2.5 LAMEA Vaporizers Market by Country
- 6.4.2.6 LAMEA Other Component Market by Country
- 6.4.3 LAMEA Heat-Not-Burn Market by Country
- 6.4.3.1 UAE Heat-Not-Burn Market
- 6.4.3.1.1 UAE Heat-Not-Burn Market by Distribution Channel
- 6.4.3.1.1.1 UAE Heat-Not-Burn Market by Retail Store Type
- 6.4.3.1.2 UAE Heat-Not-Burn Market by Component
- 6.4.3.1.1 UAE Heat-Not-Burn Market by Distribution Channel
- 6.4.3.2 Saudi Arabia Heat-Not-Burn Market
- 6.4.3.2.1 Saudi Arabia Heat-Not-Burn Market by Distribution Channel
- 6.4.3.2.1.1 Saudi Arabia Heat-Not-Burn Market by Retail Store Type
- 6.4.3.2.2 Saudi Arabia Heat-Not-Burn Market by Component
- 6.4.3.2.1 Saudi Arabia Heat-Not-Burn Market by Distribution Channel
- 6.4.3.3 South Africa Heat-Not-Burn Market
- 6.4.3.3.1 South Africa Heat-Not-Burn Market by Distribution Channel
- 6.4.3.3.1.1 South Africa Heat-Not-Burn Market by Retail Store Type
- 6.4.3.3.2 South Africa Heat-Not-Burn Market by Component
- 6.4.3.3.1 South Africa Heat-Not-Burn Market by Distribution Channel
- 6.4.3.4 Egypt Heat-Not-Burn Market
- 6.4.3.4.1 Egypt Heat-Not-Burn Market by Distribution Channel
- 6.4.3.4.1.1 Egypt Heat-Not-Burn Market by Retail Store Type
- 6.4.3.4.2 Egypt Heat-Not-Burn Market by Component
- 6.4.3.4.1 Egypt Heat-Not-Burn Market by Distribution Channel
- 6.4.3.5 Turkey Heat-Not-Burn Market
- 6.4.3.5.1 Turkey Heat-Not-Burn Market by Distribution Channel
- 6.4.3.5.1.1 Turkey Heat-Not-Burn Market by Retail Store Type
- 6.4.3.5.2 Turkey Heat-Not-Burn Market by Component
- 6.4.3.5.1 Turkey Heat-Not-Burn Market by Distribution Channel
- 6.4.3.6 Nigeria Heat-Not-Burn Market
- 6.4.3.6.1 Nigeria Heat-Not-Burn Market by Distribution Channel
- 6.4.3.6.1.1 Nigeria Heat-Not-Burn Market by Retail Store Type
- 6.4.3.6.2 Nigeria Heat-Not-Burn Market by Component
- 6.4.3.6.1 Nigeria Heat-Not-Burn Market by Distribution Channel
- 6.4.3.7 Rest of LAMEA Heat-Not-Burn Market
- 6.4.3.7.1 Rest of LAMEA Heat-Not-Burn Market by Distribution Channel
- 6.4.3.7.1.1 Rest of LAMEA Heat-Not-Burn Market by Retail Store Type
- 6.4.3.7.2 Rest of LAMEA Heat-Not-Burn Market by Component
- 6.4.3.7.1 Rest of LAMEA Heat-Not-Burn Market by Distribution Channel
- 6.4.3.1 UAE Heat-Not-Burn Market
- 6.4.1 LAMEA Heat-Not-Burn Market by Distribution Channel
Chapter 7. Company Profiles
- 7.1 British American Tobacco PLC
- 7.1.1 Company Overview
- 7.1.2 SWOT Analysis
- 7.2 Imperial Brands PLC
- 7.2.1 Company Overview
- 7.2.2 Financial Analysis
- 7.2.3 Segmental and Regional Analysis
- 7.2.4 SWOT Analysis
- 7.3 Japan Tobacco, Inc. (Government of Japan)
- 7.3.1 Company Overview
- 7.3.2 Financial Analysis
- 7.3.3 Segmental Analysis
- 7.3.4 Research & Development Expense
- 7.4 Korea Tobacco & Ginseng Corporation (KT&G Corporation)
- 7.4.1 Company Overview
- 7.4.2 Financial Analysis
- 7.5 Philip Morris International Inc.
- 7.5.1 Company Overview
- 7.6 PAX Labs, Inc.
- 7.6.1 Company Overview
