|
|
市場調査レポート
商品コード
1616542
作業療法ソフトウェアの世界市場規模、シェア、動向分析:配信モード別、最終用途別、インターフェース別、地域別、展望と予測、2024~2031年Global Occupational Therapy Software Market Size, Share & Trends Analysis Report By Delivery Mode (Cloud-based and Web-based), By End-use, By Interface, By Regional Outlook and Forecast, 2024 - 2031 |
||||||

|
|||||||
|
|||||||

| 作業療法ソフトウェアの世界市場規模、シェア、動向分析:配信モード別、最終用途別、インターフェース別、地域別、展望と予測、2024~2031年 |
|
出版日: 2024年12月06日
発行: KBV Research
ページ情報: 英文 196 Pages
納期: 即納可能
|

全表示
- 概要
- 図表
- 目次
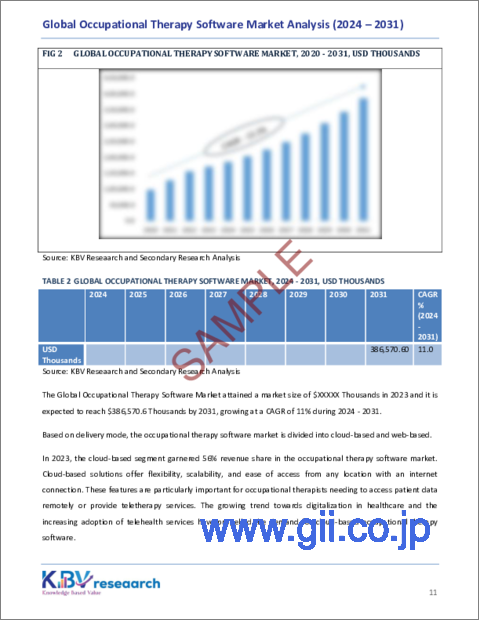
作業療法ソフトウェアの世界市場規模は、予測期間中に11.0%のCAGRで市場成長し、2031年までに3億8,657万米ドルに達すると予想されています。
さらに、医療ITとデジタルセラピーの技術的進歩により作業療法の情勢が一変し、セラピストがより効果的な治療を提供しやすくなっています。人工知能(AI)、機械学習(ML)、データ分析をこのソフトウェアに統合することで、治療計画と患者のモニタリングに革命が起こりました。AIアルゴリズムは、患者の転帰を予測し、個人に合わせた介入を推奨し、患者データを分析して治療計画をリアルタイムで調整するのに役立ちます。結論として、医療ITとデジタルセラピーの技術的進歩が市場の成長を牽引しています。
しかし、このソフトウェアを導入する際の主な制約の1つは、ヘルスケア提供者にとって初期投資と実装コストが高いことです。多くのヘルスケア機関、特に小規模なクリニックや個人開業医は、高度なソフトウェアソリューションを実装するための初期費用を負担するのに苦労することがあります。これには、ソフトウェア自体の購入だけでなく、必要なインフラストラクチャ、スタッフのトレーニング、既存のシステムとの統合も含まれます。したがって、ヘルスケア提供者にとって初期投資と実装コストが高いことが、市場の成長を妨げています。
さらに、パンデミックの間、多くのヘルスケア施設は業務の混乱に直面し、作業療法サービスの需要が一時的に減少し、その結果、このソフトウェアの需要も減少しました。ロックダウンと社会的距離の確保措置により、ヘルスケアセンター、リハビリ施設、クリニックでの新しい作業療法ソフトウェアの採用と実装が遅れました。パンデミック中にヘルスケア提供者が直面した財政的不確実性と予算削減により、ソフトウェアの購入が遅れたりキャンセルされたりし、市場の成長に影響を与えました。このように、 COVID-19は市場に悪影響を及ぼしました。
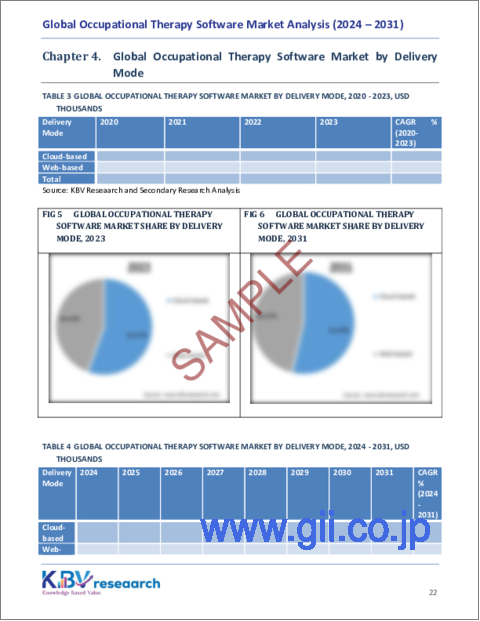
配信モード別の展望
配信モードに基づいて、作業療法ソフトウェア市場はクラウドベースとウェブベースに分かれています。ウェブベースのセグメントは、2023年にこの市場の収益シェアの44%を占めました。ウェブベースのソリューションは通常、ウェブブラウザからアクセスされ、ローカルのヘルスケア施設のサーバーにインストールされます。これらのソリューションは、高度なカスタマイズとデータ制御を提供できます。これは、特定のセキュリティとコンプライアンスの要件を持つ組織にとって非常に重要です。
最終用途別の展望
最終用途に基づいて、作業療法ソフトウェア市場は病院、クリニック、その他に分類されます。クリニックセグメントは、2023年にこの市場で34%の収益シェアを記録しました。クリニックは一般的に病院よりも患者数が少なく、患者の記録、治療セッション、スケジュールを管理するための効果的なツールを求めています。クリニックでのこのソフトウェアの採用は、合理化された運用と患者の転帰の改善の必要性によって推進されてきました。
インターフェース別の展望
インターフェースに基づいて、作業療法ソフトウェア市場はモバイル/タブレットとデスクトップ/ラップトップに分割されています。2023年には、デスクトップ/ラップトップセグメントがこの市場で42%の収益シェアを獲得しました。デスクトップとラップトップは、より広範なデータ分析、文書化、および患者管理が必要になる可能性のある臨床現場では依然として不可欠です。これらのデバイスは、より大きな画面サイズとより強力な処理機能を備えているため、複雑なケースを扱うセラピストや、従来のオフィス環境での作業を好むセラピストにとって有利です。
地域展望
地域別に見ると、作業療法ソフトウェア市場は北米、欧州、アジア太平洋、ラテンアメリカ・中東・アフリカにわたって分析されています。アジア太平洋地域は、2023年にこの市場で25%の収益シェアを生み出しました。アジア太平洋地域では、特に中国、日本、インドなどの国で、ヘルスケアのデジタル化が急速に進んでいます。ヘルスケアインフラの拡大、ヘルスケア投資の増加、デジタルヘルスソリューションの採用の増加が、この地域でのこのソフトウェアの成長に貢献しています。
目次
第1章 市場範囲と調査手法
- 市場の定義
- 目的
- 市場範囲
- セグメンテーション
- 調査手法
第2章 市場要覧
- 主なハイライト
第3章 市場概要
- イントロダクション
- 概要
- 市場構成とシナリオ
- 概要
- 市場に影響を与える主な要因
- 市場促進要因
- 市場抑制要因
- 市場機会
- 市場の課題
- ポーターのファイブフォース分析
第4章 世界市場:配信モード別
- 世界のクラウドベース市場:地域別
- 世界のウェブベース市場:地域別
第5章 世界市場:最終用途別
- 世界の病院市場:地域別
- 世界のクリニック市場:地域別
- 世界のその他の最終用途市場:地域別
第6章 世界市場:インターフェース別
- 世界のモバイル/タブレット市場:地域別
- 世界のデスクトップ/ラップトップ市場:地域別
第7章 世界市場:地域別
- 北米
- 北米の市場:国別
- 米国
- カナダ
- メキシコ
- その他北米地域
- 北米の市場:国別
- 欧州
- 欧州の市場:国別
- ドイツ
- 英国
- フランス
- ロシア
- スペイン
- イタリア
- その他欧州地域
- 欧州の市場:国別
- アジア太平洋地域
- アジア太平洋の市場:国別
- 中国
- 日本
- インド
- 韓国
- シンガポール
- マレーシア
- その他アジア太平洋地域
- アジア太平洋の市場:国別
- ラテンアメリカ・中東・アフリカ
- ラテンアメリカ・中東・アフリカの市場:国別
- ブラジル
- アルゼンチン
- アラブ首長国連邦
- サウジアラビア
- 南アフリカ
- ナイジェリア
- その他ラテンアメリカ・中東・アフリカ地域
- ラテンアメリカ・中東・アフリカの市場:国別
第8章 企業プロファイル
- WebPT, Inc
- SimplePractice, LLC
- ClinicSource
- Net Health Systems, Inc
- Planetrehab Inc
- HENO
- Fusion Web Clinic, Inc
- Care Patron Limited
- Axxess Technology Solutions, Inc
- AdvancedMD, Inc(Global Payments Inc.)
第9章 作業療法ソフトウェア市場の成功必須条件
LIST OF TABLES
- TABLE 1 Global Occupational Therapy Software Market, 2020 - 2023, USD Thousands
- TABLE 2 Global Occupational Therapy Software Market, 2024 - 2031, USD Thousands
- TABLE 3 Global Occupational Therapy Software Market by Delivery Mode, 2020 - 2023, USD Thousands
- TABLE 4 Global Occupational Therapy Software Market by Delivery Mode, 2024 - 2031, USD Thousands
- TABLE 5 Global Cloud-based Market by Region, 2020 - 2023, USD Thousands
- TABLE 6 Global Cloud-based Market by Region, 2024 - 2031, USD Thousands
- TABLE 7 Global Web-based Market by Region, 2020 - 2023, USD Thousands
- TABLE 8 Global Web-based Market by Region, 2024 - 2031, USD Thousands
- TABLE 9 Global Occupational Therapy Software Market by End-use, 2020 - 2023, USD Thousands
- TABLE 10 Global Occupational Therapy Software Market by End-use, 2024 - 2031, USD Thousands
- TABLE 11 Global Hospitals Market by Region, 2020 - 2023, USD Thousands
- TABLE 12 Global Hospitals Market by Region, 2024 - 2031, USD Thousands
- TABLE 13 Global Clinics Market by Region, 2020 - 2023, USD Thousands
- TABLE 14 Global Clinics Market by Region, 2024 - 2031, USD Thousands
- TABLE 15 Global Other End-use Market by Region, 2020 - 2023, USD Thousands
- TABLE 16 Global Other End-use Market by Region, 2024 - 2031, USD Thousands
- TABLE 17 Global Occupational Therapy Software Market by Interface, 2020 - 2023, USD Thousands
- TABLE 18 Global Occupational Therapy Software Market by Interface, 2024 - 2031, USD Thousands
- TABLE 19 Global Mobile/Tablets Market by Region, 2020 - 2023, USD Thousands
- TABLE 20 Global Mobile/Tablets Market by Region, 2024 - 2031, USD Thousands
- TABLE 21 Global Desktops/Laptops Market by Region, 2020 - 2023, USD Thousands
- TABLE 22 Global Desktops/Laptops Market by Region, 2024 - 2031, USD Thousands
- TABLE 23 Global Occupational Therapy Software Market by Region, 2020 - 2023, USD Thousands
- TABLE 24 Global Occupational Therapy Software Market by Region, 2024 - 2031, USD Thousands
- TABLE 25 North America Occupational Therapy Software Market, 2020 - 2023, USD Thousands
- TABLE 26 North America Occupational Therapy Software Market, 2024 - 2031, USD Thousands
- TABLE 27 North America Occupational Therapy Software Market by Delivery Mode, 2020 - 2023, USD Thousands
- TABLE 28 North America Occupational Therapy Software Market by Delivery Mode, 2024 - 2031, USD Thousands
- TABLE 29 North America Cloud-based Market by Region, 2020 - 2023, USD Thousands
- TABLE 30 North America Cloud-based Market by Region, 2024 - 2031, USD Thousands
- TABLE 31 North America Web-based Market by Region, 2020 - 2023, USD Thousands
- TABLE 32 North America Web-based Market by Region, 2024 - 2031, USD Thousands
- TABLE 33 North America Occupational Therapy Software Market by End-use, 2020 - 2023, USD Thousands
- TABLE 34 North America Occupational Therapy Software Market by End-use, 2024 - 2031, USD Thousands
- TABLE 35 North America Hospitals Market by Country, 2020 - 2023, USD Thousands
- TABLE 36 North America Hospitals Market by Country, 2024 - 2031, USD Thousands
- TABLE 37 North America Clinics Market by Country, 2020 - 2023, USD Thousands
- TABLE 38 North America Clinics Market by Country, 2024 - 2031, USD Thousands
- TABLE 39 North America Other End-use Market by Country, 2020 - 2023, USD Thousands
- TABLE 40 North America Other End-use Market by Country, 2024 - 2031, USD Thousands
- TABLE 41 North America Occupational Therapy Software Market by Interface, 2020 - 2023, USD Thousands
- TABLE 42 North America Occupational Therapy Software Market by Interface, 2024 - 2031, USD Thousands
- TABLE 43 North America Mobile/Tablets Market by Country, 2020 - 2023, USD Thousands
- TABLE 44 North America Mobile/Tablets Market by Country, 2024 - 2031, USD Thousands
- TABLE 45 North America Desktops/Laptops Market by Country, 2020 - 2023, USD Thousands
- TABLE 46 North America Desktops/Laptops Market by Country, 2024 - 2031, USD Thousands
- TABLE 47 North America Occupational Therapy Software Market by Country, 2020 - 2023, USD Thousands
- TABLE 48 North America Occupational Therapy Software Market by Country, 2024 - 2031, USD Thousands
- TABLE 49 US Occupational Therapy Software Market, 2020 - 2023, USD Thousands
- TABLE 50 US Occupational Therapy Software Market, 2024 - 2031, USD Thousands
- TABLE 51 US Occupational Therapy Software Market by Delivery Mode, 2020 - 2023, USD Thousands
- TABLE 52 US Occupational Therapy Software Market by Delivery Mode, 2024 - 2031, USD Thousands
- TABLE 53 US Occupational Therapy Software Market by End-use, 2020 - 2023, USD Thousands
- TABLE 54 US Occupational Therapy Software Market by End-use, 2024 - 2031, USD Thousands
- TABLE 55 US Occupational Therapy Software Market by Interface, 2020 - 2023, USD Thousands
- TABLE 56 US Occupational Therapy Software Market by Interface, 2024 - 2031, USD Thousands
- TABLE 57 Canada Occupational Therapy Software Market, 2020 - 2023, USD Thousands
- TABLE 58 Canada Occupational Therapy Software Market, 2024 - 2031, USD Thousands
- TABLE 59 Canada Occupational Therapy Software Market by Delivery Mode, 2020 - 2023, USD Thousands
- TABLE 60 Canada Occupational Therapy Software Market by Delivery Mode, 2024 - 2031, USD Thousands
- TABLE 61 Canada Occupational Therapy Software Market by End-use, 2020 - 2023, USD Thousands
- TABLE 62 Canada Occupational Therapy Software Market by End-use, 2024 - 2031, USD Thousands
- TABLE 63 Canada Occupational Therapy Software Market by Interface, 2020 - 2023, USD Thousands
- TABLE 64 Canada Occupational Therapy Software Market by Interface, 2024 - 2031, USD Thousands
- TABLE 65 Mexico Occupational Therapy Software Market, 2020 - 2023, USD Thousands
- TABLE 66 Mexico Occupational Therapy Software Market, 2024 - 2031, USD Thousands
- TABLE 67 Mexico Occupational Therapy Software Market by Delivery Mode, 2020 - 2023, USD Thousands
- TABLE 68 Mexico Occupational Therapy Software Market by Delivery Mode, 2024 - 2031, USD Thousands
- TABLE 69 Mexico Occupational Therapy Software Market by End-use, 2020 - 2023, USD Thousands
- TABLE 70 Mexico Occupational Therapy Software Market by End-use, 2024 - 2031, USD Thousands
- TABLE 71 Mexico Occupational Therapy Software Market by Interface, 2020 - 2023, USD Thousands
- TABLE 72 Mexico Occupational Therapy Software Market by Interface, 2024 - 2031, USD Thousands
- TABLE 73 Rest of North America Occupational Therapy Software Market, 2020 - 2023, USD Thousands
- TABLE 74 Rest of North America Occupational Therapy Software Market, 2024 - 2031, USD Thousands
- TABLE 75 Rest of North America Occupational Therapy Software Market by Delivery Mode, 2020 - 2023, USD Thousands
- TABLE 76 Rest of North America Occupational Therapy Software Market by Delivery Mode, 2024 - 2031, USD Thousands
- TABLE 77 Rest of North America Occupational Therapy Software Market by End-use, 2020 - 2023, USD Thousands
- TABLE 78 Rest of North America Occupational Therapy Software Market by End-use, 2024 - 2031, USD Thousands
- TABLE 79 Rest of North America Occupational Therapy Software Market by Interface, 2020 - 2023, USD Thousands
- TABLE 80 Rest of North America Occupational Therapy Software Market by Interface, 2024 - 2031, USD Thousands
- TABLE 81 Europe Occupational Therapy Software Market, 2020 - 2023, USD Thousands
- TABLE 82 Europe Occupational Therapy Software Market, 2024 - 2031, USD Thousands
- TABLE 83 Europe Occupational Therapy Software Market by Delivery Mode, 2020 - 2023, USD Thousands
- TABLE 84 Europe Occupational Therapy Software Market by Delivery Mode, 2024 - 2031, USD Thousands
- TABLE 85 Europe Cloud-based Market by Country, 2020 - 2023, USD Thousands
- TABLE 86 Europe Cloud-based Market by Country, 2024 - 2031, USD Thousands
- TABLE 87 Europe Web-based Market by Country, 2020 - 2023, USD Thousands
- TABLE 88 Europe Web-based Market by Country, 2024 - 2031, USD Thousands
- TABLE 89 Europe Occupational Therapy Software Market by End-use, 2020 - 2023, USD Thousands
- TABLE 90 Europe Occupational Therapy Software Market by End-use, 2024 - 2031, USD Thousands
- TABLE 91 Europe Hospitals Market by Country, 2020 - 2023, USD Thousands
- TABLE 92 Europe Hospitals Market by Country, 2024 - 2031, USD Thousands
- TABLE 93 Europe Clinics Market by Country, 2020 - 2023, USD Thousands
- TABLE 94 Europe Clinics Market by Country, 2024 - 2031, USD Thousands
- TABLE 95 Europe Other End-use Market by Country, 2020 - 2023, USD Thousands
- TABLE 96 Europe Other End-use Market by Country, 2024 - 2031, USD Thousands
- TABLE 97 Europe Occupational Therapy Software Market by Interface, 2020 - 2023, USD Thousands
- TABLE 98 Europe Occupational Therapy Software Market by Interface, 2024 - 2031, USD Thousands
- TABLE 99 Europe Mobile/Tablets Market by Country, 2020 - 2023, USD Thousands
- TABLE 100 Europe Mobile/Tablets Market by Country, 2024 - 2031, USD Thousands
- TABLE 101 Europe Desktops/Laptops Market by Country, 2020 - 2023, USD Thousands
- TABLE 102 Europe Desktops/Laptops Market by Country, 2024 - 2031, USD Thousands
- TABLE 103 Europe Occupational Therapy Software Market by Country, 2020 - 2023, USD Thousands
- TABLE 104 Europe Occupational Therapy Software Market by Country, 2024 - 2031, USD Thousands
- TABLE 105 Germany Occupational Therapy Software Market, 2020 - 2023, USD Thousands
- TABLE 106 Germany Occupational Therapy Software Market, 2024 - 2031, USD Thousands
- TABLE 107 Germany Occupational Therapy Software Market by Delivery Mode, 2020 - 2023, USD Thousands
- TABLE 108 Germany Occupational Therapy Software Market by Delivery Mode, 2024 - 2031, USD Thousands
- TABLE 109 Germany Occupational Therapy Software Market by End-use, 2020 - 2023, USD Thousands
- TABLE 110 Germany Occupational Therapy Software Market by End-use, 2024 - 2031, USD Thousands
- TABLE 111 Germany Occupational Therapy Software Market by Interface, 2020 - 2023, USD Thousands
- TABLE 112 Germany Occupational Therapy Software Market by Interface, 2024 - 2031, USD Thousands
- TABLE 113 UK Occupational Therapy Software Market, 2020 - 2023, USD Thousands
- TABLE 114 UK Occupational Therapy Software Market, 2024 - 2031, USD Thousands
- TABLE 115 UK Occupational Therapy Software Market by Delivery Mode, 2020 - 2023, USD Thousands
- TABLE 116 UK Occupational Therapy Software Market by Delivery Mode, 2024 - 2031, USD Thousands
- TABLE 117 UK Occupational Therapy Software Market by End-use, 2020 - 2023, USD Thousands
- TABLE 118 UK Occupational Therapy Software Market by End-use, 2024 - 2031, USD Thousands
- TABLE 119 UK Occupational Therapy Software Market by Interface, 2020 - 2023, USD Thousands
- TABLE 120 UK Occupational Therapy Software Market by Interface, 2024 - 2031, USD Thousands
- TABLE 121 France Occupational Therapy Software Market, 2020 - 2023, USD Thousands
- TABLE 122 France Occupational Therapy Software Market, 2024 - 2031, USD Thousands
- TABLE 123 France Occupational Therapy Software Market by Delivery Mode, 2020 - 2023, USD Thousands
- TABLE 124 France Occupational Therapy Software Market by Delivery Mode, 2024 - 2031, USD Thousands
- TABLE 125 France Occupational Therapy Software Market by End-use, 2020 - 2023, USD Thousands
- TABLE 126 France Occupational Therapy Software Market by End-use, 2024 - 2031, USD Thousands
- TABLE 127 France Occupational Therapy Software Market by Interface, 2020 - 2023, USD Thousands
- TABLE 128 France Occupational Therapy Software Market by Interface, 2024 - 2031, USD Thousands
- TABLE 129 Russia Occupational Therapy Software Market, 2020 - 2023, USD Thousands
- TABLE 130 Russia Occupational Therapy Software Market, 2024 - 2031, USD Thousands
- TABLE 131 Russia Occupational Therapy Software Market by Delivery Mode, 2020 - 2023, USD Thousands
- TABLE 132 Russia Occupational Therapy Software Market by Delivery Mode, 2024 - 2031, USD Thousands
- TABLE 133 Russia Occupational Therapy Software Market by End-use, 2020 - 2023, USD Thousands
- TABLE 134 Russia Occupational Therapy Software Market by End-use, 2024 - 2031, USD Thousands
- TABLE 135 Russia Occupational Therapy Software Market by Interface, 2020 - 2023, USD Thousands
- TABLE 136 Russia Occupational Therapy Software Market by Interface, 2024 - 2031, USD Thousands
- TABLE 137 Spain Occupational Therapy Software Market, 2020 - 2023, USD Thousands
- TABLE 138 Spain Occupational Therapy Software Market, 2024 - 2031, USD Thousands
- TABLE 139 Spain Occupational Therapy Software Market by Delivery Mode, 2020 - 2023, USD Thousands
- TABLE 140 Spain Occupational Therapy Software Market by Delivery Mode, 2024 - 2031, USD Thousands
- TABLE 141 Spain Occupational Therapy Software Market by End-use, 2020 - 2023, USD Thousands
- TABLE 142 Spain Occupational Therapy Software Market by End-use, 2024 - 2031, USD Thousands
- TABLE 143 Spain Occupational Therapy Software Market by Interface, 2020 - 2023, USD Thousands
- TABLE 144 Spain Occupational Therapy Software Market by Interface, 2024 - 2031, USD Thousands
- TABLE 145 Italy Occupational Therapy Software Market, 2020 - 2023, USD Thousands
- TABLE 146 Italy Occupational Therapy Software Market, 2024 - 2031, USD Thousands
- TABLE 147 Italy Occupational Therapy Software Market by Delivery Mode, 2020 - 2023, USD Thousands
- TABLE 148 Italy Occupational Therapy Software Market by Delivery Mode, 2024 - 2031, USD Thousands
- TABLE 149 Italy Occupational Therapy Software Market by End-use, 2020 - 2023, USD Thousands
- TABLE 150 Italy Occupational Therapy Software Market by End-use, 2024 - 2031, USD Thousands
- TABLE 151 Italy Occupational Therapy Software Market by Interface, 2020 - 2023, USD Thousands
- TABLE 152 Italy Occupational Therapy Software Market by Interface, 2024 - 2031, USD Thousands
- TABLE 153 Rest of Europe Occupational Therapy Software Market, 2020 - 2023, USD Thousands
- TABLE 154 Rest of Europe Occupational Therapy Software Market, 2024 - 2031, USD Thousands
- TABLE 155 Rest of Europe Occupational Therapy Software Market by Delivery Mode, 2020 - 2023, USD Thousands
- TABLE 156 Rest of Europe Occupational Therapy Software Market by Delivery Mode, 2024 - 2031, USD Thousands
- TABLE 157 Rest of Europe Occupational Therapy Software Market by End-use, 2020 - 2023, USD Thousands
- TABLE 158 Rest of Europe Occupational Therapy Software Market by End-use, 2024 - 2031, USD Thousands
- TABLE 159 Rest of Europe Occupational Therapy Software Market by Interface, 2020 - 2023, USD Thousands
- TABLE 160 Rest of Europe Occupational Therapy Software Market by Interface, 2024 - 2031, USD Thousands
- TABLE 161 Asia Pacific Occupational Therapy Software Market, 2020 - 2023, USD Thousands
- TABLE 162 Asia Pacific Occupational Therapy Software Market, 2024 - 2031, USD Thousands
- TABLE 163 Asia Pacific Occupational Therapy Software Market by Delivery Mode, 2020 - 2023, USD Thousands
- TABLE 164 Asia Pacific Occupational Therapy Software Market by Delivery Mode, 2024 - 2031, USD Thousands
- TABLE 165 Asia Pacific Cloud-based Market by Country, 2020 - 2023, USD Thousands
- TABLE 166 Asia Pacific Cloud-based Market by Country, 2024 - 2031, USD Thousands
- TABLE 167 Asia Pacific Web-based Market by Country, 2020 - 2023, USD Thousands
- TABLE 168 Asia Pacific Web-based Market by Country, 2024 - 2031, USD Thousands
- TABLE 169 Asia Pacific Occupational Therapy Software Market by End-use, 2020 - 2023, USD Thousands
- TABLE 170 Asia Pacific Occupational Therapy Software Market by End-use, 2024 - 2031, USD Thousands
- TABLE 171 Asia Pacific Hospitals Market by Country, 2020 - 2023, USD Thousands
- TABLE 172 Asia Pacific Hospitals Market by Country, 2024 - 2031, USD Thousands
- TABLE 173 Asia Pacific Clinics Market by Country, 2020 - 2023, USD Thousands
- TABLE 174 Asia Pacific Clinics Market by Country, 2024 - 2031, USD Thousands
- TABLE 175 Asia Pacific Other End-use Market by Country, 2020 - 2023, USD Thousands
- TABLE 176 Asia Pacific Other End-use Market by Country, 2024 - 2031, USD Thousands
- TABLE 177 Asia Pacific Occupational Therapy Software Market by Interface, 2020 - 2023, USD Thousands
- TABLE 178 Asia Pacific Occupational Therapy Software Market by Interface, 2024 - 2031, USD Thousands
- TABLE 179 Asia Pacific Mobile/Tablets Market by Country, 2020 - 2023, USD Thousands
- TABLE 180 Asia Pacific Mobile/Tablets Market by Country, 2024 - 2031, USD Thousands
- TABLE 181 Asia Pacific Desktops/Laptops Market by Country, 2020 - 2023, USD Thousands
- TABLE 182 Asia Pacific Desktops/Laptops Market by Country, 2024 - 2031, USD Thousands
- TABLE 183 Asia Pacific Occupational Therapy Software Market by Country, 2020 - 2023, USD Thousands
- TABLE 184 Asia Pacific Occupational Therapy Software Market by Country, 2024 - 2031, USD Thousands
- TABLE 185 China Occupational Therapy Software Market, 2020 - 2023, USD Thousands
- TABLE 186 China Occupational Therapy Software Market, 2024 - 2031, USD Thousands
- TABLE 187 China Occupational Therapy Software Market by Delivery Mode, 2020 - 2023, USD Thousands
- TABLE 188 China Occupational Therapy Software Market by Delivery Mode, 2024 - 2031, USD Thousands
- TABLE 189 China Occupational Therapy Software Market by End-use, 2020 - 2023, USD Thousands
- TABLE 190 China Occupational Therapy Software Market by End-use, 2024 - 2031, USD Thousands
- TABLE 191 China Occupational Therapy Software Market by Interface, 2020 - 2023, USD Thousands
- TABLE 192 China Occupational Therapy Software Market by Interface, 2024 - 2031, USD Thousands
- TABLE 193 Japan Occupational Therapy Software Market, 2020 - 2023, USD Thousands
- TABLE 194 Japan Occupational Therapy Software Market, 2024 - 2031, USD Thousands
- TABLE 195 Japan Occupational Therapy Software Market by Delivery Mode, 2020 - 2023, USD Thousands
- TABLE 196 Japan Occupational Therapy Software Market by Delivery Mode, 2024 - 2031, USD Thousands
- TABLE 197 Japan Occupational Therapy Software Market by End-use, 2020 - 2023, USD Thousands
- TABLE 198 Japan Occupational Therapy Software Market by End-use, 2024 - 2031, USD Thousands
- TABLE 199 Japan Occupational Therapy Software Market by Interface, 2020 - 2023, USD Thousands
- TABLE 200 Japan Occupational Therapy Software Market by Interface, 2024 - 2031, USD Thousands
- TABLE 201 India Occupational Therapy Software Market, 2020 - 2023, USD Thousands
- TABLE 202 India Occupational Therapy Software Market, 2024 - 2031, USD Thousands
- TABLE 203 India Occupational Therapy Software Market by Delivery Mode, 2020 - 2023, USD Thousands
- TABLE 204 India Occupational Therapy Software Market by Delivery Mode, 2024 - 2031, USD Thousands
- TABLE 205 India Occupational Therapy Software Market by End-use, 2020 - 2023, USD Thousands
- TABLE 206 India Occupational Therapy Software Market by End-use, 2024 - 2031, USD Thousands
- TABLE 207 India Occupational Therapy Software Market by Interface, 2020 - 2023, USD Thousands
- TABLE 208 India Occupational Therapy Software Market by Interface, 2024 - 2031, USD Thousands
- TABLE 209 South Korea Occupational Therapy Software Market, 2020 - 2023, USD Thousands
- TABLE 210 South Korea Occupational Therapy Software Market, 2024 - 2031, USD Thousands
- TABLE 211 South Korea Occupational Therapy Software Market by Delivery Mode, 2020 - 2023, USD Thousands
- TABLE 212 South Korea Occupational Therapy Software Market by Delivery Mode, 2024 - 2031, USD Thousands
- TABLE 213 South Korea Occupational Therapy Software Market by End-use, 2020 - 2023, USD Thousands
- TABLE 214 South Korea Occupational Therapy Software Market by End-use, 2024 - 2031, USD Thousands
- TABLE 215 South Korea Occupational Therapy Software Market by Interface, 2020 - 2023, USD Thousands
- TABLE 216 South Korea Occupational Therapy Software Market by Interface, 2024 - 2031, USD Thousands
- TABLE 217 Singapore Occupational Therapy Software Market, 2020 - 2023, USD Thousands
- TABLE 218 Singapore Occupational Therapy Software Market, 2024 - 2031, USD Thousands
- TABLE 219 Singapore Occupational Therapy Software Market by Delivery Mode, 2020 - 2023, USD Thousands
- TABLE 220 Singapore Occupational Therapy Software Market by Delivery Mode, 2024 - 2031, USD Thousands
- TABLE 221 Singapore Occupational Therapy Software Market by End-use, 2020 - 2023, USD Thousands
- TABLE 222 Singapore Occupational Therapy Software Market by End-use, 2024 - 2031, USD Thousands
- TABLE 223 Singapore Occupational Therapy Software Market by Interface, 2020 - 2023, USD Thousands
- TABLE 224 Singapore Occupational Therapy Software Market by Interface, 2024 - 2031, USD Thousands
- TABLE 225 Malaysia Occupational Therapy Software Market, 2020 - 2023, USD Thousands
- TABLE 226 Malaysia Occupational Therapy Software Market, 2024 - 2031, USD Thousands
- TABLE 227 Malaysia Occupational Therapy Software Market by Delivery Mode, 2020 - 2023, USD Thousands
- TABLE 228 Malaysia Occupational Therapy Software Market by Delivery Mode, 2024 - 2031, USD Thousands
- TABLE 229 Malaysia Occupational Therapy Software Market by End-use, 2020 - 2023, USD Thousands
- TABLE 230 Malaysia Occupational Therapy Software Market by End-use, 2024 - 2031, USD Thousands
- TABLE 231 Malaysia Occupational Therapy Software Market by Interface, 2020 - 2023, USD Thousands
- TABLE 232 Malaysia Occupational Therapy Software Market by Interface, 2024 - 2031, USD Thousands
- TABLE 233 Rest of Asia Pacific Occupational Therapy Software Market, 2020 - 2023, USD Thousands
- TABLE 234 Rest of Asia Pacific Occupational Therapy Software Market, 2024 - 2031, USD Thousands
- TABLE 235 Rest of Asia Pacific Occupational Therapy Software Market by Delivery Mode, 2020 - 2023, USD Thousands
- TABLE 236 Rest of Asia Pacific Occupational Therapy Software Market by Delivery Mode, 2024 - 2031, USD Thousands
- TABLE 237 Rest of Asia Pacific Occupational Therapy Software Market by End-use, 2020 - 2023, USD Thousands
- TABLE 238 Rest of Asia Pacific Occupational Therapy Software Market by End-use, 2024 - 2031, USD Thousands
- TABLE 239 Rest of Asia Pacific Occupational Therapy Software Market by Interface, 2020 - 2023, USD Thousands
- TABLE 240 Rest of Asia Pacific Occupational Therapy Software Market by Interface, 2024 - 2031, USD Thousands
- TABLE 241 LAMEA Occupational Therapy Software Market, 2020 - 2023, USD Thousands
- TABLE 242 LAMEA Occupational Therapy Software Market, 2024 - 2031, USD Thousands
- TABLE 243 LAMEA Occupational Therapy Software Market by Delivery Mode, 2020 - 2023, USD Thousands
- TABLE 244 LAMEA Occupational Therapy Software Market by Delivery Mode, 2024 - 2031, USD Thousands
- TABLE 245 LAMEA Cloud-based Market by Country, 2020 - 2023, USD Thousands
- TABLE 246 LAMEA Cloud-based Market by Country, 2024 - 2031, USD Thousands
- TABLE 247 LAMEA Web-based Market by Country, 2020 - 2023, USD Thousands
- TABLE 248 LAMEA Web-based Market by Country, 2024 - 2031, USD Thousands
- TABLE 249 LAMEA Occupational Therapy Software Market by End-use, 2020 - 2023, USD Thousands
- TABLE 250 LAMEA Occupational Therapy Software Market by End-use, 2024 - 2031, USD Thousands
- TABLE 251 LAMEA Hospitals Market by Country, 2020 - 2023, USD Thousands
- TABLE 252 LAMEA Hospitals Market by Country, 2024 - 2031, USD Thousands
- TABLE 253 LAMEA Clinics Market by Country, 2020 - 2023, USD Thousands
- TABLE 254 LAMEA Clinics Market by Country, 2024 - 2031, USD Thousands
- TABLE 255 LAMEA Other End-use Market by Country, 2020 - 2023, USD Thousands
- TABLE 256 LAMEA Other End-use Market by Country, 2024 - 2031, USD Thousands
- TABLE 257 LAMEA Occupational Therapy Software Market by Interface, 2020 - 2023, USD Thousands
- TABLE 258 LAMEA Occupational Therapy Software Market by Interface, 2024 - 2031, USD Thousands
- TABLE 259 LAMEA Mobile/Tablets Market by Country, 2020 - 2023, USD Thousands
- TABLE 260 LAMEA Mobile/Tablets Market by Country, 2024 - 2031, USD Thousands
- TABLE 261 LAMEA Desktops/Laptops Market by Country, 2020 - 2023, USD Thousands
- TABLE 262 LAMEA Desktops/Laptops Market by Country, 2024 - 2031, USD Thousands
- TABLE 263 LAMEA Occupational Therapy Software Market by Country, 2020 - 2023, USD Thousands
- TABLE 264 LAMEA Occupational Therapy Software Market by Country, 2024 - 2031, USD Thousands
- TABLE 265 Brazil Occupational Therapy Software Market, 2020 - 2023, USD Thousands
- TABLE 266 Brazil Occupational Therapy Software Market, 2024 - 2031, USD Thousands
- TABLE 267 Brazil Occupational Therapy Software Market by Delivery Mode, 2020 - 2023, USD Thousands
- TABLE 268 Brazil Occupational Therapy Software Market by Delivery Mode, 2024 - 2031, USD Thousands
- TABLE 269 Brazil Occupational Therapy Software Market by End-use, 2020 - 2023, USD Thousands
- TABLE 270 Brazil Occupational Therapy Software Market by End-use, 2024 - 2031, USD Thousands
- TABLE 271 Brazil Occupational Therapy Software Market by Interface, 2020 - 2023, USD Thousands
- TABLE 272 Brazil Occupational Therapy Software Market by Interface, 2024 - 2031, USD Thousands
- TABLE 273 Argentina Occupational Therapy Software Market, 2020 - 2023, USD Thousands
- TABLE 274 Argentina Occupational Therapy Software Market, 2024 - 2031, USD Thousands
- TABLE 275 Argentina Occupational Therapy Software Market by Delivery Mode, 2020 - 2023, USD Thousands
- TABLE 276 Argentina Occupational Therapy Software Market by Delivery Mode, 2024 - 2031, USD Thousands
- TABLE 277 Argentina Occupational Therapy Software Market by End-use, 2020 - 2023, USD Thousands
- TABLE 278 Argentina Occupational Therapy Software Market by End-use, 2024 - 2031, USD Thousands
- TABLE 279 Argentina Occupational Therapy Software Market by Interface, 2020 - 2023, USD Thousands
- TABLE 280 Argentina Occupational Therapy Software Market by Interface, 2024 - 2031, USD Thousands
- TABLE 281 UAE Occupational Therapy Software Market, 2020 - 2023, USD Thousands
- TABLE 282 UAE Occupational Therapy Software Market, 2024 - 2031, USD Thousands
- TABLE 283 UAE Occupational Therapy Software Market by Delivery Mode, 2020 - 2023, USD Thousands
- TABLE 284 UAE Occupational Therapy Software Market by Delivery Mode, 2024 - 2031, USD Thousands
- TABLE 285 UAE Occupational Therapy Software Market by End-use, 2020 - 2023, USD Thousands
- TABLE 286 UAE Occupational Therapy Software Market by End-use, 2024 - 2031, USD Thousands
- TABLE 287 UAE Occupational Therapy Software Market by Interface, 2020 - 2023, USD Thousands
- TABLE 288 UAE Occupational Therapy Software Market by Interface, 2024 - 2031, USD Thousands
- TABLE 289 Saudi Arabia Occupational Therapy Software Market, 2020 - 2023, USD Thousands
- TABLE 290 Saudi Arabia Occupational Therapy Software Market, 2024 - 2031, USD Thousands
- TABLE 291 Saudi Arabia Occupational Therapy Software Market by Delivery Mode, 2020 - 2023, USD Thousands
- TABLE 292 Saudi Arabia Occupational Therapy Software Market by Delivery Mode, 2024 - 2031, USD Thousands
- TABLE 293 Saudi Arabia Occupational Therapy Software Market by End-use, 2020 - 2023, USD Thousands
- TABLE 294 Saudi Arabia Occupational Therapy Software Market by End-use, 2024 - 2031, USD Thousands
- TABLE 295 Saudi Arabia Occupational Therapy Software Market by Interface, 2020 - 2023, USD Thousands
- TABLE 296 Saudi Arabia Occupational Therapy Software Market by Interface, 2024 - 2031, USD Thousands
- TABLE 297 South Africa Occupational Therapy Software Market, 2020 - 2023, USD Thousands
- TABLE 298 South Africa Occupational Therapy Software Market, 2024 - 2031, USD Thousands
- TABLE 299 South Africa Occupational Therapy Software Market by Delivery Mode, 2020 - 2023, USD Thousands
- TABLE 300 South Africa Occupational Therapy Software Market by Delivery Mode, 2024 - 2031, USD Thousands
- TABLE 301 South Africa Occupational Therapy Software Market by End-use, 2020 - 2023, USD Thousands
- TABLE 302 South Africa Occupational Therapy Software Market by End-use, 2024 - 2031, USD Thousands
- TABLE 303 South Africa Occupational Therapy Software Market by Interface, 2020 - 2023, USD Thousands
- TABLE 304 South Africa Occupational Therapy Software Market by Interface, 2024 - 2031, USD Thousands
- TABLE 305 Nigeria Occupational Therapy Software Market, 2020 - 2023, USD Thousands
- TABLE 306 Nigeria Occupational Therapy Software Market, 2024 - 2031, USD Thousands
- TABLE 307 Nigeria Occupational Therapy Software Market by Delivery Mode, 2020 - 2023, USD Thousands
- TABLE 308 Nigeria Occupational Therapy Software Market by Delivery Mode, 2024 - 2031, USD Thousands
- TABLE 309 Nigeria Occupational Therapy Software Market by End-use, 2020 - 2023, USD Thousands
- TABLE 310 Nigeria Occupational Therapy Software Market by End-use, 2024 - 2031, USD Thousands
- TABLE 311 Nigeria Occupational Therapy Software Market by Interface, 2020 - 2023, USD Thousands
- TABLE 312 Nigeria Occupational Therapy Software Market by Interface, 2024 - 2031, USD Thousands
- TABLE 313 Rest of LAMEA Occupational Therapy Software Market, 2020 - 2023, USD Thousands
- TABLE 314 Rest of LAMEA Occupational Therapy Software Market, 2024 - 2031, USD Thousands
- TABLE 315 Rest of LAMEA Occupational Therapy Software Market by Delivery Mode, 2020 - 2023, USD Thousands
- TABLE 316 Rest of LAMEA Occupational Therapy Software Market by Delivery Mode, 2024 - 2031, USD Thousands
- TABLE 317 Rest of LAMEA Occupational Therapy Software Market by End-use, 2020 - 2023, USD Thousands
- TABLE 318 Rest of LAMEA Occupational Therapy Software Market by End-use, 2024 - 2031, USD Thousands
- TABLE 319 Rest of LAMEA Occupational Therapy Software Market by Interface, 2020 - 2023, USD Thousands
- TABLE 320 Rest of LAMEA Occupational Therapy Software Market by Interface, 2024 - 2031, USD Thousands
- TABLE 321 Key Information - WebPT, Inc.
- TABLE 322 Key Information - SimplePractice, LLC
- TABLE 323 Key Information - ClinicSource
- TABLE 324 Key Information - Net Health Systems, Inc.
- TABLE 325 Key Information - Planetrehab Inc.
- TABLE 326 Key Information - HENO
- TABLE 327 Key Information - Fusion Web Clinic, Inc.
- TABLE 328 Key Information - Care Patron Limited
- TABLE 329 Key Information - Axxess Technology Solutions, Inc.
- TABLE 330 Key Information - AdvancedMD, Inc.
The Global Occupational Therapy Software Market size is expected to reach $386.57 million by 2031, rising at a market growth of 11.0% CAGR during the forecast period.
The North America region witnessed 48% revenue share in this market in 2023. North America, particularly the United States and Canada, continues to lead in adopting digital health technologies, including this software. Factors such as the presence of advanced healthcare infrastructure, the growing demand for telehealth services, and an increasing focus on improving patient outcomes have contributed to the dominance of this region.
The growing demand for remote healthcare services is a key driver of this market. With technological advancements, telemedicine has become a critical tool for providing healthcare services remotely, making occupational therapy more accessible to patients in rural or underserved areas. This software facilitates this transition by enabling therapists to deliver virtual consultations, track patient progress, and provide therapeutic exercises through online platforms. Thus, rising demand for remote healthcare services and telemedicine integration drives the market's growth.
Additionally, Technological advancements in health IT and digital therapies are reshaping the occupational therapy landscape, making it easier for therapists to deliver more effective treatments. Integrating artificial intelligence (AI), machine learning (ML), and data analytics into this software has revolutionized treatment planning and patient monitoring. AI algorithms can assist in predicting patient outcomes, recommending personalized interventions, and analyzing patient data to adjust therapy plans in real-time. In conclusion, technological advancements in health IT and digital therapies drive the market's growth.
However, One of the primary restraints in adopting this software is the high initial investment and implementation costs for healthcare providers. Many healthcare institutions, especially smaller clinics or individual practitioners, may struggle to afford the upfront costs of implementing advanced software solutions. This includes not only the purchase of the software itself but also the necessary infrastructure, training for staff, and integration with existing systems. Hence, high initial investment and implementation costs for healthcare providers hamper the market's growth.
Moreover, During the pandemic, many healthcare facilities faced operational disruptions, which temporarily reduced the demand for occupational therapy services and, consequently, this software. The lockdowns and social distancing measures caused delays in adopting and implementing new occupational therapy software in healthcare centers, rehabilitation facilities, and clinics. Financial uncertainty and budget cuts faced by healthcare providers during the pandemic led to delays or cancellations of software purchases, affecting the market's growth. Thus, COVID-19 had a negative impact on the market.
Delivery Mode Outlook
Based on delivery mode, the occupational therapy software market is divided into cloud-based and web-based. The web-based segment held 44% revenue share in this market in 2023. Web-based solutions are typically accessed through a web browser and installed on local healthcare facility servers. These solutions can offer high levels of customization and control over data, which can be critical for organizations with specific security and compliance requirements.
End-use Outlook
Based on end-use, the occupational therapy software market is categorized into hospitals, clinics, and others. The clinics segment witnessed 34% revenue share in this market in 2023. Clinics generally have a smaller patient volume than hospitals and demand effective tools for managing patient records, therapy sessions, and schedules. The adoption of this software in clinics has been driven by the need for streamlined operations and improved patient outcomes.
Interface Outlook
On the basis of interface, the occupational therapy software market is segmented into mobile/tablets and desktops/laptops. In 2023, the desktops/laptops segment attained 42% revenue share in this market. Desktops and laptops remain essential in clinical settings where more extensive data analysis, documentation, and patient management may be required. These devices provide a larger screen size and more powerful processing capabilities, which can be advantageous for therapists dealing with complex cases or those who prefer working in a traditional office environment.
Regional Outlook
Region-wise, the occupational therapy software market is analyzed across North America, Europe, Asia Pacific, and LAMEA. The Asia Pacific region generated 25% revenue share in this market in 2023. The Asia Pacific region is experiencing rapid growth in healthcare digitization, especially in countries like China, Japan, and India. The expanding healthcare infrastructure, increasing healthcare investments, and the rising adoption of digital health solutions have contributed to the growth of this software in this region.
List of Key Companies Profiled
- WebPT, Inc.
- SimplePractice, LLC
- ClinicSource
- Net Health Systems, Inc.
- Planetrehab Inc.
- HENO
- Fusion Web Clinic, Inc.
- Care Patron Limited
- Axxess Technology Solutions, Inc.
- AdvancedMD, Inc. (Global Payments Inc.)
Global Occupational Therapy Software Market Report Segmentation
By Delivery Mode
- Cloud-based
- Web-based
By End-use
- Hospitals
- Clinics
- Other End-use
By Interface
- Mobile/Tablets
- Desktops/Laptops
By Geography
- North America
- US
- Canada
- Mexico
- Rest of North America
- Europe
- Germany
- UK
- France
- Russia
- Spain
- Italy
- Rest of Europe
- Asia Pacific
- China
- Japan
- India
- South Korea
- Singapore
- Malaysia
- Rest of Asia Pacific
- LAMEA
- Brazil
- Argentina
- UAE
- Saudi Arabia
- South Africa
- Nigeria
- Rest of LAMEA
Table of Contents
Chapter 1. Market Scope & Methodology
- 1.1 Market Definition
- 1.2 Objectives
- 1.3 Market Scope
- 1.4 Segmentation
- 1.4.1 Global Occupational Therapy Software Market, by Delivery Mode
- 1.4.2 Global Occupational Therapy Software Market, by End-use
- 1.4.3 Global Occupational Therapy Software Market, by Interface
- 1.4.4 Global Occupational Therapy Software Market, by Geography
- 1.5 Methodology for the research
Chapter 2. Market at a Glance
- 2.1 Key Highlights
Chapter 3. Market Overview
- 3.1 Introduction
- 3.1.1 Overview
- 3.1.1.1 Market Composition and Scenario
- 3.1.1 Overview
- 3.2 Key Factors Impacting the Market
- 3.2.1 Market Drivers
- 3.2.2 Market Restraints
- 3.2.3 Market Opportunities
- 3.2.4 Market Challenges
- 3.3 Porter Five Forces Analysis
Chapter 4. Global Occupational Therapy Software Market by Delivery Mode
- 4.1 Global Cloud-based Market by Region
- 4.2 Global Web-based Market by Region
Chapter 5. Global Occupational Therapy Software Market by End-use
- 5.1 Global Hospitals Market by Region
- 5.2 Global Clinics Market by Region
- 5.3 Global Other End-use Market by Region
Chapter 6. Global Occupational Therapy Software Market by Interface
- 6.1 Global Mobile/Tablets Market by Region
- 6.2 Global Desktops/Laptops Market by Region
Chapter 7. Global Occupational Therapy Software Market by Region
- 7.1 North America Occupational Therapy Software Market
- 7.1.1 North America Occupational Therapy Software Market by Delivery Mode
- 7.1.1.1 North America Cloud-based Market by Region
- 7.1.1.2 North America Web-based Market by Region
- 7.1.2 North America Occupational Therapy Software Market by End-use
- 7.1.2.1 North America Hospitals Market by Country
- 7.1.2.2 North America Clinics Market by Country
- 7.1.2.3 North America Other End-use Market by Country
- 7.1.3 North America Occupational Therapy Software Market by Interface
- 7.1.3.1 North America Mobile/Tablets Market by Country
- 7.1.3.2 North America Desktops/Laptops Market by Country
- 7.1.4 North America Occupational Therapy Software Market by Country
- 7.1.4.1 US Occupational Therapy Software Market
- 7.1.4.1.1 US Occupational Therapy Software Market by Delivery Mode
- 7.1.4.1.2 US Occupational Therapy Software Market by End-use
- 7.1.4.1.3 US Occupational Therapy Software Market by Interface
- 7.1.4.2 Canada Occupational Therapy Software Market
- 7.1.4.2.1 Canada Occupational Therapy Software Market by Delivery Mode
- 7.1.4.2.2 Canada Occupational Therapy Software Market by End-use
- 7.1.4.2.3 Canada Occupational Therapy Software Market by Interface
- 7.1.4.3 Mexico Occupational Therapy Software Market
- 7.1.4.3.1 Mexico Occupational Therapy Software Market by Delivery Mode
- 7.1.4.3.2 Mexico Occupational Therapy Software Market by End-use
- 7.1.4.3.3 Mexico Occupational Therapy Software Market by Interface
- 7.1.4.4 Rest of North America Occupational Therapy Software Market
- 7.1.4.4.1 Rest of North America Occupational Therapy Software Market by Delivery Mode
- 7.1.4.4.2 Rest of North America Occupational Therapy Software Market by End-use
- 7.1.4.4.3 Rest of North America Occupational Therapy Software Market by Interface
- 7.1.4.1 US Occupational Therapy Software Market
- 7.1.1 North America Occupational Therapy Software Market by Delivery Mode
- 7.2 Europe Occupational Therapy Software Market
- 7.2.1 Europe Occupational Therapy Software Market by Delivery Mode
- 7.2.1.1 Europe Cloud-based Market by Country
- 7.2.1.2 Europe Web-based Market by Country
- 7.2.2 Europe Occupational Therapy Software Market by End-use
- 7.2.2.1 Europe Hospitals Market by Country
- 7.2.2.2 Europe Clinics Market by Country
- 7.2.2.3 Europe Other End-use Market by Country
- 7.2.3 Europe Occupational Therapy Software Market by Interface
- 7.2.3.1 Europe Mobile/Tablets Market by Country
- 7.2.3.2 Europe Desktops/Laptops Market by Country
- 7.2.4 Europe Occupational Therapy Software Market by Country
- 7.2.4.1 Germany Occupational Therapy Software Market
- 7.2.4.1.1 Germany Occupational Therapy Software Market by Delivery Mode
- 7.2.4.1.2 Germany Occupational Therapy Software Market by End-use
- 7.2.4.1.3 Germany Occupational Therapy Software Market by Interface
- 7.2.4.2 UK Occupational Therapy Software Market
- 7.2.4.2.1 UK Occupational Therapy Software Market by Delivery Mode
- 7.2.4.2.2 UK Occupational Therapy Software Market by End-use
- 7.2.4.2.3 UK Occupational Therapy Software Market by Interface
- 7.2.4.3 France Occupational Therapy Software Market
- 7.2.4.3.1 France Occupational Therapy Software Market by Delivery Mode
- 7.2.4.3.2 France Occupational Therapy Software Market by End-use
- 7.2.4.3.3 France Occupational Therapy Software Market by Interface
- 7.2.4.4 Russia Occupational Therapy Software Market
- 7.2.4.4.1 Russia Occupational Therapy Software Market by Delivery Mode
- 7.2.4.4.2 Russia Occupational Therapy Software Market by End-use
- 7.2.4.4.3 Russia Occupational Therapy Software Market by Interface
- 7.2.4.5 Spain Occupational Therapy Software Market
- 7.2.4.5.1 Spain Occupational Therapy Software Market by Delivery Mode
- 7.2.4.5.2 Spain Occupational Therapy Software Market by End-use
- 7.2.4.5.3 Spain Occupational Therapy Software Market by Interface
- 7.2.4.6 Italy Occupational Therapy Software Market
- 7.2.4.6.1 Italy Occupational Therapy Software Market by Delivery Mode
- 7.2.4.6.2 Italy Occupational Therapy Software Market by End-use
- 7.2.4.6.3 Italy Occupational Therapy Software Market by Interface
- 7.2.4.7 Rest of Europe Occupational Therapy Software Market
- 7.2.4.7.1 Rest of Europe Occupational Therapy Software Market by Delivery Mode
- 7.2.4.7.2 Rest of Europe Occupational Therapy Software Market by End-use
- 7.2.4.7.3 Rest of Europe Occupational Therapy Software Market by Interface
- 7.2.4.1 Germany Occupational Therapy Software Market
- 7.2.1 Europe Occupational Therapy Software Market by Delivery Mode
- 7.3 Asia Pacific Occupational Therapy Software Market
- 7.3.1 Asia Pacific Occupational Therapy Software Market by Delivery Mode
- 7.3.1.1 Asia Pacific Cloud-based Market by Country
- 7.3.1.2 Asia Pacific Web-based Market by Country
- 7.3.2 Asia Pacific Occupational Therapy Software Market by End-use
- 7.3.2.1 Asia Pacific Hospitals Market by Country
- 7.3.2.2 Asia Pacific Clinics Market by Country
- 7.3.2.3 Asia Pacific Other End-use Market by Country
- 7.3.3 Asia Pacific Occupational Therapy Software Market by Interface
- 7.3.3.1 Asia Pacific Mobile/Tablets Market by Country
- 7.3.3.2 Asia Pacific Desktops/Laptops Market by Country
- 7.3.4 Asia Pacific Occupational Therapy Software Market by Country
- 7.3.4.1 China Occupational Therapy Software Market
- 7.3.4.1.1 China Occupational Therapy Software Market by Delivery Mode
- 7.3.4.1.2 China Occupational Therapy Software Market by End-use
- 7.3.4.1.3 China Occupational Therapy Software Market by Interface
- 7.3.4.2 Japan Occupational Therapy Software Market
- 7.3.4.2.1 Japan Occupational Therapy Software Market by Delivery Mode
- 7.3.4.2.2 Japan Occupational Therapy Software Market by End-use
- 7.3.4.2.3 Japan Occupational Therapy Software Market by Interface
- 7.3.4.3 India Occupational Therapy Software Market
- 7.3.4.3.1 India Occupational Therapy Software Market by Delivery Mode
- 7.3.4.3.2 India Occupational Therapy Software Market by End-use
- 7.3.4.3.3 India Occupational Therapy Software Market by Interface
- 7.3.4.4 South Korea Occupational Therapy Software Market
- 7.3.4.4.1 South Korea Occupational Therapy Software Market by Delivery Mode
- 7.3.4.4.2 South Korea Occupational Therapy Software Market by End-use
- 7.3.4.4.3 South Korea Occupational Therapy Software Market by Interface
- 7.3.4.5 Singapore Occupational Therapy Software Market
- 7.3.4.5.1 Singapore Occupational Therapy Software Market by Delivery Mode
- 7.3.4.5.2 Singapore Occupational Therapy Software Market by End-use
- 7.3.4.5.3 Singapore Occupational Therapy Software Market by Interface
- 7.3.4.6 Malaysia Occupational Therapy Software Market
- 7.3.4.6.1 Malaysia Occupational Therapy Software Market by Delivery Mode
- 7.3.4.6.2 Malaysia Occupational Therapy Software Market by End-use
- 7.3.4.6.3 Malaysia Occupational Therapy Software Market by Interface
- 7.3.4.7 Rest of Asia Pacific Occupational Therapy Software Market
- 7.3.4.7.1 Rest of Asia Pacific Occupational Therapy Software Market by Delivery Mode
- 7.3.4.7.2 Rest of Asia Pacific Occupational Therapy Software Market by End-use
- 7.3.4.7.3 Rest of Asia Pacific Occupational Therapy Software Market by Interface
- 7.3.4.1 China Occupational Therapy Software Market
- 7.3.1 Asia Pacific Occupational Therapy Software Market by Delivery Mode
- 7.4 LAMEA Occupational Therapy Software Market
- 7.4.1 LAMEA Occupational Therapy Software Market by Delivery Mode
- 7.4.1.1 LAMEA Cloud-based Market by Country
- 7.4.1.2 LAMEA Web-based Market by Country
- 7.4.2 LAMEA Occupational Therapy Software Market by End-use
- 7.4.2.1 LAMEA Hospitals Market by Country
- 7.4.2.2 LAMEA Clinics Market by Country
- 7.4.2.3 LAMEA Other End-use Market by Country
- 7.4.3 LAMEA Occupational Therapy Software Market by Interface
- 7.4.3.1 LAMEA Mobile/Tablets Market by Country
- 7.4.3.2 LAMEA Desktops/Laptops Market by Country
- 7.4.4 LAMEA Occupational Therapy Software Market by Country
- 7.4.4.1 Brazil Occupational Therapy Software Market
- 7.4.4.1.1 Brazil Occupational Therapy Software Market by Delivery Mode
- 7.4.4.1.2 Brazil Occupational Therapy Software Market by End-use
- 7.4.4.1.3 Brazil Occupational Therapy Software Market by Interface
- 7.4.4.2 Argentina Occupational Therapy Software Market
- 7.4.4.2.1 Argentina Occupational Therapy Software Market by Delivery Mode
- 7.4.4.2.2 Argentina Occupational Therapy Software Market by End-use
- 7.4.4.2.3 Argentina Occupational Therapy Software Market by Interface
- 7.4.4.3 UAE Occupational Therapy Software Market
- 7.4.4.3.1 UAE Occupational Therapy Software Market by Delivery Mode
- 7.4.4.3.2 UAE Occupational Therapy Software Market by End-use
- 7.4.4.3.3 UAE Occupational Therapy Software Market by Interface
- 7.4.4.4 Saudi Arabia Occupational Therapy Software Market
- 7.4.4.4.1 Saudi Arabia Occupational Therapy Software Market by Delivery Mode
- 7.4.4.4.2 Saudi Arabia Occupational Therapy Software Market by End-use
- 7.4.4.4.3 Saudi Arabia Occupational Therapy Software Market by Interface
- 7.4.4.5 South Africa Occupational Therapy Software Market
- 7.4.4.5.1 South Africa Occupational Therapy Software Market by Delivery Mode
- 7.4.4.5.2 South Africa Occupational Therapy Software Market by End-use
- 7.4.4.5.3 South Africa Occupational Therapy Software Market by Interface
- 7.4.4.6 Nigeria Occupational Therapy Software Market
- 7.4.4.6.1 Nigeria Occupational Therapy Software Market by Delivery Mode
- 7.4.4.6.2 Nigeria Occupational Therapy Software Market by End-use
- 7.4.4.6.3 Nigeria Occupational Therapy Software Market by Interface
- 7.4.4.7 Rest of LAMEA Occupational Therapy Software Market
- 7.4.4.7.1 Rest of LAMEA Occupational Therapy Software Market by Delivery Mode
- 7.4.4.7.2 Rest of LAMEA Occupational Therapy Software Market by End-use
- 7.4.4.7.3 Rest of LAMEA Occupational Therapy Software Market by Interface
- 7.4.4.1 Brazil Occupational Therapy Software Market
- 7.4.1 LAMEA Occupational Therapy Software Market by Delivery Mode
Chapter 8. Company Profiles
- 8.1 WebPT, Inc.
- 8.1.1 Company Overview
- 8.1.2 Recent strategies and developments:
- 8.1.2.1 Partnerships, Collaborations, and Agreements:
- 8.2 SimplePractice, LLC
- 8.2.1 Company Overview
- 8.3 ClinicSource
- 8.3.1 Company Overview
- 8.4 Net Health Systems, Inc.
- 8.4.1 Company Overview
- 8.5 Planetrehab Inc.
- 8.5.1 Company Overview
- 8.6 HENO
- 8.6.1 Company Overview
- 8.7 Fusion Web Clinic, Inc.
- 8.7.1 Company Overview
- 8.8 Care Patron Limited
- 8.8.1 Company Overview
- 8.9 Axxess Technology Solutions, Inc.
- 8.9.1 Company Overview
- 8.10. AdvancedMD, Inc. (Global Payments Inc.)
- 8.10.1 Company Overview
- 8.10.2 Recent strategies and developments:
- 8.10.2.1 Product Launches and Product Expansions:
- 8.10.3 SWOT Analysis
