|
|
市場調査レポート
商品コード
1522050
フロートガラスの世界市場規模、シェア、動向分析:最終用途別、製品別、地域別展望と予測(2024年~2031年)Global Float Glass Market Size, Share & Trends Analysis Report By End-use, By Product, By Regional Outlook and Forecast, 2024 - 2031 |
||||||

|
|||||||
|
|||||||

| フロートガラスの世界市場規模、シェア、動向分析:最終用途別、製品別、地域別展望と予測(2024年~2031年) |
|
出版日: 2024年07月19日
発行: KBV Research
ページ情報: 英文 190 Pages
納期: 即納可能
|

全表示
- 概要
- 図表
- 目次
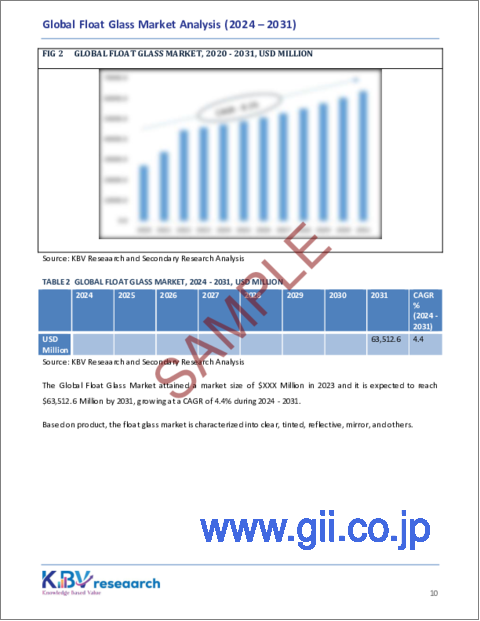
世界のフロートガラスの市場規模は、予測期間中に4.4%のCAGRで市場成長し、2031年までに635億米ドルに達すると予想されています。
さらに、エネルギー消費の環境への影響に対するグローバル社会の認識が高まるにつれ、持続可能な開発を促進し、エネルギー効率を高める材料や建築手法の導入が強く求められています。この動きの中で際立っている材料の1つが、エネルギー効率の高いガラス、特に低放射率(Low-E)ガラスです。Low-Eガラスを通過する紫外線(UV)と赤外線の量を減らすために使用される特殊コーティングによって、可視光のレベルが損なわれることはありません。Low-Eガラスを建物の設計に組み込むと、居住者の快適性と建物の美観が向上するだけでなく、エネルギー効率も向上します。したがって、これらの要因が市場の成長を支えることになります。
しかし、フロートガラスの製造には、原材料を極めて高温で連続的に溶かし、その後、溶融ガラスを溶融スズの床に浮かせて平らで均一な表面を得るという作業が必要です。このプロセスには、大型炉、スズ浴、焼きなまし炉、切断機など、購入と維持にコストがかかる非常に特殊な設備が必要です。しかし、小規模な製造業者は、同様の効率を達成するのに苦労する可能性があり、単位当たりのコストが高くなり、市場での競争力が低下する可能性があります。したがって、生産コストの高さは、フロートガラス業界にとって大きな課題です。
製品の展望
製品別では、市場は透明、着色、反射、ミラーなどに分類されます。透明セグメントは、2023年に市場で59%の収益シェアを獲得しました。このタイプのガラスは、高い透明性、光学的透明性、滑らかな表面で知られており、遮る物のない視界と最大の光透過を必要とする用途に最適です。透明フロートガラスは、住宅や商業ビルの窓、ドア、パーティション、ファサードに広く使用されています。現代の建築デザインにおける自然光とオープンスペースの需要により、透明フロートガラスの採用が大幅に増加しました。
最終用途の展望
最終用途別では、市場は自動車・輸送、建築・建設、エネルギー、その他に分類されます。エネルギーセグメントは、2023年に市場で5%の収益シェアを記録しました。エネルギーセグメントは、エネルギー効率の高い建築材料と再生可能エネルギー源への重点の高まりによって推進されています。太陽光発電設備の急速な拡大により、太陽電池を保護し、最適なパフォーマンスを確保するために、ソーラーパネルにフロートガラスを使用する必要があります。
地域の展望
地域別に見ると、市場は北米、欧州、アジア太平洋、ラテンアメリカ・中東・アフリカにわたって分析されています。アジア太平洋セグメントは、2023年にフロートガラス市場で54%の収益シェアを記録しました。この優位性は、中国、インド、日本などの国々での建設業界の繁栄、重要なインフラ開発、都市化の加速によって推進されています。フロートガラスの最大の生産国・消費国である中国は、その広大な建設プロジェクトと堅調な自動車産業により、市場に大きな影響を与えています。
目次
第1章 市場範囲と調査手法
- 市場の定義
- 目的
- 市場範囲
- セグメンテーション
- 調査手法
第2章 市場要覧
- 主なハイライト
第3章 市場概要
- イントロダクション
- 概要
- 市場構成とシナリオ
- 概要
- 市場に影響を与える主な要因
- 市場促進要因
- 市場抑制要因
- 市場機会
- 市場の課題
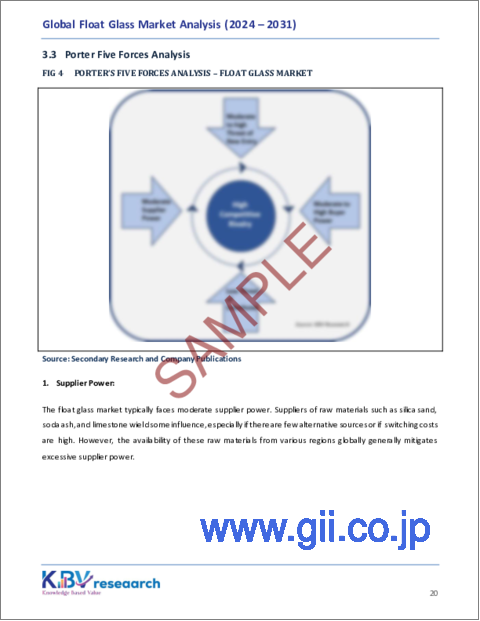
- ポーターのファイブフォース分析
第4章 世界のフロートガラス市場:最終用途別
- 世界の建築・建設市場:地域別
- 世界の自動車・輸送市場:地域別
- 世界のエネルギー市場:地域別
- 世界のその他の市場:地域別
第5章 世界のフロートガラス市場:製品別
- 世界の透明市場:地域別
- 世界の反射市場:地域別
- 世界の着色市場:地域別
- 世界のミラー市場:地域別
- 世界のその他の市場:地域別
第6章 世界のフロートガラス市場:地域別
- 北米
- 北米のフロートガラス市場:国別
- 米国
- カナダ
- メキシコ
- その他北米
- 北米のフロートガラス市場:国別
- 欧州
- 欧州のフロートガラス市場:国別
- ドイツ
- 英国
- フランス
- ロシア
- スペイン
- イタリア
- その他欧州
- 欧州のフロートガラス市場:国別
- アジア太平洋
- アジア太平洋のフロートガラス市場:国別
- 中国
- 日本
- インド
- 韓国
- オーストラリア
- マレーシア
- その他アジア太平洋
- アジア太平洋のフロートガラス市場:国別
- ラテンアメリカ・中東・アフリカ
- ラテンアメリカ・中東・アフリカのフロートガラス市場:国別
- ブラジル
- アルゼンチン
- アラブ首長国連邦
- サウジアラビア
- 南アフリカ
- ナイジェリア
- その他ラテンアメリカ・中東・アフリカ
- ラテンアメリカ・中東・アフリカのフロートガラス市場:国別
第7章 企業プロファイル
- AGC, Inc
- Asahi India Glass Limited
- Cardinal Glass Industries, Inc
- Central Glass Co, Ltd.
- Fuyao Glass Industry Group Co, Ltd.
- Guardian Industries Corporation(Koch Industries)
- Nippon Sheet Glass Co, Ltd.
- Saint-Gobain Group
- Taiwan Glass Ind Corp
- Xinyi Glass Holdings Limited
第8章 フロートガラス市場における成功必須条件
LIST OF TABLES
- TABLE 1 Global Float Glass Market, 2020 - 2023, USD Million
- TABLE 2 Global Float Glass Market, 2024 - 2031, USD Million
- TABLE 3 Global Float Glass Market by End-use, 2020 - 2023, USD Million
- TABLE 4 Global Float Glass Market by End-use, 2024 - 2031, USD Million
- TABLE 5 Global Building & Construction Market by Region, 2020 - 2023, USD Million
- TABLE 6 Global Building & Construction Market by Region, 2024 - 2031, USD Million
- TABLE 7 Global Automotive & Transportation Market by Region, 2020 - 2023, USD Million
- TABLE 8 Global Automotive & Transportation Market by Region, 2024 - 2031, USD Million
- TABLE 9 Global Energy Market by Region, 2020 - 2023, USD Million
- TABLE 10 Global Energy Market by Region, 2024 - 2031, USD Million
- TABLE 11 Global Others Market by Region, 2020 - 2023, USD Million
- TABLE 12 Global Others Market by Region, 2024 - 2031, USD Million
- TABLE 13 Global Float Glass Market by Product, 2020 - 2023, USD Million
- TABLE 14 Global Float Glass Market by Product, 2024 - 2031, USD Million
- TABLE 15 Global Clear Market by Region, 2020 - 2023, USD Million
- TABLE 16 Global Clear Market by Region, 2024 - 2031, USD Million
- TABLE 17 Global Reflective Market by Region, 2020 - 2023, USD Million
- TABLE 18 Global Reflective Market by Region, 2024 - 2031, USD Million
- TABLE 19 Global Tinted Market by Region, 2020 - 2023, USD Million
- TABLE 20 Global Tinted Market by Region, 2024 - 2031, USD Million
- TABLE 21 Global Mirror Market by Region, 2020 - 2023, USD Million
- TABLE 22 Global Mirror Market by Region, 2024 - 2031, USD Million
- TABLE 23 Global Others Market by Region, 2020 - 2023, USD Million
- TABLE 24 Global Others Market by Region, 2024 - 2031, USD Million
- TABLE 25 Global Float Glass Market by Region, 2020 - 2023, USD Million
- TABLE 26 Global Float Glass Market by Region, 2024 - 2031, USD Million
- TABLE 27 North America Float Glass Market, 2020 - 2023, USD Million
- TABLE 28 North America Float Glass Market, 2024 - 2031, USD Million
- TABLE 29 North America Float Glass Market by End-use, 2020 - 2023, USD Million
- TABLE 30 North America Float Glass Market by End-use, 2024 - 2031, USD Million
- TABLE 31 North America Building & Construction Market by Country, 2020 - 2023, USD Million
- TABLE 32 North America Building & Construction Market by Country, 2024 - 2031, USD Million
- TABLE 33 North America Automotive & Transportation Market by Country, 2020 - 2023, USD Million
- TABLE 34 North America Automotive & Transportation Market by Country, 2024 - 2031, USD Million
- TABLE 35 North America Energy Market by Country, 2020 - 2023, USD Million
- TABLE 36 North America Energy Market by Country, 2024 - 2031, USD Million
- TABLE 37 North America Others Market by Country, 2020 - 2023, USD Million
- TABLE 38 North America Others Market by Country, 2024 - 2031, USD Million
- TABLE 39 North America Float Glass Market by Product, 2020 - 2023, USD Million
- TABLE 40 North America Float Glass Market by Product, 2024 - 2031, USD Million
- TABLE 41 North America Clear Market by Country, 2020 - 2023, USD Million
- TABLE 42 North America Clear Market by Country, 2024 - 2031, USD Million
- TABLE 43 North America Reflective Market by Country, 2020 - 2023, USD Million
- TABLE 44 North America Reflective Market by Country, 2024 - 2031, USD Million
- TABLE 45 North America Tinted Market by Country, 2020 - 2023, USD Million
- TABLE 46 North America Tinted Market by Country, 2024 - 2031, USD Million
- TABLE 47 North America Mirror Market by Country, 2020 - 2023, USD Million
- TABLE 48 North America Mirror Market by Country, 2024 - 2031, USD Million
- TABLE 49 North America Others Market by Country, 2020 - 2023, USD Million
- TABLE 50 North America Others Market by Country, 2024 - 2031, USD Million
- TABLE 51 North America Float Glass Market by Country, 2020 - 2023, USD Million
- TABLE 52 North America Float Glass Market by Country, 2024 - 2031, USD Million
- TABLE 53 US Float Glass Market, 2020 - 2023, USD Million
- TABLE 54 US Float Glass Market, 2024 - 2031, USD Million
- TABLE 55 US Float Glass Market by End-use, 2020 - 2023, USD Million
- TABLE 56 US Float Glass Market by End-use, 2024 - 2031, USD Million
- TABLE 57 US Float Glass Market by Product, 2020 - 2023, USD Million
- TABLE 58 US Float Glass Market by Product, 2024 - 2031, USD Million
- TABLE 59 Canada Float Glass Market, 2020 - 2023, USD Million
- TABLE 60 Canada Float Glass Market, 2024 - 2031, USD Million
- TABLE 61 Canada Float Glass Market by End-use, 2020 - 2023, USD Million
- TABLE 62 Canada Float Glass Market by End-use, 2024 - 2031, USD Million
- TABLE 63 Canada Float Glass Market by Product, 2020 - 2023, USD Million
- TABLE 64 Canada Float Glass Market by Product, 2024 - 2031, USD Million
- TABLE 65 Mexico Float Glass Market, 2020 - 2023, USD Million
- TABLE 66 Mexico Float Glass Market, 2024 - 2031, USD Million
- TABLE 67 Mexico Float Glass Market by End-use, 2020 - 2023, USD Million
- TABLE 68 Mexico Float Glass Market by End-use, 2024 - 2031, USD Million
- TABLE 69 Mexico Float Glass Market by Product, 2020 - 2023, USD Million
- TABLE 70 Mexico Float Glass Market by Product, 2024 - 2031, USD Million
- TABLE 71 Rest of North America Float Glass Market, 2020 - 2023, USD Million
- TABLE 72 Rest of North America Float Glass Market, 2024 - 2031, USD Million
- TABLE 73 Rest of North America Float Glass Market by End-use, 2020 - 2023, USD Million
- TABLE 74 Rest of North America Float Glass Market by End-use, 2024 - 2031, USD Million
- TABLE 75 Rest of North America Float Glass Market by Product, 2020 - 2023, USD Million
- TABLE 76 Rest of North America Float Glass Market by Product, 2024 - 2031, USD Million
- TABLE 77 Europe Float Glass Market, 2020 - 2023, USD Million
- TABLE 78 Europe Float Glass Market, 2024 - 2031, USD Million
- TABLE 79 Europe Float Glass Market by End-use, 2020 - 2023, USD Million
- TABLE 80 Europe Float Glass Market by End-use, 2024 - 2031, USD Million
- TABLE 81 Europe Building & Construction Market by Country, 2020 - 2023, USD Million
- TABLE 82 Europe Building & Construction Market by Country, 2024 - 2031, USD Million
- TABLE 83 Europe Automotive & Transportation Market by Country, 2020 - 2023, USD Million
- TABLE 84 Europe Automotive & Transportation Market by Country, 2024 - 2031, USD Million
- TABLE 85 Europe Energy Market by Country, 2020 - 2023, USD Million
- TABLE 86 Europe Energy Market by Country, 2024 - 2031, USD Million
- TABLE 87 Europe Others Market by Country, 2020 - 2023, USD Million
- TABLE 88 Europe Others Market by Country, 2024 - 2031, USD Million
- TABLE 89 Europe Float Glass Market by Product, 2020 - 2023, USD Million
- TABLE 90 Europe Float Glass Market by Product, 2024 - 2031, USD Million
- TABLE 91 Europe Clear Market by Country, 2020 - 2023, USD Million
- TABLE 92 Europe Clear Market by Country, 2024 - 2031, USD Million
- TABLE 93 Europe Reflective Market by Country, 2020 - 2023, USD Million
- TABLE 94 Europe Reflective Market by Country, 2024 - 2031, USD Million
- TABLE 95 Europe Tinted Market by Country, 2020 - 2023, USD Million
- TABLE 96 Europe Tinted Market by Country, 2024 - 2031, USD Million
- TABLE 97 Europe Mirror Market by Country, 2020 - 2023, USD Million
- TABLE 98 Europe Mirror Market by Country, 2024 - 2031, USD Million
- TABLE 99 Europe Others Market by Country, 2020 - 2023, USD Million
- TABLE 100 Europe Others Market by Country, 2024 - 2031, USD Million
- TABLE 101 Europe Float Glass Market by Country, 2020 - 2023, USD Million
- TABLE 102 Europe Float Glass Market by Country, 2024 - 2031, USD Million
- TABLE 103 Germany Float Glass Market, 2020 - 2023, USD Million
- TABLE 104 Germany Float Glass Market, 2024 - 2031, USD Million
- TABLE 105 Germany Float Glass Market by End-use, 2020 - 2023, USD Million
- TABLE 106 Germany Float Glass Market by End-use, 2024 - 2031, USD Million
- TABLE 107 Germany Float Glass Market by Product, 2020 - 2023, USD Million
- TABLE 108 Germany Float Glass Market by Product, 2024 - 2031, USD Million
- TABLE 109 UK Float Glass Market, 2020 - 2023, USD Million
- TABLE 110 UK Float Glass Market, 2024 - 2031, USD Million
- TABLE 111 UK Float Glass Market by End-use, 2020 - 2023, USD Million
- TABLE 112 UK Float Glass Market by End-use, 2024 - 2031, USD Million
- TABLE 113 UK Float Glass Market by Product, 2020 - 2023, USD Million
- TABLE 114 UK Float Glass Market by Product, 2024 - 2031, USD Million
- TABLE 115 France Float Glass Market, 2020 - 2023, USD Million
- TABLE 116 France Float Glass Market, 2024 - 2031, USD Million
- TABLE 117 France Float Glass Market by End-use, 2020 - 2023, USD Million
- TABLE 118 France Float Glass Market by End-use, 2024 - 2031, USD Million
- TABLE 119 France Float Glass Market by Product, 2020 - 2023, USD Million
- TABLE 120 France Float Glass Market by Product, 2024 - 2031, USD Million
- TABLE 121 Russia Float Glass Market, 2020 - 2023, USD Million
- TABLE 122 Russia Float Glass Market, 2024 - 2031, USD Million
- TABLE 123 Russia Float Glass Market by End-use, 2020 - 2023, USD Million
- TABLE 124 Russia Float Glass Market by End-use, 2024 - 2031, USD Million
- TABLE 125 Russia Float Glass Market by Product, 2020 - 2023, USD Million
- TABLE 126 Russia Float Glass Market by Product, 2024 - 2031, USD Million
- TABLE 127 Spain Float Glass Market, 2020 - 2023, USD Million
- TABLE 128 Spain Float Glass Market, 2024 - 2031, USD Million
- TABLE 129 Spain Float Glass Market by End-use, 2020 - 2023, USD Million
- TABLE 130 Spain Float Glass Market by End-use, 2024 - 2031, USD Million
- TABLE 131 Spain Float Glass Market by Product, 2020 - 2023, USD Million
- TABLE 132 Spain Float Glass Market by Product, 2024 - 2031, USD Million
- TABLE 133 Italy Float Glass Market, 2020 - 2023, USD Million
- TABLE 134 Italy Float Glass Market, 2024 - 2031, USD Million
- TABLE 135 Italy Float Glass Market by End-use, 2020 - 2023, USD Million
- TABLE 136 Italy Float Glass Market by End-use, 2024 - 2031, USD Million
- TABLE 137 Italy Float Glass Market by Product, 2020 - 2023, USD Million
- TABLE 138 Italy Float Glass Market by Product, 2024 - 2031, USD Million
- TABLE 139 Rest of Europe Float Glass Market, 2020 - 2023, USD Million
- TABLE 140 Rest of Europe Float Glass Market, 2024 - 2031, USD Million
- TABLE 141 Rest of Europe Float Glass Market by End-use, 2020 - 2023, USD Million
- TABLE 142 Rest of Europe Float Glass Market by End-use, 2024 - 2031, USD Million
- TABLE 143 Rest of Europe Float Glass Market by Product, 2020 - 2023, USD Million
- TABLE 144 Rest of Europe Float Glass Market by Product, 2024 - 2031, USD Million
- TABLE 145 Asia Pacific Float Glass Market, 2020 - 2023, USD Million
- TABLE 146 Asia Pacific Float Glass Market, 2024 - 2031, USD Million
- TABLE 147 Asia Pacific Float Glass Market by End-use, 2020 - 2023, USD Million
- TABLE 148 Asia Pacific Float Glass Market by End-use, 2024 - 2031, USD Million
- TABLE 149 Asia Pacific Building & Construction Market by Country, 2020 - 2023, USD Million
- TABLE 150 Asia Pacific Building & Construction Market by Country, 2024 - 2031, USD Million
- TABLE 151 Asia Pacific Automotive & Transportation Market by Country, 2020 - 2023, USD Million
- TABLE 152 Asia Pacific Automotive & Transportation Market by Country, 2024 - 2031, USD Million
- TABLE 153 Asia Pacific Energy Market by Country, 2020 - 2023, USD Million
- TABLE 154 Asia Pacific Energy Market by Country, 2024 - 2031, USD Million
- TABLE 155 Asia Pacific Others Market by Country, 2020 - 2023, USD Million
- TABLE 156 Asia Pacific Others Market by Country, 2024 - 2031, USD Million
- TABLE 157 Asia Pacific Float Glass Market by Product, 2020 - 2023, USD Million
- TABLE 158 Asia Pacific Float Glass Market by Product, 2024 - 2031, USD Million
- TABLE 159 Asia Pacific Clear Market by Country, 2020 - 2023, USD Million
- TABLE 160 Asia Pacific Clear Market by Country, 2024 - 2031, USD Million
- TABLE 161 Asia Pacific Reflective Market by Country, 2020 - 2023, USD Million
- TABLE 162 Asia Pacific Reflective Market by Country, 2024 - 2031, USD Million
- TABLE 163 Asia Pacific Tinted Market by Country, 2020 - 2023, USD Million
- TABLE 164 Asia Pacific Tinted Market by Country, 2024 - 2031, USD Million
- TABLE 165 Asia Pacific Mirror Market by Country, 2020 - 2023, USD Million
- TABLE 166 Asia Pacific Mirror Market by Country, 2024 - 2031, USD Million
- TABLE 167 Asia Pacific Others Market by Country, 2020 - 2023, USD Million
- TABLE 168 Asia Pacific Others Market by Country, 2024 - 2031, USD Million
- TABLE 169 Asia Pacific Float Glass Market by Country, 2020 - 2023, USD Million
- TABLE 170 Asia Pacific Float Glass Market by Country, 2024 - 2031, USD Million
- TABLE 171 China Float Glass Market, 2020 - 2023, USD Million
- TABLE 172 China Float Glass Market, 2024 - 2031, USD Million
- TABLE 173 China Float Glass Market by End-use, 2020 - 2023, USD Million
- TABLE 174 China Float Glass Market by End-use, 2024 - 2031, USD Million
- TABLE 175 China Float Glass Market by Product, 2020 - 2023, USD Million
- TABLE 176 China Float Glass Market by Product, 2024 - 2031, USD Million
- TABLE 177 Japan Float Glass Market, 2020 - 2023, USD Million
- TABLE 178 Japan Float Glass Market, 2024 - 2031, USD Million
- TABLE 179 Japan Float Glass Market by End-use, 2020 - 2023, USD Million
- TABLE 180 Japan Float Glass Market by End-use, 2024 - 2031, USD Million
- TABLE 181 Japan Float Glass Market by Product, 2020 - 2023, USD Million
- TABLE 182 Japan Float Glass Market by Product, 2024 - 2031, USD Million
- TABLE 183 India Float Glass Market, 2020 - 2023, USD Million
- TABLE 184 India Float Glass Market, 2024 - 2031, USD Million
- TABLE 185 India Float Glass Market by End-use, 2020 - 2023, USD Million
- TABLE 186 India Float Glass Market by End-use, 2024 - 2031, USD Million
- TABLE 187 India Float Glass Market by Product, 2020 - 2023, USD Million
- TABLE 188 India Float Glass Market by Product, 2024 - 2031, USD Million
- TABLE 189 South Korea Float Glass Market, 2020 - 2023, USD Million
- TABLE 190 South Korea Float Glass Market, 2024 - 2031, USD Million
- TABLE 191 South Korea Float Glass Market by End-use, 2020 - 2023, USD Million
- TABLE 192 South Korea Float Glass Market by End-use, 2024 - 2031, USD Million
- TABLE 193 South Korea Float Glass Market by Product, 2020 - 2023, USD Million
- TABLE 194 South Korea Float Glass Market by Product, 2024 - 2031, USD Million
- TABLE 195 Australia Float Glass Market, 2020 - 2023, USD Million
- TABLE 196 Australia Float Glass Market, 2024 - 2031, USD Million
- TABLE 197 Australia Float Glass Market by End-use, 2020 - 2023, USD Million
- TABLE 198 Australia Float Glass Market by End-use, 2024 - 2031, USD Million
- TABLE 199 Australia Float Glass Market by Product, 2020 - 2023, USD Million
- TABLE 200 Australia Float Glass Market by Product, 2024 - 2031, USD Million
- TABLE 201 Malaysia Float Glass Market, 2020 - 2023, USD Million
- TABLE 202 Malaysia Float Glass Market, 2024 - 2031, USD Million
- TABLE 203 Malaysia Float Glass Market by End-use, 2020 - 2023, USD Million
- TABLE 204 Malaysia Float Glass Market by End-use, 2024 - 2031, USD Million
- TABLE 205 Malaysia Float Glass Market by Product, 2020 - 2023, USD Million
- TABLE 206 Malaysia Float Glass Market by Product, 2024 - 2031, USD Million
- TABLE 207 Rest of Asia Pacific Float Glass Market, 2020 - 2023, USD Million
- TABLE 208 Rest of Asia Pacific Float Glass Market, 2024 - 2031, USD Million
- TABLE 209 Rest of Asia Pacific Float Glass Market by End-use, 2020 - 2023, USD Million
- TABLE 210 Rest of Asia Pacific Float Glass Market by End-use, 2024 - 2031, USD Million
- TABLE 211 Rest of Asia Pacific Float Glass Market by Product, 2020 - 2023, USD Million
- TABLE 212 Rest of Asia Pacific Float Glass Market by Product, 2024 - 2031, USD Million
- TABLE 213 LAMEA Float Glass Market, 2020 - 2023, USD Million
- TABLE 214 LAMEA Float Glass Market, 2024 - 2031, USD Million
- TABLE 215 LAMEA Float Glass Market by End-use, 2020 - 2023, USD Million
- TABLE 216 LAMEA Float Glass Market by End-use, 2024 - 2031, USD Million
- TABLE 217 LAMEA Building & Construction Market by Country, 2020 - 2023, USD Million
- TABLE 218 LAMEA Building & Construction Market by Country, 2024 - 2031, USD Million
- TABLE 219 LAMEA Automotive & Transportation Market by Country, 2020 - 2023, USD Million
- TABLE 220 LAMEA Automotive & Transportation Market by Country, 2024 - 2031, USD Million
- TABLE 221 LAMEA Energy Market by Country, 2020 - 2023, USD Million
- TABLE 222 LAMEA Energy Market by Country, 2024 - 2031, USD Million
- TABLE 223 LAMEA Others Market by Country, 2020 - 2023, USD Million
- TABLE 224 LAMEA Others Market by Country, 2024 - 2031, USD Million
- TABLE 225 LAMEA Float Glass Market by Product, 2020 - 2023, USD Million
- TABLE 226 LAMEA Float Glass Market by Product, 2024 - 2031, USD Million
- TABLE 227 LAMEA Clear Market by Country, 2020 - 2023, USD Million
- TABLE 228 LAMEA Clear Market by Country, 2024 - 2031, USD Million
- TABLE 229 LAMEA Reflective Market by Country, 2020 - 2023, USD Million
- TABLE 230 LAMEA Reflective Market by Country, 2024 - 2031, USD Million
- TABLE 231 LAMEA Tinted Market by Country, 2020 - 2023, USD Million
- TABLE 232 LAMEA Tinted Market by Country, 2024 - 2031, USD Million
- TABLE 233 LAMEA Mirror Market by Country, 2020 - 2023, USD Million
- TABLE 234 LAMEA Mirror Market by Country, 2024 - 2031, USD Million
- TABLE 235 LAMEA Others Market by Country, 2020 - 2023, USD Million
- TABLE 236 LAMEA Others Market by Country, 2024 - 2031, USD Million
- TABLE 237 LAMEA Float Glass Market by Country, 2020 - 2023, USD Million
- TABLE 238 LAMEA Float Glass Market by Country, 2024 - 2031, USD Million
- TABLE 239 Brazil Float Glass Market, 2020 - 2023, USD Million
- TABLE 240 Brazil Float Glass Market, 2024 - 2031, USD Million
- TABLE 241 Brazil Float Glass Market by End-use, 2020 - 2023, USD Million
- TABLE 242 Brazil Float Glass Market by End-use, 2024 - 2031, USD Million
- TABLE 243 Brazil Float Glass Market by Product, 2020 - 2023, USD Million
- TABLE 244 Brazil Float Glass Market by Product, 2024 - 2031, USD Million
- TABLE 245 Argentina Float Glass Market, 2020 - 2023, USD Million
- TABLE 246 Argentina Float Glass Market, 2024 - 2031, USD Million
- TABLE 247 Argentina Float Glass Market by End-use, 2020 - 2023, USD Million
- TABLE 248 Argentina Float Glass Market by End-use, 2024 - 2031, USD Million
- TABLE 249 Argentina Float Glass Market by Product, 2020 - 2023, USD Million
- TABLE 250 Argentina Float Glass Market by Product, 2024 - 2031, USD Million
- TABLE 251 UAE Float Glass Market, 2020 - 2023, USD Million
- TABLE 252 UAE Float Glass Market, 2024 - 2031, USD Million
- TABLE 253 UAE Float Glass Market by End-use, 2020 - 2023, USD Million
- TABLE 254 UAE Float Glass Market by End-use, 2024 - 2031, USD Million
- TABLE 255 UAE Float Glass Market by Product, 2020 - 2023, USD Million
- TABLE 256 UAE Float Glass Market by Product, 2024 - 2031, USD Million
- TABLE 257 Saudi Arabia Float Glass Market, 2020 - 2023, USD Million
- TABLE 258 Saudi Arabia Float Glass Market, 2024 - 2031, USD Million
- TABLE 259 Saudi Arabia Float Glass Market by End-use, 2020 - 2023, USD Million
- TABLE 260 Saudi Arabia Float Glass Market by End-use, 2024 - 2031, USD Million
- TABLE 261 Saudi Arabia Float Glass Market by Product, 2020 - 2023, USD Million
- TABLE 262 Saudi Arabia Float Glass Market by Product, 2024 - 2031, USD Million
- TABLE 263 South Africa Float Glass Market, 2020 - 2023, USD Million
- TABLE 264 South Africa Float Glass Market, 2024 - 2031, USD Million
- TABLE 265 South Africa Float Glass Market by End-use, 2020 - 2023, USD Million
- TABLE 266 South Africa Float Glass Market by End-use, 2024 - 2031, USD Million
- TABLE 267 South Africa Float Glass Market by Product, 2020 - 2023, USD Million
- TABLE 268 South Africa Float Glass Market by Product, 2024 - 2031, USD Million
- TABLE 269 Nigeria Float Glass Market, 2020 - 2023, USD Million
- TABLE 270 Nigeria Float Glass Market, 2024 - 2031, USD Million
- TABLE 271 Nigeria Float Glass Market by End-use, 2020 - 2023, USD Million
- TABLE 272 Nigeria Float Glass Market by End-use, 2024 - 2031, USD Million
- TABLE 273 Nigeria Float Glass Market by Product, 2020 - 2023, USD Million
- TABLE 274 Nigeria Float Glass Market by Product, 2024 - 2031, USD Million
- TABLE 275 Rest of LAMEA Float Glass Market, 2020 - 2023, USD Million
- TABLE 276 Rest of LAMEA Float Glass Market, 2024 - 2031, USD Million
- TABLE 277 Rest of LAMEA Float Glass Market by End-use, 2020 - 2023, USD Million
- TABLE 278 Rest of LAMEA Float Glass Market by End-use, 2024 - 2031, USD Million
- TABLE 279 Rest of LAMEA Float Glass Market by Product, 2020 - 2023, USD Million
- TABLE 280 Rest of LAMEA Float Glass Market by Product, 2024 - 2031, USD Million
- TABLE 281 Key Information - AGC, Inc.
- TABLE 282 Key Information - Asahi India Glass Limited
- TABLE 283 Key Information - Cardinal Glass Industries, Inc.
- TABLE 284 Key Information - Central Glass Co., Ltd.
- TABLE 285 Key Information - Fuyao Glass Industry Group Co., Ltd.
- TABLE 286 Key information - Guardian Industries Corporation
- TABLE 287 Key Information - Nippon Sheet Glass Co., Ltd.
- TABLE 288 Key information - Saint-Gobain Group
- TABLE 289 Key Information - Taiwan Glass Ind. Corp.
- TABLE 290 Key Information - Xinyi Glass Holdings Limited
The Global Float Glass Market size is expected to reach $63.5 billion by 2031, rising at a market growth of 4.4% CAGR during the forecast period.
The robust automotive industry in the United States and Canada, known for incorporating advanced glass technologies in vehicle manufacturing, contributes significantly to the market. The North America segment garnered 22% revenue share in the market in 2023. The thriving construction industry and the growing emphasis on energy-efficient and sustainable building practices primarily drive the region's demand for float glass. Innovations in smart glass and advanced glazing solutions, coupled with stringent building codes and energy efficiency regulations, propel the demand for float glass in North America.
State-of-the-art equipment and techniques are employed in the production of high-quality float glass, ensuring that there are minimal defects. These advancements have made it possible to produce glass with better optical clarity, enhanced strength, and greater uniformity, meeting the stringent requirements of various industries. Automation and precision control systems in production have also played a crucial role in minimizing waste, reducing production costs, and increasing overall output. Hence, these technological advancements have expanded float glass applications, driving the market's growth.
Moreover, there is a significant push to implement materials and building practices that promote sustainable development and enhance energy efficiency as the global community becomes more cognizant of the environmental impact of energy consumption. One of the standout materials in this movement is energy-efficient glass, particularly low-emissivity (Low-E) glass. The level of visible light is not compromised by the special coating that is used to lower the amount of ultraviolet (UV) and infrared light that can travel through low-E glass. The integration of Low-E glass into building designs not only improves occupant comfort and building aesthetics but also improves energy efficiency. Thus, these factors will support the growth of the market.
However, the production of float glass entails the continuous melting of raw materials at extremely high temperatures, followed by the flotation of the molten glass on a bed of molten tin to obtain a flat and uniform surface. This process demands highly specialized equipment, such as large-scale furnaces, tin baths, annealing lehrs, and cutting machines, which are costly to purchase and maintain. Smaller manufacturers, however, may struggle to achieve similar efficiencies, potentially leading to higher per-unit costs and reduced competitiveness in the market. Hence, high production costs are a significant challenge for the float glass industry.
Product Outlook
Based on product, the market is characterized into clear, tinted, reflective, mirror, and others. The clear segment garnered 59% revenue share in the market in 2023. This type of glass is known for its high transparency, optical clarity, and smooth surface, making it ideal for applications that require unobstructed views and maximum light transmission. Clear float glass is extensively used in residential and commercial buildings for windows, doors, partitions, and facades. The demand for natural light and open spaces in modern architectural designs has significantly boosted the adoption of clear float glass.
End-use Outlook
On the basis of end-use, the market is classified into automotive & transportation, building & construction, energy, and others. The energy segment recorded 5% revenue share in the market in 2023. The energy segment is being driven by the increasing emphasis on energy-efficient building materials and renewable energy sources. The rapid expansion of solar photovoltaic installations necessitates using float glass in solar panels to protect photovoltaic cells and ensure optimal performance.
Regional Outlook
Region-wise, the market is analyzed across North America, Europe, Asia Pacific, and LAMEA. The Asia Pacific segment witnessed 54% revenue share in the float glass market in 2023. This dominance is fueled by the thriving construction industry, significant infrastructure development, and accelerated urbanization in countries such as China, India, and Japan. China, the largest producer and consumer of float glass, significantly influences the market due to its vast construction projects and robust automotive industry.
List of Key Companies Profiled
- AGC Inc.
- Asahi India Glass Limited
- Cardinal Glass Industries, Inc.
- Central Glass Co., Ltd.
- Fuyao Glass Industry Group Co., Ltd.
- Guardian Industries Corporation (Koch Industries)
- Nippon Sheet Glass Co. Ltd.
- Saint-Gobain S.A.
- Taiwan Glass Ind. Corp.
- Xinyi Glass Holdings Limited
Global Float Glass Market Report Segmentation
By End-use
- Building & Construction
- Automotive & Transportation
- Energy
- Others
By Product
- Clear
- Reflective
- Tinted
- Mirror
- Others
By Geography
- North America
- US
- Canada
- Mexico
- Rest of North America
- Europe
- Germany
- UK
- France
- Russia
- Spain
- Italy
- Rest of Europe
- Asia Pacific
- China
- Japan
- India
- South Korea
- Australia
- Malaysia
- Rest of Asia Pacific
- LAMEA
- Brazil
- Argentina
- UAE
- Saudi Arabia
- South Africa
- Nigeria
- Rest of LAMEA
Table of Contents
Chapter 1. Market Scope & Methodology
- 1.1 Market Definition
- 1.2 Objectives
- 1.3 Market Scope
- 1.4 Segmentation
- 1.4.1 Global Float Glass Market, by End-use
- 1.4.2 Global Float Glass Market, by Product
- 1.4.3 Global Float Glass Market, by Geography
- 1.5 Methodology for the research
Chapter 2. Market at a Glance
- 2.1 Key Highlights
Chapter 3. Market Overview
- 3.1 Introduction
- 3.1.1 Overview
- 3.1.1.1 Market Composition and Scenario
- 3.1.1 Overview
- 3.2 Key Factors Impacting the Market
- 3.2.1 Market Drivers
- 3.2.2 Market Restraints
- 3.2.3 Market Opportunities
- 3.2.4 Market Challenges
- 3.3 Porter Five Forces Analysis
Chapter 4. Global Float Glass Market by End-use
- 4.1 Global Building & Construction Market by Region
- 4.2 Global Automotive & Transportation Market by Region
- 4.3 Global Energy Market by Region
- 4.4 Global Others Market by Region
Chapter 5. Global Float Glass Market by Product
- 5.1 Global Clear Market by Region
- 5.2 Global Reflective Market by Region
- 5.3 Global Tinted Market by Region
- 5.4 Global Mirror Market by Region
- 5.5 Global Others Market by Region
Chapter 6. Global Float Glass Market by Region
- 6.1 North America Float Glass Market
- 6.1.1 North America Float Glass Market by End-use
- 6.1.1.1 North America Building & Construction Market by Country
- 6.1.1.2 North America Automotive & Transportation Market by Country
- 6.1.1.3 North America Energy Market by Country
- 6.1.1.4 North America Others Market by Country
- 6.1.2 North America Float Glass Market by Product
- 6.1.2.1 North America Clear Market by Country
- 6.1.2.2 North America Reflective Market by Country
- 6.1.2.3 North America Tinted Market by Country
- 6.1.2.4 North America Mirror Market by Country
- 6.1.2.5 North America Others Market by Country
- 6.1.3 North America Float Glass Market by Country
- 6.1.3.1 US Float Glass Market
- 6.1.3.1.1 US Float Glass Market by End-use
- 6.1.3.1.2 US Float Glass Market by Product
- 6.1.3.2 Canada Float Glass Market
- 6.1.3.2.1 Canada Float Glass Market by End-use
- 6.1.3.2.2 Canada Float Glass Market by Product
- 6.1.3.3 Mexico Float Glass Market
- 6.1.3.3.1 Mexico Float Glass Market by End-use
- 6.1.3.3.2 Mexico Float Glass Market by Product
- 6.1.3.4 Rest of North America Float Glass Market
- 6.1.3.4.1 Rest of North America Float Glass Market by End-use
- 6.1.3.4.2 Rest of North America Float Glass Market by Product
- 6.1.3.1 US Float Glass Market
- 6.1.1 North America Float Glass Market by End-use
- 6.2 Europe Float Glass Market
- 6.2.1 Europe Float Glass Market by End-use
- 6.2.1.1 Europe Building & Construction Market by Country
- 6.2.1.2 Europe Automotive & Transportation Market by Country
- 6.2.1.3 Europe Energy Market by Country
- 6.2.1.4 Europe Others Market by Country
- 6.2.2 Europe Float Glass Market by Product
- 6.2.2.1 Europe Clear Market by Country
- 6.2.2.2 Europe Reflective Market by Country
- 6.2.2.3 Europe Tinted Market by Country
- 6.2.2.4 Europe Mirror Market by Country
- 6.2.2.5 Europe Others Market by Country
- 6.2.3 Europe Float Glass Market by Country
- 6.2.3.1 Germany Float Glass Market
- 6.2.3.1.1 Germany Float Glass Market by End-use
- 6.2.3.1.2 Germany Float Glass Market by Product
- 6.2.3.2 UK Float Glass Market
- 6.2.3.2.1 UK Float Glass Market by End-use
- 6.2.3.2.2 UK Float Glass Market by Product
- 6.2.3.3 France Float Glass Market
- 6.2.3.3.1 France Float Glass Market by End-use
- 6.2.3.3.2 France Float Glass Market by Product
- 6.2.3.4 Russia Float Glass Market
- 6.2.3.4.1 Russia Float Glass Market by End-use
- 6.2.3.4.2 Russia Float Glass Market by Product
- 6.2.3.5 Spain Float Glass Market
- 6.2.3.5.1 Spain Float Glass Market by End-use
- 6.2.3.5.2 Spain Float Glass Market by Product
- 6.2.3.6 Italy Float Glass Market
- 6.2.3.6.1 Italy Float Glass Market by End-use
- 6.2.3.6.2 Italy Float Glass Market by Product
- 6.2.3.7 Rest of Europe Float Glass Market
- 6.2.3.7.1 Rest of Europe Float Glass Market by End-use
- 6.2.3.7.2 Rest of Europe Float Glass Market by Product
- 6.2.3.1 Germany Float Glass Market
- 6.2.1 Europe Float Glass Market by End-use
- 6.3 Asia Pacific Float Glass Market
- 6.3.1 Asia Pacific Float Glass Market by End-use
- 6.3.1.1 Asia Pacific Building & Construction Market by Country
- 6.3.1.2 Asia Pacific Automotive & Transportation Market by Country
- 6.3.1.3 Asia Pacific Energy Market by Country
- 6.3.1.4 Asia Pacific Others Market by Country
- 6.3.2 Asia Pacific Float Glass Market by Product
- 6.3.2.1 Asia Pacific Clear Market by Country
- 6.3.2.2 Asia Pacific Reflective Market by Country
- 6.3.2.3 Asia Pacific Tinted Market by Country
- 6.3.2.4 Asia Pacific Mirror Market by Country
- 6.3.2.5 Asia Pacific Others Market by Country
- 6.3.3 Asia Pacific Float Glass Market by Country
- 6.3.3.1 China Float Glass Market
- 6.3.3.1.1 China Float Glass Market by End-use
- 6.3.3.1.2 China Float Glass Market by Product
- 6.3.3.2 Japan Float Glass Market
- 6.3.3.2.1 Japan Float Glass Market by End-use
- 6.3.3.2.2 Japan Float Glass Market by Product
- 6.3.3.3 India Float Glass Market
- 6.3.3.3.1 India Float Glass Market by End-use
- 6.3.3.3.2 India Float Glass Market by Product
- 6.3.3.4 South Korea Float Glass Market
- 6.3.3.4.1 South Korea Float Glass Market by End-use
- 6.3.3.4.2 South Korea Float Glass Market by Product
- 6.3.3.5 Australia Float Glass Market
- 6.3.3.5.1 Australia Float Glass Market by End-use
- 6.3.3.5.2 Australia Float Glass Market by Product
- 6.3.3.6 Malaysia Float Glass Market
- 6.3.3.6.1 Malaysia Float Glass Market by End-use
- 6.3.3.6.2 Malaysia Float Glass Market by Product
- 6.3.3.7 Rest of Asia Pacific Float Glass Market
- 6.3.3.7.1 Rest of Asia Pacific Float Glass Market by End-use
- 6.3.3.7.2 Rest of Asia Pacific Float Glass Market by Product
- 6.3.3.1 China Float Glass Market
- 6.3.1 Asia Pacific Float Glass Market by End-use
- 6.4 LAMEA Float Glass Market
- 6.4.1 LAMEA Float Glass Market by End-use
- 6.4.1.1 LAMEA Building & Construction Market by Country
- 6.4.1.2 LAMEA Automotive & Transportation Market by Country
- 6.4.1.3 LAMEA Energy Market by Country
- 6.4.1.4 LAMEA Others Market by Country
- 6.4.2 LAMEA Float Glass Market by Product
- 6.4.2.1 LAMEA Clear Market by Country
- 6.4.2.2 LAMEA Reflective Market by Country
- 6.4.2.3 LAMEA Tinted Market by Country
- 6.4.2.4 LAMEA Mirror Market by Country
- 6.4.2.5 LAMEA Others Market by Country
- 6.4.3 LAMEA Float Glass Market by Country
- 6.4.3.1 Brazil Float Glass Market
- 6.4.3.1.1 Brazil Float Glass Market by End-use
- 6.4.3.1.2 Brazil Float Glass Market by Product
- 6.4.3.2 Argentina Float Glass Market
- 6.4.3.2.1 Argentina Float Glass Market by End-use
- 6.4.3.2.2 Argentina Float Glass Market by Product
- 6.4.3.3 UAE Float Glass Market
- 6.4.3.3.1 UAE Float Glass Market by End-use
- 6.4.3.3.2 UAE Float Glass Market by Product
- 6.4.3.4 Saudi Arabia Float Glass Market
- 6.4.3.4.1 Saudi Arabia Float Glass Market by End-use
- 6.4.3.4.2 Saudi Arabia Float Glass Market by Product
- 6.4.3.5 South Africa Float Glass Market
- 6.4.3.5.1 South Africa Float Glass Market by End-use
- 6.4.3.5.2 South Africa Float Glass Market by Product
- 6.4.3.6 Nigeria Float Glass Market
- 6.4.3.6.1 Nigeria Float Glass Market by End-use
- 6.4.3.6.2 Nigeria Float Glass Market by Product
- 6.4.3.7 Rest of LAMEA Float Glass Market
- 6.4.3.7.1 Rest of LAMEA Float Glass Market by End-use
- 6.4.3.7.2 Rest of LAMEA Float Glass Market by Product
- 6.4.3.1 Brazil Float Glass Market
- 6.4.1 LAMEA Float Glass Market by End-use
Chapter 7. Company Profiles
- 7.1 AGC, Inc.
- 7.1.1 Company Overview
- 7.1.2 Financial Analysis
- 7.1.3 Segmental and Regional Analysis
- 7.1.4 Research & Development Expenses
- 7.1.5 Recent strategies and developments:
- 7.1.5.1 Partnerships, Collaboration, and Agreements:
- 7.1.6 SWOT Analysis
- 7.2 Asahi India Glass Limited
- 7.2.1 Company Overview
- 7.2.2 Financial Analysis
- 7.2.3 Segmental and Regional Analysis
- 7.2.4 Research & Development Expenses
- 7.2.5 Recent strategies and developments:
- 7.2.5.1 Partnerships, Collaborations, and Agreements:
- 7.2.6 SWOT Analysis
- 7.3 Cardinal Glass Industries, Inc.
- 7.3.1 Company Overview
- 7.3.2 SWOT Analysis
- 7.4 Central Glass Co., Ltd.
- 7.4.1 Company Overview
- 7.4.2 Financial Analysis
- 7.4.3 Segmental and Regional Analysis
- 7.4.4 SWOT Analysis
- 7.5 Fuyao Glass Industry Group Co., Ltd.
- 7.5.1 Company Overview
- 7.5.2 Financial Analysis
- 7.5.3 Regional Analysis
- 7.5.4 Research & Development Expenses
- 7.6 Guardian Industries Corporation (Koch Industries)
- 7.6.1 Company Overview
- 7.6.2 Recent strategies and developments:
- 7.6.2.1 Partnerships, Collaborations, and Agreements:
- 7.6.2.2 Product Launches and Product Expansions:
- 7.6.3 SWOT Analysis
- 7.7 Nippon Sheet Glass Co., Ltd.
- 7.7.1 Company Overview
- 7.7.2 Financial Analysis
- 7.7.3 Segmental and Regional Analysis
- 7.7.4 Research & Development Expenses
- 7.7.5 SWOT Analysis
- 7.8 Saint-Gobain Group
- 7.8.1 Company Overview
- 7.8.2 Financial Analysis
- 7.8.3 Segmental and Regional Analysis
- 7.8.4 Research & Development Expenses
- 7.8.5 SWOT Analysis
- 7.9 Taiwan Glass Ind. Corp.
- 7.9.1 Company Overview
- 7.9.2 Financial Analysis
- 7.9.3 Segmental and Regional Analysis
- 7.9.4 Research & Development Expenses
- 7.10. Xinyi Glass Holdings Limited
- 7.10.1 Company Overview
- 7.10.2 Financial Analysis
- 7.10.3 Segmental and Regional Analysis
- 7.10.4 Research & Development Expenses
