|
|
市場調査レポート
商品コード
1483570
PARP阻害剤バイオマーカーの世界市場規模、シェア、動向分析レポート、製品別、用途別、サービス別、地域別、展望と予測、2024年~2031年Global PARP Inhibitor Biomarkers Market Size, Share & Trends Analysis Report By Product (Kits, and Assays), By Application, By Services (BRCA 1 & 2 Testing, HRD Testing, HRR Testing, and Others), By Regional Outlook and Forecast, 2024 - 2031 |
||||||

|
|||||||
|
|||||||

| PARP阻害剤バイオマーカーの世界市場規模、シェア、動向分析レポート、製品別、用途別、サービス別、地域別、展望と予測、2024年~2031年 |
|
出版日: 2024年05月17日
発行: KBV Research
ページ情報: 英文 222 Pages
納期: 即納可能
|

全表示
- 概要
- 図表
- 目次
PARP阻害剤バイオマーカー市場規模は、予測期間中に8.3%のCAGRで市場成長し、2031年までに16億米ドルに達すると予想されています。
さらに、ポイントオブケア試験により、診断機能が患者に近づき、外来クリニック、医師のオフィス、さらには患者の自宅など、従来の試験室の外でバイオマーカー試験を実施できるようになります。したがって、ポイントオブケア試験の拡大により、市場の成長が促進されます。
しかし、バイオマーカー試験には高度な実験技術と特殊な機器が必要になることが多く、その調達と維持には費用がかかる可能性があります。さらに、バイオマーカー試験に必要な試薬、消耗品、人員のコストも全体の費用に加算されます。結論として、バイオマーカー試験の高コストは市場の成長を妨げています。
パンデミック中の経済的困難と医療の優先順位の変化は、これを含めたがん治療への患者のアクセスに影響を与えました。財政的制約、失業、保険適用範囲の変更は、治療の決定と患者の遵守に影響を与えた可能性があります。したがって、 COVID-19パンデミックは市場に悪影響を及ぼしました。
製品展望
製品に基づいて、市場はキットとアッセイに分かれています。2023年には、キットセグメントが市場で63.8%の収益シェアを獲得しました。バイオマーカー試験キットは、医療提供者が専門的な研究室のインフラストラクチャや専門知識を必要とせずに、社内でバイオマーカー試験を実施するための、ユーザーフレンドリーで便利なソリューションを記載しています。
用途展望
用途に基づいて、市場は乳がん、卵巣がん、その他に分類されます。卵巣がんセグメントは、2023年に市場で30.7%の収益シェアを記録しました。PARP阻害剤は、BRCA変異を持つ卵巣がん患者の治療において臨床的有効性を実証しています。臨床試験では、PARP阻害剤が効果的であることが示されています。
サービス展望
サービスに基づいて、市場はBRCA1と2試験、HRD試験、HRR試験、その他に分類されます。BRCA 1と2試験セグメントは、2023年に市場で41.8%の収益シェアを記録しました。BRCA1とBRCA2の変異は、特定のがん、特に乳がんや卵巣がんにおける感受性の増加と強く関連しています。
地域展望
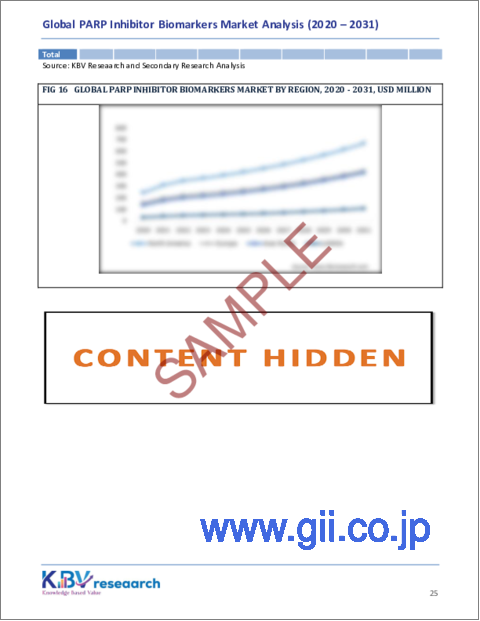
地域別に見ると、市場は北米、欧州、アジア太平洋、ラテンアメリカ・中東・アフリカにわたって分析されています。2023年には、アジア太平洋が市場で24.4%の収益シェアを生み出しました。アジア太平洋では、PARP阻害剤療法に関連する乳がん、卵巣がん、その他のがんの発生率が大幅に増加しています。
主要企業一覧
- Myriad Genetics, Inc.
- Thermo Fisher Scientific, Inc.
- Illumina, Inc.
- NeoGenomics Laboratories
- Qiagen N.V
- Agilent Technologies, Inc.
- Merck KGaA
- Bayer AG
- AstraZeneca PLC
- GlaxoSmithKline PLC (GSK)
PARP阻害剤バイオマーカー市場レポートのセグメンテーション
目次
第1章 市場範囲と調査手法
- 市場の定義
- 目的
- 市場範囲
- セグメンテーション
- 調査手法
第2章 市場要覧
第3章 市場概要
- イントロダクション
- 概要
- 市場構成とシナリオ
- 概要
- 市場に影響を与える主要要因
- 市場促進要因
- 市場抑制要因
- 市場機会
- 市場課題
- ポーターのファイブフォース分析
第4章 世界市場:製品別
- 世界のキット市場:地域別
- 世界のアッセイ市場:地域別
第5章 世界市場:用途別
- 世界の乳がん市場:地域別
- 世界の卵巣がん市場:地域別
- 世界のその他市場:地域別
第6章 世界市場:サービス別
- 世界のBRCA1と2試験市場:地域別
- 世界のHRD試験市場:地域別
- 世界のHRR試験市場:地域別
- 世界のその他市場:地域別
第7章 世界市場:地域別
- 北米
- 北米市場:国別
- 米国
- カナダ
- メキシコ
- その他の北米地域
- 北米市場:国別
- 欧州
- 欧州市場:国別
- ドイツ
- 英国
- フランス
- ロシア
- スペイン
- イタリア
- その他の欧州地域
- 欧州市場:国別
- アジア太平洋
- アジア太平洋市場:国別
- 中国
- 日本
- インド
- 韓国
- シンガポール
- マレーシア
- その他のアジア太平洋
- アジア太平洋市場:国別
- ラテンアメリカ・中東・アフリカ
- ラテンアメリカ・中東・アフリカ市場:国別
- ブラジル
- アルゼンチン
- アラブ首長国連邦
- サウジアラビア
- 南アフリカ
- ナイジェリア
- その他のラテンアメリカ・中東・アフリカ地域
- ラテンアメリカ・中東・アフリカ市場:国別
第8章 企業プロファイル
- Myriad Genetics, Inc
- Thermo Fisher Scientific, Inc
- Illumina, Inc
- Neogenomics, Inc
- Qiagen NV
- Agilent Technologies, Inc
- Merck KGaA
- Bayer AG
- AstraZeneca PLC
- GlaxoSmithKline PLC(GSK)
第9章 PARP阻害剤バイオマーカー市場の成功必須条件
LIST OF TABLES
- TABLE 1Global PARP Inhibitor Biomarkers Market, 2020 - 2023, USD Million
- TABLE 2Global PARP Inhibitor Biomarkers Market, 2024 - 2031, USD Million
- TABLE 3Global PARP Inhibitor Biomarkers Market by Product, 2020 - 2023, USD Million
- TABLE 4Global PARP Inhibitor Biomarkers Market by Product, 2024 - 2031, USD Million
- TABLE 5Global Kits Market by Region, 2020 - 2023, USD Million
- TABLE 6Global Kits Market by Region, 2024 - 2031, USD Million
- TABLE 7Global Assays Market by Region, 2020 - 2023, USD Million
- TABLE 8Global Assays Market by Region, 2024 - 2031, USD Million
- TABLE 9Global PARP Inhibitor Biomarkers Market by Application, 2020 - 2023, USD Million
- TABLE 10Global PARP Inhibitor Biomarkers Market by Application, 2024 - 2031, USD Million
- TABLE 11Global Breast Cancer Market by Region, 2020 - 2023, USD Million
- TABLE 12Global Breast Cancer Market by Region, 2024 - 2031, USD Million
- TABLE 13Global Ovarian Cancer Market by Region, 2020 - 2023, USD Million
- TABLE 14Global Ovarian Cancer Market by Region, 2024 - 2031, USD Million
- TABLE 15Global Others Market by Region, 2020 - 2023, USD Million
- TABLE 16Global Others Market by Region, 2024 - 2031, USD Million
- TABLE 17Global PARP Inhibitor Biomarkers Market by Services, 2020 - 2023, USD Million
- TABLE 18Global PARP Inhibitor Biomarkers Market by Services, 2024 - 2031, USD Million
- TABLE 19Global BRCA 1 & 2 Testing Market by Region, 2020 - 2023, USD Million
- TABLE 20Global BRCA 1 & 2 Testing Market by Region, 2024 - 2031, USD Million
- TABLE 21Global HRD Testing Market by Region, 2020 - 2023, USD Million
- TABLE 22Global HRD Testing Market by Region, 2024 - 2031, USD Million
- TABLE 23Global HRR Testing Market by Region, 2020 - 2023, USD Million
- TABLE 24Global HRR Testing Market by Region, 2024 - 2031, USD Million
- TABLE 25Global Others Market by Region, 2020 - 2023, USD Million
- TABLE 26Global Others Market by Region, 2024 - 2031, USD Million
- TABLE 27Global PARP Inhibitor Biomarkers Market by Region, 2020 - 2023, USD Million
- TABLE 28Global PARP Inhibitor Biomarkers Market by Region, 2024 - 2031, USD Million
- TABLE 29North America PARP Inhibitor Biomarkers Market, 2020 - 2023, USD Million
- TABLE 30North America PARP Inhibitor Biomarkers Market, 2024 - 2031, USD Million
- TABLE 31North America PARP Inhibitor Biomarkers Market by Product, 2020 - 2023, USD Million
- TABLE 32North America PARP Inhibitor Biomarkers Market by Product, 2024 - 2031, USD Million
- TABLE 33North America Kits Market by Region, 2020 - 2023, USD Million
- TABLE 34North America Kits Market by Region, 2024 - 2031, USD Million
- TABLE 35North America Assays Market by Region, 2020 - 2023, USD Million
- TABLE 36North America Assays Market by Region, 2024 - 2031, USD Million
- TABLE 37North America PARP Inhibitor Biomarkers Market by Application, 2020 - 2023, USD Million
- TABLE 38North America PARP Inhibitor Biomarkers Market by Application, 2024 - 2031, USD Million
- TABLE 39North America Breast Cancer Market by Country, 2020 - 2023, USD Million
- TABLE 40North America Breast Cancer Market by Country, 2024 - 2031, USD Million
- TABLE 41North America Ovarian Cancer Market by Country, 2020 - 2023, USD Million
- TABLE 42North America Ovarian Cancer Market by Country, 2024 - 2031, USD Million
- TABLE 43North America Others Market by Country, 2020 - 2023, USD Million
- TABLE 44North America Others Market by Country, 2024 - 2031, USD Million
- TABLE 45North America PARP Inhibitor Biomarkers Market by Services, 2020 - 2023, USD Million
- TABLE 46North America PARP Inhibitor Biomarkers Market by Services, 2024 - 2031, USD Million
- TABLE 47North America BRCA 1 & 2 Testing Market by Country, 2020 - 2023, USD Million
- TABLE 48North America BRCA 1 & 2 Testing Market by Country, 2024 - 2031, USD Million
- TABLE 49North America HRD Testing Market by Country, 2020 - 2023, USD Million
- TABLE 50North America HRD Testing Market by Country, 2024 - 2031, USD Million
- TABLE 51North America HRR Testing Market by Country, 2020 - 2023, USD Million
- TABLE 52North America HRR Testing Market by Country, 2024 - 2031, USD Million
- TABLE 53North America Others Market by Country, 2020 - 2023, USD Million
- TABLE 54North America Others Market by Country, 2024 - 2031, USD Million
- TABLE 55North America PARP Inhibitor Biomarkers Market by Country, 2020 - 2023, USD Million
- TABLE 56North America PARP Inhibitor Biomarkers Market by Country, 2024 - 2031, USD Million
- TABLE 57US PARP Inhibitor Biomarkers Market, 2020 - 2023, USD Million
- TABLE 58US PARP Inhibitor Biomarkers Market, 2024 - 2031, USD Million
- TABLE 59US PARP Inhibitor Biomarkers Market by Product, 2020 - 2023, USD Million
- TABLE 60US PARP Inhibitor Biomarkers Market by Product, 2024 - 2031, USD Million
- TABLE 61US PARP Inhibitor Biomarkers Market by Application, 2020 - 2023, USD Million
- TABLE 62US PARP Inhibitor Biomarkers Market by Application, 2024 - 2031, USD Million
- TABLE 63US PARP Inhibitor Biomarkers Market by Services, 2020 - 2023, USD Million
- TABLE 64US PARP Inhibitor Biomarkers Market by Services, 2024 - 2031, USD Million
- TABLE 65Canada PARP Inhibitor Biomarkers Market, 2020 - 2023, USD Million
- TABLE 66Canada PARP Inhibitor Biomarkers Market, 2024 - 2031, USD Million
- TABLE 67Canada PARP Inhibitor Biomarkers Market by Product, 2020 - 2023, USD Million
- TABLE 68Canada PARP Inhibitor Biomarkers Market by Product, 2024 - 2031, USD Million
- TABLE 69Canada PARP Inhibitor Biomarkers Market by Application, 2020 - 2023, USD Million
- TABLE 70Canada PARP Inhibitor Biomarkers Market by Application, 2024 - 2031, USD Million
- TABLE 71Canada PARP Inhibitor Biomarkers Market by Services, 2020 - 2023, USD Million
- TABLE 72Canada PARP Inhibitor Biomarkers Market by Services, 2024 - 2031, USD Million
- TABLE 73Mexico PARP Inhibitor Biomarkers Market, 2020 - 2023, USD Million
- TABLE 74Mexico PARP Inhibitor Biomarkers Market, 2024 - 2031, USD Million
- TABLE 75Mexico PARP Inhibitor Biomarkers Market by Product, 2020 - 2023, USD Million
- TABLE 76Mexico PARP Inhibitor Biomarkers Market by Product, 2024 - 2031, USD Million
- TABLE 77Mexico PARP Inhibitor Biomarkers Market by Application, 2020 - 2023, USD Million
- TABLE 78Mexico PARP Inhibitor Biomarkers Market by Application, 2024 - 2031, USD Million
- TABLE 79Mexico PARP Inhibitor Biomarkers Market by Services, 2020 - 2023, USD Million
- TABLE 80Mexico PARP Inhibitor Biomarkers Market by Services, 2024 - 2031, USD Million
- TABLE 81Rest of North America PARP Inhibitor Biomarkers Market, 2020 - 2023, USD Million
- TABLE 82Rest of North America PARP Inhibitor Biomarkers Market, 2024 - 2031, USD Million
- TABLE 83Rest of North America PARP Inhibitor Biomarkers Market by Product, 2020 - 2023, USD Million
- TABLE 84Rest of North America PARP Inhibitor Biomarkers Market by Product, 2024 - 2031, USD Million
- TABLE 85Rest of North America PARP Inhibitor Biomarkers Market by Application, 2020 - 2023, USD Million
- TABLE 86Rest of North America PARP Inhibitor Biomarkers Market by Application, 2024 - 2031, USD Million
- TABLE 87Rest of North America PARP Inhibitor Biomarkers Market by Services, 2020 - 2023, USD Million
- TABLE 88Rest of North America PARP Inhibitor Biomarkers Market by Services, 2024 - 2031, USD Million
- TABLE 89Europe PARP Inhibitor Biomarkers Market, 2020 - 2023, USD Million
- TABLE 90Europe PARP Inhibitor Biomarkers Market, 2024 - 2031, USD Million
- TABLE 91Europe PARP Inhibitor Biomarkers Market by Product, 2020 - 2023, USD Million
- TABLE 92Europe PARP Inhibitor Biomarkers Market by Product, 2024 - 2031, USD Million
- TABLE 93Europe Kits Market by Country, 2020 - 2023, USD Million
- TABLE 94Europe Kits Market by Country, 2024 - 2031, USD Million
- TABLE 95Europe Assays Market by Country, 2020 - 2023, USD Million
- TABLE 96Europe Assays Market by Country, 2024 - 2031, USD Million
- TABLE 97Europe PARP Inhibitor Biomarkers Market by Application, 2020 - 2023, USD Million
- TABLE 98Europe PARP Inhibitor Biomarkers Market by Application, 2024 - 2031, USD Million
- TABLE 99Europe Breast Cancer Market by Country, 2020 - 2023, USD Million
- TABLE 100Europe Breast Cancer Market by Country, 2024 - 2031, USD Million
- TABLE 101Europe Ovarian Cancer Market by Country, 2020 - 2023, USD Million
- TABLE 102Europe Ovarian Cancer Market by Country, 2024 - 2031, USD Million
- TABLE 103Europe Others Market by Country, 2020 - 2023, USD Million
- TABLE 104Europe Others Market by Country, 2024 - 2031, USD Million
- TABLE 105Europe PARP Inhibitor Biomarkers Market by Services, 2020 - 2023, USD Million
- TABLE 106Europe PARP Inhibitor Biomarkers Market by Services, 2024 - 2031, USD Million
- TABLE 107Europe BRCA 1 & 2 Testing Market by Country, 2020 - 2023, USD Million
- TABLE 108Europe BRCA 1 & 2 Testing Market by Country, 2024 - 2031, USD Million
- TABLE 109Europe HRD Testing Market by Country, 2020 - 2023, USD Million
- TABLE 110Europe HRD Testing Market by Country, 2024 - 2031, USD Million
- TABLE 111Europe HRR Testing Market by Country, 2020 - 2023, USD Million
- TABLE 112Europe HRR Testing Market by Country, 2024 - 2031, USD Million
- TABLE 113Europe Others Market by Country, 2020 - 2023, USD Million
- TABLE 114Europe Others Market by Country, 2024 - 2031, USD Million
- TABLE 115Europe PARP Inhibitor Biomarkers Market by Country, 2020 - 2023, USD Million
- TABLE 116Europe PARP Inhibitor Biomarkers Market by Country, 2024 - 2031, USD Million
- TABLE 117Germany PARP Inhibitor Biomarkers Market, 2020 - 2023, USD Million
- TABLE 118Germany PARP Inhibitor Biomarkers Market, 2024 - 2031, USD Million
- TABLE 119Germany PARP Inhibitor Biomarkers Market by Product, 2020 - 2023, USD Million
- TABLE 120Germany PARP Inhibitor Biomarkers Market by Product, 2024 - 2031, USD Million
- TABLE 121Germany PARP Inhibitor Biomarkers Market by Application, 2020 - 2023, USD Million
- TABLE 122Germany PARP Inhibitor Biomarkers Market by Application, 2024 - 2031, USD Million
- TABLE 123Germany PARP Inhibitor Biomarkers Market by Services, 2020 - 2023, USD Million
- TABLE 124Germany PARP Inhibitor Biomarkers Market by Services, 2024 - 2031, USD Million
- TABLE 125UK PARP Inhibitor Biomarkers Market, 2020 - 2023, USD Million
- TABLE 126UK PARP Inhibitor Biomarkers Market, 2024 - 2031, USD Million
- TABLE 127UK PARP Inhibitor Biomarkers Market by Product, 2020 - 2023, USD Million
- TABLE 128UK PARP Inhibitor Biomarkers Market by Product, 2024 - 2031, USD Million
- TABLE 129UK PARP Inhibitor Biomarkers Market by Application, 2020 - 2023, USD Million
- TABLE 130UK PARP Inhibitor Biomarkers Market by Application, 2024 - 2031, USD Million
- TABLE 131UK PARP Inhibitor Biomarkers Market by Services, 2020 - 2023, USD Million
- TABLE 132UK PARP Inhibitor Biomarkers Market by Services, 2024 - 2031, USD Million
- TABLE 133France PARP Inhibitor Biomarkers Market, 2020 - 2023, USD Million
- TABLE 134France PARP Inhibitor Biomarkers Market, 2024 - 2031, USD Million
- TABLE 135France PARP Inhibitor Biomarkers Market by Product, 2020 - 2023, USD Million
- TABLE 136France PARP Inhibitor Biomarkers Market by Product, 2024 - 2031, USD Million
- TABLE 137France PARP Inhibitor Biomarkers Market by Application, 2020 - 2023, USD Million
- TABLE 138France PARP Inhibitor Biomarkers Market by Application, 2024 - 2031, USD Million
- TABLE 139France PARP Inhibitor Biomarkers Market by Services, 2020 - 2023, USD Million
- TABLE 140France PARP Inhibitor Biomarkers Market by Services, 2024 - 2031, USD Million
- TABLE 141Russia PARP Inhibitor Biomarkers Market, 2020 - 2023, USD Million
- TABLE 142Russia PARP Inhibitor Biomarkers Market, 2024 - 2031, USD Million
- TABLE 143Russia PARP Inhibitor Biomarkers Market by Product, 2020 - 2023, USD Million
- TABLE 144Russia PARP Inhibitor Biomarkers Market by Product, 2024 - 2031, USD Million
- TABLE 145Russia PARP Inhibitor Biomarkers Market by Application, 2020 - 2023, USD Million
- TABLE 146Russia PARP Inhibitor Biomarkers Market by Application, 2024 - 2031, USD Million
- TABLE 147Russia PARP Inhibitor Biomarkers Market by Services, 2020 - 2023, USD Million
- TABLE 148Russia PARP Inhibitor Biomarkers Market by Services, 2024 - 2031, USD Million
- TABLE 149Spain PARP Inhibitor Biomarkers Market, 2020 - 2023, USD Million
- TABLE 150Spain PARP Inhibitor Biomarkers Market, 2024 - 2031, USD Million
- TABLE 151Spain PARP Inhibitor Biomarkers Market by Product, 2020 - 2023, USD Million
- TABLE 152Spain PARP Inhibitor Biomarkers Market by Product, 2024 - 2031, USD Million
- TABLE 153Spain PARP Inhibitor Biomarkers Market by Application, 2020 - 2023, USD Million
- TABLE 154Spain PARP Inhibitor Biomarkers Market by Application, 2024 - 2031, USD Million
- TABLE 155Spain PARP Inhibitor Biomarkers Market by Services, 2020 - 2023, USD Million
- TABLE 156Spain PARP Inhibitor Biomarkers Market by Services, 2024 - 2031, USD Million
- TABLE 157Italy PARP Inhibitor Biomarkers Market, 2020 - 2023, USD Million
- TABLE 158Italy PARP Inhibitor Biomarkers Market, 2024 - 2031, USD Million
- TABLE 159Italy PARP Inhibitor Biomarkers Market by Product, 2020 - 2023, USD Million
- TABLE 160Italy PARP Inhibitor Biomarkers Market by Product, 2024 - 2031, USD Million
- TABLE 161Italy PARP Inhibitor Biomarkers Market by Application, 2020 - 2023, USD Million
- TABLE 162Italy PARP Inhibitor Biomarkers Market by Application, 2024 - 2031, USD Million
- TABLE 163Italy PARP Inhibitor Biomarkers Market by Services, 2020 - 2023, USD Million
- TABLE 164Italy PARP Inhibitor Biomarkers Market by Services, 2024 - 2031, USD Million
- TABLE 165Rest of Europe PARP Inhibitor Biomarkers Market, 2020 - 2023, USD Million
- TABLE 166Rest of Europe PARP Inhibitor Biomarkers Market, 2024 - 2031, USD Million
- TABLE 167Rest of Europe PARP Inhibitor Biomarkers Market by Product, 2020 - 2023, USD Million
- TABLE 168Rest of Europe PARP Inhibitor Biomarkers Market by Product, 2024 - 2031, USD Million
- TABLE 169Rest of Europe PARP Inhibitor Biomarkers Market by Application, 2020 - 2023, USD Million
- TABLE 170Rest of Europe PARP Inhibitor Biomarkers Market by Application, 2024 - 2031, USD Million
- TABLE 171Rest of Europe PARP Inhibitor Biomarkers Market by Services, 2020 - 2023, USD Million
- TABLE 172Rest of Europe PARP Inhibitor Biomarkers Market by Services, 2024 - 2031, USD Million
- TABLE 173Asia Pacific PARP Inhibitor Biomarkers Market, 2020 - 2023, USD Million
- TABLE 174Asia Pacific PARP Inhibitor Biomarkers Market, 2024 - 2031, USD Million
- TABLE 175Asia Pacific PARP Inhibitor Biomarkers Market by Product, 2020 - 2023, USD Million
- TABLE 176Asia Pacific PARP Inhibitor Biomarkers Market by Product, 2024 - 2031, USD Million
- TABLE 177Asia Pacific Kits Market by Country, 2020 - 2023, USD Million
- TABLE 178Asia Pacific Kits Market by Country, 2024 - 2031, USD Million
- TABLE 179Asia Pacific Assays Market by Country, 2020 - 2023, USD Million
- TABLE 180Asia Pacific Assays Market by Country, 2024 - 2031, USD Million
- TABLE 181Asia Pacific PARP Inhibitor Biomarkers Market by Application, 2020 - 2023, USD Million
- TABLE 182Asia Pacific PARP Inhibitor Biomarkers Market by Application, 2024 - 2031, USD Million
- TABLE 183Asia Pacific Breast Cancer Market by Country, 2020 - 2023, USD Million
- TABLE 184Asia Pacific Breast Cancer Market by Country, 2024 - 2031, USD Million
- TABLE 185Asia Pacific Ovarian Cancer Market by Country, 2020 - 2023, USD Million
- TABLE 186Asia Pacific Ovarian Cancer Market by Country, 2024 - 2031, USD Million
- TABLE 187Asia Pacific Others Market by Country, 2020 - 2023, USD Million
- TABLE 188Asia Pacific Others Market by Country, 2024 - 2031, USD Million
- TABLE 189Asia Pacific PARP Inhibitor Biomarkers Market by Services, 2020 - 2023, USD Million
- TABLE 190Asia Pacific PARP Inhibitor Biomarkers Market by Services, 2024 - 2031, USD Million
- TABLE 191Asia Pacific BRCA 1 & 2 Testing Market by Country, 2020 - 2023, USD Million
- TABLE 192Asia Pacific BRCA 1 & 2 Testing Market by Country, 2024 - 2031, USD Million
- TABLE 193Asia Pacific HRD Testing Market by Country, 2020 - 2023, USD Million
- TABLE 194Asia Pacific HRD Testing Market by Country, 2024 - 2031, USD Million
- TABLE 195Asia Pacific HRR Testing Market by Country, 2020 - 2023, USD Million
- TABLE 196Asia Pacific HRR Testing Market by Country, 2024 - 2031, USD Million
- TABLE 197Asia Pacific Others Market by Country, 2020 - 2023, USD Million
- TABLE 198Asia Pacific Others Market by Country, 2024 - 2031, USD Million
- TABLE 199Asia Pacific PARP Inhibitor Biomarkers Market by Country, 2020 - 2023, USD Million
- TABLE 200Asia Pacific PARP Inhibitor Biomarkers Market by Country, 2024 - 2031, USD Million
- TABLE 201China PARP Inhibitor Biomarkers Market, 2020 - 2023, USD Million
- TABLE 202China PARP Inhibitor Biomarkers Market, 2024 - 2031, USD Million
- TABLE 203China PARP Inhibitor Biomarkers Market by Product, 2020 - 2023, USD Million
- TABLE 204China PARP Inhibitor Biomarkers Market by Product, 2024 - 2031, USD Million
- TABLE 205China PARP Inhibitor Biomarkers Market by Application, 2020 - 2023, USD Million
- TABLE 206China PARP Inhibitor Biomarkers Market by Application, 2024 - 2031, USD Million
- TABLE 207China PARP Inhibitor Biomarkers Market by Services, 2020 - 2023, USD Million
- TABLE 208China PARP Inhibitor Biomarkers Market by Services, 2024 - 2031, USD Million
- TABLE 209Japan PARP Inhibitor Biomarkers Market, 2020 - 2023, USD Million
- TABLE 210Japan PARP Inhibitor Biomarkers Market, 2024 - 2031, USD Million
- TABLE 211Japan PARP Inhibitor Biomarkers Market by Product, 2020 - 2023, USD Million
- TABLE 212Japan PARP Inhibitor Biomarkers Market by Product, 2024 - 2031, USD Million
- TABLE 213Japan PARP Inhibitor Biomarkers Market by Application, 2020 - 2023, USD Million
- TABLE 214Japan PARP Inhibitor Biomarkers Market by Application, 2024 - 2031, USD Million
- TABLE 215Japan PARP Inhibitor Biomarkers Market by Services, 2020 - 2023, USD Million
- TABLE 216Japan PARP Inhibitor Biomarkers Market by Services, 2024 - 2031, USD Million
- TABLE 217India PARP Inhibitor Biomarkers Market, 2020 - 2023, USD Million
- TABLE 218India PARP Inhibitor Biomarkers Market, 2024 - 2031, USD Million
- TABLE 219India PARP Inhibitor Biomarkers Market by Product, 2020 - 2023, USD Million
- TABLE 220India PARP Inhibitor Biomarkers Market by Product, 2024 - 2031, USD Million
- TABLE 221India PARP Inhibitor Biomarkers Market by Application, 2020 - 2023, USD Million
- TABLE 222India PARP Inhibitor Biomarkers Market by Application, 2024 - 2031, USD Million
- TABLE 223India PARP Inhibitor Biomarkers Market by Services, 2020 - 2023, USD Million
- TABLE 224India PARP Inhibitor Biomarkers Market by Services, 2024 - 2031, USD Million
- TABLE 225South Korea PARP Inhibitor Biomarkers Market, 2020 - 2023, USD Million
- TABLE 226South Korea PARP Inhibitor Biomarkers Market, 2024 - 2031, USD Million
- TABLE 227South Korea PARP Inhibitor Biomarkers Market by Product, 2020 - 2023, USD Million
- TABLE 228South Korea PARP Inhibitor Biomarkers Market by Product, 2024 - 2031, USD Million
- TABLE 229South Korea PARP Inhibitor Biomarkers Market by Application, 2020 - 2023, USD Million
- TABLE 230South Korea PARP Inhibitor Biomarkers Market by Application, 2024 - 2031, USD Million
- TABLE 231South Korea PARP Inhibitor Biomarkers Market by Services, 2020 - 2023, USD Million
- TABLE 232South Korea PARP Inhibitor Biomarkers Market by Services, 2024 - 2031, USD Million
- TABLE 233Singapore PARP Inhibitor Biomarkers Market, 2020 - 2023, USD Million
- TABLE 234Singapore PARP Inhibitor Biomarkers Market, 2024 - 2031, USD Million
- TABLE 235Singapore PARP Inhibitor Biomarkers Market by Product, 2020 - 2023, USD Million
- TABLE 236Singapore PARP Inhibitor Biomarkers Market by Product, 2024 - 2031, USD Million
- TABLE 237Singapore PARP Inhibitor Biomarkers Market by Application, 2020 - 2023, USD Million
- TABLE 238Singapore PARP Inhibitor Biomarkers Market by Application, 2024 - 2031, USD Million
- TABLE 239Singapore PARP Inhibitor Biomarkers Market by Services, 2020 - 2023, USD Million
- TABLE 240Singapore PARP Inhibitor Biomarkers Market by Services, 2024 - 2031, USD Million
- TABLE 241Malaysia PARP Inhibitor Biomarkers Market, 2020 - 2023, USD Million
- TABLE 242Malaysia PARP Inhibitor Biomarkers Market, 2024 - 2031, USD Million
- TABLE 243Malaysia PARP Inhibitor Biomarkers Market by Product, 2020 - 2023, USD Million
- TABLE 244Malaysia PARP Inhibitor Biomarkers Market by Product, 2024 - 2031, USD Million
- TABLE 245Malaysia PARP Inhibitor Biomarkers Market by Application, 2020 - 2023, USD Million
- TABLE 246Malaysia PARP Inhibitor Biomarkers Market by Application, 2024 - 2031, USD Million
- TABLE 247Malaysia PARP Inhibitor Biomarkers Market by Services, 2020 - 2023, USD Million
- TABLE 248Malaysia PARP Inhibitor Biomarkers Market by Services, 2024 - 2031, USD Million
- TABLE 249Rest of Asia Pacific PARP Inhibitor Biomarkers Market, 2020 - 2023, USD Million
- TABLE 250Rest of Asia Pacific PARP Inhibitor Biomarkers Market, 2024 - 2031, USD Million
- TABLE 251Rest of Asia Pacific PARP Inhibitor Biomarkers Market by Product, 2020 - 2023, USD Million
- TABLE 252Rest of Asia Pacific PARP Inhibitor Biomarkers Market by Product, 2024 - 2031, USD Million
- TABLE 253Rest of Asia Pacific PARP Inhibitor Biomarkers Market by Application, 2020 - 2023, USD Million
- TABLE 254Rest of Asia Pacific PARP Inhibitor Biomarkers Market by Application, 2024 - 2031, USD Million
- TABLE 255Rest of Asia Pacific PARP Inhibitor Biomarkers Market by Services, 2020 - 2023, USD Million
- TABLE 256Rest of Asia Pacific PARP Inhibitor Biomarkers Market by Services, 2024 - 2031, USD Million
- TABLE 257LAMEA PARP Inhibitor Biomarkers Market, 2020 - 2023, USD Million
- TABLE 258LAMEA PARP Inhibitor Biomarkers Market, 2024 - 2031, USD Million
- TABLE 259LAMEA PARP Inhibitor Biomarkers Market by Product, 2020 - 2023, USD Million
- TABLE 260LAMEA PARP Inhibitor Biomarkers Market by Product, 2024 - 2031, USD Million
- TABLE 261LAMEA Kits Market by Country, 2020 - 2023, USD Million
- TABLE 262LAMEA Kits Market by Country, 2024 - 2031, USD Million
- TABLE 263LAMEA Assays Market by Country, 2020 - 2023, USD Million
- TABLE 264LAMEA Assays Market by Country, 2024 - 2031, USD Million
- TABLE 265LAMEA PARP Inhibitor Biomarkers Market by Application, 2020 - 2023, USD Million
- TABLE 266LAMEA PARP Inhibitor Biomarkers Market by Application, 2024 - 2031, USD Million
- TABLE 267LAMEA Breast Cancer Market by Country, 2020 - 2023, USD Million
- TABLE 268LAMEA Breast Cancer Market by Country, 2024 - 2031, USD Million
- TABLE 269LAMEA Ovarian Cancer Market by Country, 2020 - 2023, USD Million
- TABLE 270LAMEA Ovarian Cancer Market by Country, 2024 - 2031, USD Million
- TABLE 271LAMEA Others Market by Country, 2020 - 2023, USD Million
- TABLE 272LAMEA Others Market by Country, 2024 - 2031, USD Million
- TABLE 273LAMEA PARP Inhibitor Biomarkers Market by Services, 2020 - 2023, USD Million
- TABLE 274LAMEA PARP Inhibitor Biomarkers Market by Services, 2024 - 2031, USD Million
- TABLE 275LAMEA BRCA 1 & 2 Testing Market by Country, 2020 - 2023, USD Million
- TABLE 276LAMEA BRCA 1 & 2 Testing Market by Country, 2024 - 2031, USD Million
- TABLE 277LAMEA HRD Testing Market by Country, 2020 - 2023, USD Million
- TABLE 278LAMEA HRD Testing Market by Country, 2024 - 2031, USD Million
- TABLE 279LAMEA HRR Testing Market by Country, 2020 - 2023, USD Million
- TABLE 280LAMEA HRR Testing Market by Country, 2024 - 2031, USD Million
- TABLE 281LAMEA Others Market by Country, 2020 - 2023, USD Million
- TABLE 282LAMEA Others Market by Country, 2024 - 2031, USD Million
- TABLE 283LAMEA PARP Inhibitor Biomarkers Market by Country, 2020 - 2023, USD Million
- TABLE 284LAMEA PARP Inhibitor Biomarkers Market by Country, 2024 - 2031, USD Million
- TABLE 285Brazil PARP Inhibitor Biomarkers Market, 2020 - 2023, USD Million
- TABLE 286Brazil PARP Inhibitor Biomarkers Market, 2024 - 2031, USD Million
- TABLE 287Brazil PARP Inhibitor Biomarkers Market by Product, 2020 - 2023, USD Million
- TABLE 288Brazil PARP Inhibitor Biomarkers Market by Product, 2024 - 2031, USD Million
- TABLE 289Brazil PARP Inhibitor Biomarkers Market by Application, 2020 - 2023, USD Million
- TABLE 290Brazil PARP Inhibitor Biomarkers Market by Application, 2024 - 2031, USD Million
- TABLE 291Brazil PARP Inhibitor Biomarkers Market by Services, 2020 - 2023, USD Million
- TABLE 292Brazil PARP Inhibitor Biomarkers Market by Services, 2024 - 2031, USD Million
- TABLE 293Argentina PARP Inhibitor Biomarkers Market, 2020 - 2023, USD Million
- TABLE 294Argentina PARP Inhibitor Biomarkers Market, 2024 - 2031, USD Million
- TABLE 295Argentina PARP Inhibitor Biomarkers Market by Product, 2020 - 2023, USD Million
- TABLE 296Argentina PARP Inhibitor Biomarkers Market by Product, 2024 - 2031, USD Million
- TABLE 297Argentina PARP Inhibitor Biomarkers Market by Application, 2020 - 2023, USD Million
- TABLE 298Argentina PARP Inhibitor Biomarkers Market by Application, 2024 - 2031, USD Million
- TABLE 299Argentina PARP Inhibitor Biomarkers Market by Services, 2020 - 2023, USD Million
- TABLE 300Argentina PARP Inhibitor Biomarkers Market by Services, 2024 - 2031, USD Million
- TABLE 301UAE PARP Inhibitor Biomarkers Market, 2020 - 2023, USD Million
- TABLE 302UAE PARP Inhibitor Biomarkers Market, 2024 - 2031, USD Million
- TABLE 303UAE PARP Inhibitor Biomarkers Market by Product, 2020 - 2023, USD Million
- TABLE 304UAE PARP Inhibitor Biomarkers Market by Product, 2024 - 2031, USD Million
- TABLE 305UAE PARP Inhibitor Biomarkers Market by Application, 2020 - 2023, USD Million
- TABLE 306UAE PARP Inhibitor Biomarkers Market by Application, 2024 - 2031, USD Million
- TABLE 307UAE PARP Inhibitor Biomarkers Market by Services, 2020 - 2023, USD Million
- TABLE 308UAE PARP Inhibitor Biomarkers Market by Services, 2024 - 2031, USD Million
- TABLE 309Saudi Arabia PARP Inhibitor Biomarkers Market, 2020 - 2023, USD Million
- TABLE 310Saudi Arabia PARP Inhibitor Biomarkers Market, 2024 - 2031, USD Million
- TABLE 311Saudi Arabia PARP Inhibitor Biomarkers Market by Product, 2020 - 2023, USD Million
- TABLE 312Saudi Arabia PARP Inhibitor Biomarkers Market by Product, 2024 - 2031, USD Million
- TABLE 313Saudi Arabia PARP Inhibitor Biomarkers Market by Application, 2020 - 2023, USD Million
- TABLE 314Saudi Arabia PARP Inhibitor Biomarkers Market by Application, 2024 - 2031, USD Million
- TABLE 315Saudi Arabia PARP Inhibitor Biomarkers Market by Services, 2020 - 2023, USD Million
- TABLE 316Saudi Arabia PARP Inhibitor Biomarkers Market by Services, 2024 - 2031, USD Million
- TABLE 317South Africa PARP Inhibitor Biomarkers Market, 2020 - 2023, USD Million
- TABLE 318South Africa PARP Inhibitor Biomarkers Market, 2024 - 2031, USD Million
- TABLE 319South Africa PARP Inhibitor Biomarkers Market by Product, 2020 - 2023, USD Million
- TABLE 320South Africa PARP Inhibitor Biomarkers Market by Product, 2024 - 2031, USD Million
- TABLE 321South Africa PARP Inhibitor Biomarkers Market by Application, 2020 - 2023, USD Million
- TABLE 322South Africa PARP Inhibitor Biomarkers Market by Application, 2024 - 2031, USD Million
- TABLE 323South Africa PARP Inhibitor Biomarkers Market by Services, 2020 - 2023, USD Million
- TABLE 324South Africa PARP Inhibitor Biomarkers Market by Services, 2024 - 2031, USD Million
- TABLE 325Nigeria PARP Inhibitor Biomarkers Market, 2020 - 2023, USD Million
- TABLE 326Nigeria PARP Inhibitor Biomarkers Market, 2024 - 2031, USD Million
- TABLE 327Nigeria PARP Inhibitor Biomarkers Market by Product, 2020 - 2023, USD Million
- TABLE 328Nigeria PARP Inhibitor Biomarkers Market by Product, 2024 - 2031, USD Million
- TABLE 329Nigeria PARP Inhibitor Biomarkers Market by Application, 2020 - 2023, USD Million
- TABLE 330Nigeria PARP Inhibitor Biomarkers Market by Application, 2024 - 2031, USD Million
- TABLE 331Nigeria PARP Inhibitor Biomarkers Market by Services, 2020 - 2023, USD Million
- TABLE 332Nigeria PARP Inhibitor Biomarkers Market by Services, 2024 - 2031, USD Million
- TABLE 333Rest of LAMEA PARP Inhibitor Biomarkers Market, 2020 - 2023, USD Million
- TABLE 334Rest of LAMEA PARP Inhibitor Biomarkers Market, 2024 - 2031, USD Million
- TABLE 335Rest of LAMEA PARP Inhibitor Biomarkers Market by Product, 2020 - 2023, USD Million
- TABLE 336Rest of LAMEA PARP Inhibitor Biomarkers Market by Product, 2024 - 2031, USD Million
- TABLE 337Rest of LAMEA PARP Inhibitor Biomarkers Market by Application, 2020 - 2023, USD Million
- TABLE 338Rest of LAMEA PARP Inhibitor Biomarkers Market by Application, 2024 - 2031, USD Million
- TABLE 339Rest of LAMEA PARP Inhibitor Biomarkers Market by Services, 2020 - 2023, USD Million
- TABLE 340Rest of LAMEA PARP Inhibitor Biomarkers Market by Services, 2024 - 2031, USD Million
- TABLE 341Key Information - Myriad Genetics, Inc.
- TABLE 342Key Information - Thermo Fisher Scientific, Inc.
- TABLE 343key information - Illumina, Inc.
- TABLE 344Key Information - neogenomics, inc.
- TABLE 345Key Information - Qiagen N.V.
- TABLE 346key Information - Agilent Technologies, Inc.
- TABLE 347key Information - Merck KGaA
- TABLE 348Key Information - Bayer AG
- TABLE 349Key Information - AstraZeneca PLC
- TABLE 350Key Information - GlaxoSmithKline PLC
The Global PARP Inhibitor Biomarkers Market size is expected to reach $1.6 billion by 2031, rising at a market growth of 8.3% CAGR during the forecast period.
North America boasts advanced healthcare infrastructure, including well-established clinical laboratories, oncology centres, and research institutions. Thus, the North America region acquired 42.5% revenue share in the market 2023. The availability of diagnostic technologies and skilled healthcare professionals enhances the accessibility and utilization of biomarker testing services, driving the demand for it in North America.
Oncology research is continually uncovering new biomarkers associated with cancer development, progression, and response to therapy. As our understanding of the molecular pathways underlying cancer improves, researchers are identifying biomarkers that predict response to specific treatments, including it.
Additionally, point-of-care testing brings diagnostic capabilities closer to the patient, enabling biomarker testing to be performed outside traditional laboratory settings, such as outpatient clinics, physician offices, or even the patient's home. Hence, the expansion of point-of-care testing is raising the market's growth.
However, Biomarker testing often involves sophisticated laboratory techniques and specialized equipment, which can be expensive to procure and maintain. Additionally, the cost of reagents, consumables, and personnel required for biomarker testing adds to the overall expense. In conclusion, the high cost of biomarker testing hinders the market's growth.
Economic hardships and changes in healthcare priorities during the pandemic affected patient access to cancer treatments, including this. Financial constraints, job losses, and changes in insurance coverage may have influenced treatment decisions and patient adherence. Thus, the COVID-19 pandemic had a negative impact on the market.
Product Outlook
Based on product, the market is divided into kits and assays. In 2023, the kits segment garnered 63.8% revenue share in the market. Biomarker testing kits offer a user-friendly and convenient solution for healthcare providers to perform biomarker testing in-house without requiring specialized laboratory infrastructure or expertise.
Application Outlook
Based on application, the market is categorized into breast cancer, ovarian cancer, and others. The ovarian cancer segment witnessed 30.7% revenue share in the market in 2023. PARP inhibitors have demonstrated clinical efficacy in treating ovarian cancer patients with BRCA mutations. Clinical trials have shown that PARP inhibitors.
Services Outlook
On the basis of services, the market is segmented into BRCA 1 & 2 testing, HRD testing, HRR testing, and others. The BRCA 1 & 2 testing segment recorded 41.8% revenue share in the market in 2023. BRCA1 and BRCA2 mutations are strongly associated with increased sensitivity to this in certain cancers, particularly breast and ovarian cancer.
Regional Outlook
Region-wise, the market is analysed across North America, Europe, Asia Pacific, and LAMEA. In 2023, the Asia Pacific region generated 24.4% revenue share in the market. The Asia Pacific region is experiencing a significant increase in the incidence of cancer, including breast, ovarian, and other cancers associated with PARP inhibitor therapy.
List of Key Companies Profiled
- Myriad Genetics, Inc.
- Thermo Fisher Scientific, Inc.
- Illumina, Inc.
- NeoGenomics Laboratories
- Qiagen N.V
- Agilent Technologies, Inc.
- Merck KGaA
- Bayer AG
- AstraZeneca PLC
- GlaxoSmithKline PLC (GSK)
Global PARP Inhibitor Biomarkers Market Report Segmentation
By Product
- Kits
- Assays
By Application
- Breast Cancer
- Ovarian Cancer
- Others
By Services
- BRCA 1 & 2 Testing
- HRD Testing
- HRR Testing
- Others
By Geography
- North America
- US
- Canada
- Mexico
- Rest of North America
- Europe
- Germany
- UK
- France
- Russia
- Spain
- Italy
- Rest of Europe
- Asia Pacific
- China
- Japan
- India
- South Korea
- Singapore
- Malaysia
- Rest of Asia Pacific
- LAMEA
- Brazil
- Argentina
- UAE
- Saudi Arabia
- South Africa
- Nigeria
- Rest of LAMEA
Table of Contents
Chapter 1.Market Scope & Methodology
- 1.1Market Definition
- 1.2Objectives
- 1.3Market Scope
- 1.4Segmentation
- 1.4.1Global PARP Inhibitor Biomarkers Market, by Product
- 1.4.2Global PARP Inhibitor Biomarkers Market, by Application
- 1.4.3Global PARP Inhibitor Biomarkers Market, by Services
- 1.4.4Global PARP Inhibitor Biomarkers Market, by Geography
- 1.5Methodology for the research
Chapter 2.Market at a Glance
- 2.1Key Highlights
Chapter 3.Market Overview
- 3.1Introduction
- 3.1.1Overview
- 3.1.1.1Market Composition and Scenario
- 3.1.1Overview
- 3.2Key Factors Impacting the Market
- 3.2.1Market Drivers
- 3.2.2Market Restraints
- 3.2.3Market Opportunities
- 3.2.4Market Challenges
- 3.3Porter's Five Forces Analysis
Chapter 4.Global PARP Inhibitor Biomarkers Market by Product
- 4.1Global Kits Market by Region
- 4.2Global Assays Market by Region
Chapter 5.Global PARP Inhibitor Biomarkers Market by Application
- 5.1Global Breast Cancer Market by Region
- 5.2Global Ovarian Cancer Market by Region
- 5.3Global Others Market by Region
Chapter 6.Global PARP Inhibitor Biomarkers Market by Services
- 6.1Global BRCA 1 & 2 Testing Market by Region
- 6.2Global HRD Testing Market by Region
- 6.3Global HRR Testing Market by Region
- 6.4Global Others Market by Region
Chapter 7.Global PARP Inhibitor Biomarkers Market by Region
- 7.1North America PARP Inhibitor Biomarkers Market
- 7.1.1North America PARP Inhibitor Biomarkers Market by Product
- 7.1.1.1North America Kits Market by Region
- 7.1.1.2North America Assays Market by Region
- 7.1.2North America PARP Inhibitor Biomarkers Market by Application
- 7.1.2.1North America Breast Cancer Market by Country
- 7.1.2.2North America Ovarian Cancer Market by Country
- 7.1.2.3North America Others Market by Country
- 7.1.3North America PARP Inhibitor Biomarkers Market by Services
- 7.1.3.1North America BRCA 1 & 2 Testing Market by Country
- 7.1.3.2North America HRD Testing Market by Country
- 7.1.3.3North America HRR Testing Market by Country
- 7.1.3.4North America Others Market by Country
- 7.1.4North America PARP Inhibitor Biomarkers Market by Country
- 7.1.4.1US PARP Inhibitor Biomarkers Market
- 7.1.4.1.1US PARP Inhibitor Biomarkers Market by Product
- 7.1.4.1.2US PARP Inhibitor Biomarkers Market by Application
- 7.1.4.1.3US PARP Inhibitor Biomarkers Market by Services
- 7.1.4.2Canada PARP Inhibitor Biomarkers Market
- 7.1.4.2.1Canada PARP Inhibitor Biomarkers Market by Product
- 7.1.4.2.2Canada PARP Inhibitor Biomarkers Market by Application
- 7.1.4.2.3Canada PARP Inhibitor Biomarkers Market by Services
- 7.1.4.3Mexico PARP Inhibitor Biomarkers Market
- 7.1.4.3.1Mexico PARP Inhibitor Biomarkers Market by Product
- 7.1.4.3.2Mexico PARP Inhibitor Biomarkers Market by Application
- 7.1.4.3.3Mexico PARP Inhibitor Biomarkers Market by Services
- 7.1.4.4Rest of North America PARP Inhibitor Biomarkers Market
- 7.1.4.4.1Rest of North America PARP Inhibitor Biomarkers Market by Product
- 7.1.4.4.2Rest of North America PARP Inhibitor Biomarkers Market by Application
- 7.1.4.4.3Rest of North America PARP Inhibitor Biomarkers Market by Services
- 7.1.4.1US PARP Inhibitor Biomarkers Market
- 7.1.1North America PARP Inhibitor Biomarkers Market by Product
- 7.2Europe PARP Inhibitor Biomarkers Market
- 7.2.1Europe PARP Inhibitor Biomarkers Market by Product
- 7.2.1.1Europe Kits Market by Country
- 7.2.1.2Europe Assays Market by Country
- 7.2.2Europe PARP Inhibitor Biomarkers Market by Application
- 7.2.2.1Europe Breast Cancer Market by Country
- 7.2.2.2Europe Ovarian Cancer Market by Country
- 7.2.2.3Europe Others Market by Country
- 7.2.3Europe PARP Inhibitor Biomarkers Market by Services
- 7.2.3.1Europe BRCA 1 & 2 Testing Market by Country
- 7.2.3.2Europe HRD Testing Market by Country
- 7.2.3.3Europe HRR Testing Market by Country
- 7.2.3.4Europe Others Market by Country
- 7.2.4Europe PARP Inhibitor Biomarkers Market by Country
- 7.2.4.1Germany PARP Inhibitor Biomarkers Market
- 7.2.4.1.1Germany PARP Inhibitor Biomarkers Market by Product
- 7.2.4.1.2Germany PARP Inhibitor Biomarkers Market by Application
- 7.2.4.1.3Germany PARP Inhibitor Biomarkers Market by Services
- 7.2.4.2UK PARP Inhibitor Biomarkers Market
- 7.2.4.2.1UK PARP Inhibitor Biomarkers Market by Product
- 7.2.4.2.2UK PARP Inhibitor Biomarkers Market by Application
- 7.2.4.2.3UK PARP Inhibitor Biomarkers Market by Services
- 7.2.4.3France PARP Inhibitor Biomarkers Market
- 7.2.4.3.1France PARP Inhibitor Biomarkers Market by Product
- 7.2.4.3.2France PARP Inhibitor Biomarkers Market by Application
- 7.2.4.3.3France PARP Inhibitor Biomarkers Market by Services
- 7.2.4.4Russia PARP Inhibitor Biomarkers Market
- 7.2.4.4.1Russia PARP Inhibitor Biomarkers Market by Product
- 7.2.4.4.2Russia PARP Inhibitor Biomarkers Market by Application
- 7.2.4.4.3Russia PARP Inhibitor Biomarkers Market by Services
- 7.2.4.5Spain PARP Inhibitor Biomarkers Market
- 7.2.4.5.1Spain PARP Inhibitor Biomarkers Market by Product
- 7.2.4.5.2Spain PARP Inhibitor Biomarkers Market by Application
- 7.2.4.5.3Spain PARP Inhibitor Biomarkers Market by Services
- 7.2.4.6Italy PARP Inhibitor Biomarkers Market
- 7.2.4.6.1Italy PARP Inhibitor Biomarkers Market by Product
- 7.2.4.6.2Italy PARP Inhibitor Biomarkers Market by Application
- 7.2.4.6.3Italy PARP Inhibitor Biomarkers Market by Services
- 7.2.4.7Rest of Europe PARP Inhibitor Biomarkers Market
- 7.2.4.7.1Rest of Europe PARP Inhibitor Biomarkers Market by Product
- 7.2.4.7.2Rest of Europe PARP Inhibitor Biomarkers Market by Application
- 7.2.4.7.3Rest of Europe PARP Inhibitor Biomarkers Market by Services
- 7.2.4.1Germany PARP Inhibitor Biomarkers Market
- 7.2.1Europe PARP Inhibitor Biomarkers Market by Product
- 7.3Asia Pacific PARP Inhibitor Biomarkers Market
- 7.3.1Asia Pacific PARP Inhibitor Biomarkers Market by Product
- 7.3.1.1Asia Pacific Kits Market by Country
- 7.3.1.2Asia Pacific Assays Market by Country
- 7.3.2Asia Pacific PARP Inhibitor Biomarkers Market by Application
- 7.3.2.1Asia Pacific Breast Cancer Market by Country
- 7.3.2.2Asia Pacific Ovarian Cancer Market by Country
- 7.3.2.3Asia Pacific Others Market by Country
- 7.3.3Asia Pacific PARP Inhibitor Biomarkers Market by Services
- 7.3.3.1Asia Pacific BRCA 1 & 2 Testing Market by Country
- 7.3.3.2Asia Pacific HRD Testing Market by Country
- 7.3.3.3Asia Pacific HRR Testing Market by Country
- 7.3.3.4Asia Pacific Others Market by Country
- 7.3.4Asia Pacific PARP Inhibitor Biomarkers Market by Country
- 7.3.4.1China PARP Inhibitor Biomarkers Market
- 7.3.4.1.1China PARP Inhibitor Biomarkers Market by Product
- 7.3.4.1.2China PARP Inhibitor Biomarkers Market by Application
- 7.3.4.1.3China PARP Inhibitor Biomarkers Market by Services
- 7.3.4.2Japan PARP Inhibitor Biomarkers Market
- 7.3.4.2.1Japan PARP Inhibitor Biomarkers Market by Product
- 7.3.4.2.2Japan PARP Inhibitor Biomarkers Market by Application
- 7.3.4.2.3Japan PARP Inhibitor Biomarkers Market by Services
- 7.3.4.3India PARP Inhibitor Biomarkers Market
- 7.3.4.3.1India PARP Inhibitor Biomarkers Market by Product
- 7.3.4.3.2India PARP Inhibitor Biomarkers Market by Application
- 7.3.4.3.3India PARP Inhibitor Biomarkers Market by Services
- 7.3.4.4South Korea PARP Inhibitor Biomarkers Market
- 7.3.4.4.1South Korea PARP Inhibitor Biomarkers Market by Product
- 7.3.4.4.2South Korea PARP Inhibitor Biomarkers Market by Application
- 7.3.4.4.3South Korea PARP Inhibitor Biomarkers Market by Services
- 7.3.4.5Singapore PARP Inhibitor Biomarkers Market
- 7.3.4.5.1Singapore PARP Inhibitor Biomarkers Market by Product
- 7.3.4.5.2Singapore PARP Inhibitor Biomarkers Market by Application
- 7.3.4.5.3Singapore PARP Inhibitor Biomarkers Market by Services
- 7.3.4.6Malaysia PARP Inhibitor Biomarkers Market
- 7.3.4.6.1Malaysia PARP Inhibitor Biomarkers Market by Product
- 7.3.4.6.2Malaysia PARP Inhibitor Biomarkers Market by Application
- 7.3.4.6.3Malaysia PARP Inhibitor Biomarkers Market by Services
- 7.3.4.7Rest of Asia Pacific PARP Inhibitor Biomarkers Market
- 7.3.4.7.1Rest of Asia Pacific PARP Inhibitor Biomarkers Market by Product
- 7.3.4.7.2Rest of Asia Pacific PARP Inhibitor Biomarkers Market by Application
- 7.3.4.7.3Rest of Asia Pacific PARP Inhibitor Biomarkers Market by Services
- 7.3.4.1China PARP Inhibitor Biomarkers Market
- 7.3.1Asia Pacific PARP Inhibitor Biomarkers Market by Product
- 7.4LAMEA PARP Inhibitor Biomarkers Market
- 7.4.1LAMEA PARP Inhibitor Biomarkers Market by Product
- 7.4.1.1LAMEA Kits Market by Country
- 7.4.1.2LAMEA Assays Market by Country
- 7.4.2LAMEA PARP Inhibitor Biomarkers Market by Application
- 7.4.2.1LAMEA Breast Cancer Market by Country
- 7.4.2.2LAMEA Ovarian Cancer Market by Country
- 7.4.2.3LAMEA Others Market by Country
- 7.4.3LAMEA PARP Inhibitor Biomarkers Market by Services
- 7.4.3.1LAMEA BRCA 1 & 2 Testing Market by Country
- 7.4.3.2LAMEA HRD Testing Market by Country
- 7.4.3.3LAMEA HRR Testing Market by Country
- 7.4.3.4LAMEA Others Market by Country
- 7.4.4LAMEA PARP Inhibitor Biomarkers Market by Country
- 7.4.4.1Brazil PARP Inhibitor Biomarkers Market
- 7.4.4.1.1Brazil PARP Inhibitor Biomarkers Market by Product
- 7.4.4.1.2Brazil PARP Inhibitor Biomarkers Market by Application
- 7.4.4.1.3Brazil PARP Inhibitor Biomarkers Market by Services
- 7.4.4.2Argentina PARP Inhibitor Biomarkers Market
- 7.4.4.2.1Argentina PARP Inhibitor Biomarkers Market by Product
- 7.4.4.2.2Argentina PARP Inhibitor Biomarkers Market by Application
- 7.4.4.2.3Argentina PARP Inhibitor Biomarkers Market by Services
- 7.4.4.3UAE PARP Inhibitor Biomarkers Market
- 7.4.4.3.1UAE PARP Inhibitor Biomarkers Market by Product
- 7.4.4.3.2UAE PARP Inhibitor Biomarkers Market by Application
- 7.4.4.3.3UAE PARP Inhibitor Biomarkers Market by Services
- 7.4.4.4Saudi Arabia PARP Inhibitor Biomarkers Market
- 7.4.4.4.1Saudi Arabia PARP Inhibitor Biomarkers Market by Product
- 7.4.4.4.2Saudi Arabia PARP Inhibitor Biomarkers Market by Application
- 7.4.4.4.3Saudi Arabia PARP Inhibitor Biomarkers Market by Services
- 7.4.4.5South Africa PARP Inhibitor Biomarkers Market
- 7.4.4.5.1South Africa PARP Inhibitor Biomarkers Market by Product
- 7.4.4.5.2South Africa PARP Inhibitor Biomarkers Market by Application
- 7.4.4.5.3South Africa PARP Inhibitor Biomarkers Market by Services
- 7.4.4.6Nigeria PARP Inhibitor Biomarkers Market
- 7.4.4.6.1Nigeria PARP Inhibitor Biomarkers Market by Product
- 7.4.4.6.2Nigeria PARP Inhibitor Biomarkers Market by Application
- 7.4.4.6.3Nigeria PARP Inhibitor Biomarkers Market by Services
- 7.4.4.7Rest of LAMEA PARP Inhibitor Biomarkers Market
- 7.4.4.7.1Rest of LAMEA PARP Inhibitor Biomarkers Market by Product
- 7.4.4.7.2Rest of LAMEA PARP Inhibitor Biomarkers Market by Application
- 7.4.4.7.3Rest of LAMEA PARP Inhibitor Biomarkers Market by Services
- 7.4.4.1Brazil PARP Inhibitor Biomarkers Market
- 7.4.1LAMEA PARP Inhibitor Biomarkers Market by Product
Chapter 8.Company Profiles
- 8.1Myriad Genetics, Inc.
- 8.1.1Company Overview
- 8.1.2Financial Analysis
- 8.1.3Research & Development Expenses
- 8.2Thermo Fisher Scientific, Inc.
- 8.2.1Company Overview
- 8.2.2Financial Analysis
- 8.2.3Segmental and Regional Analysis
- 8.2.4Research & Development Expenses
- 8.2.5SWOT Analysis
- 8.3Illumina, Inc.
- 8.3.1Company Overview
- 8.3.2Financial Analysis
- 8.3.3Segment and Regional Analysis
- 8.3.4Research & Development Expense
- 8.3.5SWOT Analysis
- 8.4Neogenomics, Inc.
- 8.4.1Company Overview
- 8.4.2Financial Analysis
- 8.4.3Segmental and Regional Analysis
- 8.4.4Research & Development Expenses
- 8.5Qiagen N.V.
- 8.5.1Company Overview
- 8.5.2Financial Analysis
- 8.5.3Regional Analysis
- 8.5.4Research & Development Expense
- 8.5.5SWOT Analysis
- 8.6Agilent Technologies, Inc.
- 8.6.1Company Overview
- 8.6.2Financial Analysis
- 8.6.3Segmental and Regional Analysis
- 8.6.4Research & Development Expense
- 8.6.5SWOT Analysis
- 8.7Merck KGaA
- 8.7.1Company Overview
- 8.7.2Financial Analysis
- 8.7.3Segmental and Regional Analysis
- 8.7.4Research & Development Expense
- 8.7.5SWOT Analysis
- 8.8Bayer AG
- 8.8.1Company Overview
- 8.8.2Financial Analysis
- 8.8.3Segmental and Regional Analysis
- 8.8.4Research & Development Expense
- 8.8.5SWOT Analysis
- 8.9AstraZeneca PLC
- 8.9.1Company Overview
- 8.9.2Financial Analysis
- 8.9.3Regional Analysis
- 8.9.4Research & Development Expenses
- 8.9.5SWOT Analysis
- 8.10.GlaxoSmithKline PLC (GSK)
- 8.10.1Company Overview
- 8.10.2Financial Analysis
- 8.10.3Regional Analysis
- 8.10.4Research & Development Expense
- 8.10.5SWOT Analysis
