|
|
市場調査レポート
商品コード
1429115
カオリンの世界市場規模、シェア、動向分析レポート:用途別、プロセス別、地域別展望と予測、2023年~2030年Global Kaolin Market Size, Share & Trends Analysis Report By Application, By Process (Water-washed, Airfloat, Calcined, Delaminated, and Surface-modified & Unprocessed), By Regional Outlook and Forecast, 2023 - 2030 |
||||||
|
|
|||||||
|
|||||||


| カオリンの世界市場規模、シェア、動向分析レポート:用途別、プロセス別、地域別展望と予測、2023年~2030年 |
|
出版日: 2024年01月18日
発行: KBV Research
ページ情報: 英文 312 Pages
納期: 即納可能
|

- 全表示
- 概要
- 図表
- 目次
カオリン市場規模は、予測期間中にCAGR 3.9%で成長し、2030年には48億米ドルに達すると予測されます。2022年の市場規模は19,735.2キロトンに達し、成長率は3.1%(2019~2022年)です。
しかし、カオリンの生産には、エネルギー(加工に使用される天然ガスなど)、労働力、設備など様々な投入物が含まれます。これらの投入物の価格の変動は、カオリンの生産コスト全体に直接影響します。例えば、エネルギーコストが急激に上昇した場合、カオリンの加工コストが大幅に上昇し、市場価格に影響を与える可能性があります。カオリンの価格は、需給の変化によって変動しやすいです。カオリンの需要が突然急増したり、サプライチェーンに混乱が生じたりすると、市場は価格高騰に見舞われる可能性があります。逆に、需要が縮小したり供給が過剰になったりすると、価格が引き下げられ、カオリン生産者の収益性に影響を及ぼす可能性があります。利益率に影響を与え、投資決定に影響を及ぼし、価格設定の不確実性が潜在的な買い手や消費者を遠ざける可能性があるため、長期契約の確保が難しくなる可能性があります。このように、原料価格の変動は市場の成長を阻害しています。
目次
第1章 市場範囲と調査手法
- 市場の定義
- 目的
- 市場範囲
- セグメンテーション
- 調査手法
第2章 市場要覧
- 主なハイライト
第3章 市場概要
- イントロダクション
- 概要
- 市場構成とシナリオ
- 概要
- 市場に影響を与える主な要因
- 市場促進要因
- 市場機会
- 市場抑制要因
- 市場の課題
- ポーターファイブフォース分析
第4章 世界市場:用途別
- 世界の紙市場:地域別
- 世界のセラミックス市場:地域別
- 世界のファイバーグラス市場:地域別
- 世界のゴム市場:地域別
- 世界の医薬品および医療市場:地域別
- 世界の塗料およびコーティング市場:地域別
- 世界の化粧品市場:地域別
- 世界のプラスチック市場:地域別
- 世界のその他の市場:地域別
第5章 世界市場:プロセス別
- 世界の水洗市場:地域別
- 世界のエアフロート市場:地域別
- 世界の焼成市場:地域別
- 世界の積層剥離市場:地域別
- 世界の表面改質および未処理市場:地域別
第6章 世界市場:地域別
- 北米
- 北米の市場:国別
- 米国
- カナダ
- メキシコ
- その他北米地域
- 北米の市場:国別
- 欧州
- 欧州の市場:国別
- ドイツ
- 英国
- フランス
- ロシア
- スペイン
- イタリア
- その他欧州地域
- 欧州の市場:国別
- アジア太平洋
- アジア太平洋の市場:国別
- 中国
- 日本
- インド
- 韓国
- シンガポール
- マレーシア
- その他アジア太平洋地域
- アジア太平洋の市場:国別
- ラテンアメリカ・中東・アフリカ
- ラテンアメリカ・中東・アフリカの市場:国別
- ブラジル
- アルゼンチン
- アラブ首長国連邦
- サウジアラビア
- 南アフリカ
- ナイジェリア
- その他ラテンアメリカ・中東・アフリカ地域
- ラテンアメリカ・中東・アフリカの市場:国別
第7章 企業プロファイル
- BASF SE
- Imerys SA.(Belgian Securities B.V.)
- Active Minerals International, LLC
- Lasselsberger Group GmbH
- Thiele Kaolin Company
- SCR-Sibelco NV
- Quazwerke GmbH
- 20 Microns limited
- W R. Grace & Co
- Sedlecky kaolin as
第8章 カオリン市場の成功必須条件
LIST OF TABLES
- TABLE 1 Global Kaolin Market, 2019 - 2022, USD Million
- TABLE 2 Global Kaolin Market, 2023 - 2030, USD Million
- TABLE 3 Global Kaolin Market, 2019 - 2022, Kilo Tonnes
- TABLE 4 Global Kaolin Market, 2023 - 2030, Kilo Tonnes
- TABLE 5 Global Kaolin Market by Application, 2019 - 2022, USD Million
- TABLE 6 Global Kaolin Market by Application, 2023 - 2030, USD Million
- TABLE 7 Global Kaolin Market by Application, 2019 - 2022, Kilo Tonnes
- TABLE 8 Global Kaolin Market by Application, 2023 - 2030, Kilo Tonnes
- TABLE 9 Global Paper Market by Region, 2019 - 2022, USD Million
- TABLE 10 Global Paper Market by Region, 2023 - 2030, USD Million
- TABLE 11 Global Paper Market by Region, 2019 - 2022, Kilo Tonnes
- TABLE 12 Global Paper Market by Region, 2023 - 2030, Kilo Tonnes
- TABLE 13 Global Ceramics Market by Region, 2019 - 2022, USD Million
- TABLE 14 Global Ceramics Market by Region, 2023 - 2030, USD Million
- TABLE 15 Global Ceramics Market by Region, 2019 - 2022, Kilo Tonnes
- TABLE 16 Global Ceramics Market by Region, 2023 - 2030, Kilo Tonnes
- TABLE 17 Global Fiber Glass Market by Region, 2019 - 2022, USD Million
- TABLE 18 Global Fiber Glass Market by Region, 2023 - 2030, USD Million
- TABLE 19 Global Fiber Glass Market by Region, 2019 - 2022, Kilo Tonnes
- TABLE 20 Global Fiber Glass Market by Region, 2023 - 2030, Kilo Tonnes
- TABLE 21 Global Rubber Market by Region, 2019 - 2022, USD Million
- TABLE 22 Global Rubber Market by Region, 2023 - 2030, USD Million
- TABLE 23 Global Rubber Market by Region, 2019 - 2022, Kilo Tonnes
- TABLE 24 Global Rubber Market by Region, 2023 - 2030, Kilo Tonnes
- TABLE 25 Global Pharmaceuticals & Medical Market by Region, 2019 - 2022, USD Million
- TABLE 26 Global Pharmaceuticals & Medical Market by Region, 2023 - 2030, USD Million
- TABLE 27 Global Pharmaceuticals & Medical Market by Region, 2019 - 2022, Kilo Tonnes
- TABLE 28 Global Pharmaceuticals & Medical Market by Region, 2023 - 2030, Kilo Tonnes
- TABLE 29 Global Paints & Coatings Market by Region, 2019 - 2022, USD Million
- TABLE 30 Global Paints & Coatings Market by Region, 2023 - 2030, USD Million
- TABLE 31 Global Paints & Coatings Market by Region, 2019 - 2022, Kilo Tonnes
- TABLE 32 Global Paints & Coatings Market by Region, 2023 - 2030, Kilo Tonnes
- TABLE 33 Global Cosmetics Market by Region, 2019 - 2022, USD Million
- TABLE 34 Global Cosmetics Market by Region, 2023 - 2030, USD Million
- TABLE 35 Global Cosmetics Market by Region, 2019 - 2022, Kilo Tonnes
- TABLE 36 Global Cosmetics Market by Region, 2023 - 2030, Kilo Tonnes
- TABLE 37 Global Plastics Market by Region, 2019 - 2022, USD Million
- TABLE 38 Global Plastics Market by Region, 2023 - 2030, USD Million
- TABLE 39 Global Plastics Market by Region, 2019 - 2022, Kilo Tonnes
- TABLE 40 Global Plastics Market by Region, 2023 - 2030, Kilo Tonnes
- TABLE 41 Global Others Market by Region, 2019 - 2022, USD Million
- TABLE 42 Global Others Market by Region, 2023 - 2030, USD Million
- TABLE 43 Global Others Market by Region, 2019 - 2022, Kilo Tonnes
- TABLE 44 Global Others Market by Region, 2023 - 2030, Kilo Tonnes
- TABLE 45 Global Kaolin Market by Process, 2019 - 2022, USD Million
- TABLE 46 Global Kaolin Market by Process, 2023 - 2030, USD Million
- TABLE 47 Global Kaolin Market by Process, 2019 - 2022, Kilo Tonnes
- TABLE 48 Global Kaolin Market by Process, 2023 - 2030, Kilo Tonnes
- TABLE 49 Global Water-washed Market by Region, 2019 - 2022, USD Million
- TABLE 50 Global Water-washed Market by Region, 2023 - 2030, USD Million
- TABLE 51 Global Water-washed Market by Region, 2019 - 2022, Kilo Tonnes
- TABLE 52 Global Water-washed Market by Region, 2023 - 2030, Kilo Tonnes
- TABLE 53 Global Airfloat Market by Region, 2019 - 2022, USD Million
- TABLE 54 Global Airfloat Market by Region, 2023 - 2030, USD Million
- TABLE 55 Global Airfloat Market by Region, 2019 - 2022, Kilo Tonnes
- TABLE 56 Global Airfloat Market by Region, 2023 - 2030, Kilo Tonnes
- TABLE 57 Global Calcined Market by Region, 2019 - 2022, USD Million
- TABLE 58 Global Calcined Market by Region, 2023 - 2030, USD Million
- TABLE 59 Global Calcined Market by Region, 2019 - 2022, Kilo Tonnes
- TABLE 60 Global Calcined Market by Region, 2023 - 2030, Kilo Tonnes
- TABLE 61 Global Delaminated Market by Region, 2019 - 2022, USD Million
- TABLE 62 Global Delaminated Market by Region, 2023 - 2030, USD Million
- TABLE 63 Global Delaminated Market by Region, 2019 - 2022, Kilo Tonnes
- TABLE 64 Global Delaminated Market by Region, 2023 - 2030, Kilo Tonnes
- TABLE 65 Global Surface-modified & Unprocessed Market by Region, 2019 - 2022, USD Million
- TABLE 66 Global Surface-modified & Unprocessed Market by Region, 2023 - 2030, USD Million
- TABLE 67 Global Surface-modified & Unprocessed Market by Region, 2019 - 2022, Kilo Tonnes
- TABLE 68 Global Surface-modified & Unprocessed Market by Region, 2023 - 2030, Kilo Tonnes
- TABLE 69 Global Kaolin Market by Region, 2019 - 2022, USD Million
- TABLE 70 Global Kaolin Market by Region, 2023 - 2030, USD Million
- TABLE 71 Global Kaolin Market by Region, 2019 - 2022, Kilo Tonnes
- TABLE 72 Global Kaolin Market by Region, 2023 - 2030, Kilo Tonnes
- TABLE 73 North America Kaolin Market, 2019 - 2022, USD Million
- TABLE 74 North America Kaolin Market, 2023 - 2030, USD Million
- TABLE 75 North America Kaolin Market, 2019 - 2022, Kilo Tonnes
- TABLE 76 North America Kaolin Market, 2023 - 2030, Kilo Tonnes
- TABLE 77 North America Kaolin Market by Application, 2019 - 2022, USD Million
- TABLE 78 North America Kaolin Market by Application, 2023 - 2030, USD Million
- TABLE 79 North America Kaolin Market by Application, 2019 - 2022, Kilo Tonnes
- TABLE 80 North America Kaolin Market by Application, 2023 - 2030, Kilo Tonnes
- TABLE 81 North America Paper Market by Country, 2019 - 2022, USD Million
- TABLE 82 North America Paper Market by Country, 2023 - 2030, USD Million
- TABLE 83 North America Paper Market by Country, 2019 - 2022, Kilo Tonnes
- TABLE 84 North America Paper Market by Country, 2023 - 2030, Kilo Tonnes
- TABLE 85 North America Ceramics Market by Country, 2019 - 2022, USD Million
- TABLE 86 North America Ceramics Market by Country, 2023 - 2030, USD Million
- TABLE 87 North America Ceramics Market by Country, 2019 - 2022, Kilo Tonnes
- TABLE 88 North America Ceramics Market by Country, 2023 - 2030, Kilo Tonnes
- TABLE 89 North America Fiber Glass Market by Country, 2019 - 2022, USD Million
- TABLE 90 North America Fiber Glass Market by Country, 2023 - 2030, USD Million
- TABLE 91 North America Fiber Glass Market by Country, 2019 - 2022, Kilo Tonnes
- TABLE 92 North America Fiber Glass Market by Country, 2023 - 2030, Kilo Tonnes
- TABLE 93 North America Rubber Market by Country, 2019 - 2022, USD Million
- TABLE 94 North America Rubber Market by Country, 2023 - 2030, USD Million
- TABLE 95 North America Rubber Market by Country, 2019 - 2022, Kilo Tonnes
- TABLE 96 North America Rubber Market by Country, 2023 - 2030, Kilo Tonnes
- TABLE 97 North America Pharmaceuticals & Medical Market by Country, 2019 - 2022, USD Million
- TABLE 98 North America Pharmaceuticals & Medical Market by Country, 2023 - 2030, USD Million
- TABLE 99 North America Pharmaceuticals & Medical Market by Country, 2019 - 2022, Kilo Tonnes
- TABLE 100 North America Pharmaceuticals & Medical Market by Country, 2023 - 2030, Kilo Tonnes
- TABLE 101 North America Paints & Coatings Market by Country, 2019 - 2022, USD Million
- TABLE 102 North America Paints & Coatings Market by Country, 2023 - 2030, USD Million
- TABLE 103 North America Paints & Coatings Market by Country, 2019 - 2022, Kilo Tonnes
- TABLE 104 North America Paints & Coatings Market by Country, 2023 - 2030, Kilo Tonnes
- TABLE 105 North America Cosmetics Market by Country, 2019 - 2022, USD Million
- TABLE 106 North America Cosmetics Market by Country, 2023 - 2030, USD Million
- TABLE 107 North America Cosmetics Market by Country, 2019 - 2022, Kilo Tonnes
- TABLE 108 North America Cosmetics Market by Country, 2023 - 2030, Kilo Tonnes
- TABLE 109 North America Plastics Market by Country, 2019 - 2022, USD Million
- TABLE 110 North America Plastics Market by Country, 2023 - 2030, USD Million
- TABLE 111 North America Plastics Market by Country, 2019 - 2022, Kilo Tonnes
- TABLE 112 North America Plastics Market by Country, 2023 - 2030, Kilo Tonnes
- TABLE 113 North America Others Market by Country, 2019 - 2022, USD Million
- TABLE 114 North America Others Market by Country, 2023 - 2030, USD Million
- TABLE 115 North America Others Market by Country, 2019 - 2022, Kilo Tonnes
- TABLE 116 North America Others Market by Country, 2023 - 2030, Kilo Tonnes
- TABLE 117 North America Kaolin Market by Process, 2019 - 2022, USD Million
- TABLE 118 North America Kaolin Market by Process, 2023 - 2030, USD Million
- TABLE 119 North America Kaolin Market by Process, 2019 - 2022, Kilo Tonnes
- TABLE 120 North America Kaolin Market by Process, 2023 - 2030, Kilo Tonnes
- TABLE 121 North America Water-washed Market by Country, 2019 - 2022, USD Million
- TABLE 122 North America Water-washed Market by Country, 2023 - 2030, USD Million
- TABLE 123 North America Water-washed Market by Country, 2019 - 2022, Kilo Tonnes
- TABLE 124 North America Water-washed Market by Country, 2023 - 2030, Kilo Tonnes
- TABLE 125 North America Airfloat Market by Country, 2019 - 2022, USD Million
- TABLE 126 North America Airfloat Market by Country, 2023 - 2030, USD Million
- TABLE 127 North America Airfloat Market by Country, 2019 - 2022, Kilo Tonnes
- TABLE 128 North America Airfloat Market by Country, 2023 - 2030, Kilo Tonnes
- TABLE 129 North America Calcined Market by Country, 2019 - 2022, USD Million
- TABLE 130 North America Calcined Market by Country, 2023 - 2030, USD Million
- TABLE 131 North America Calcined Market by Country, 2019 - 2022, Kilo Tonnes
- TABLE 132 North America Calcined Market by Country, 2023 - 2030, Kilo Tonnes
- TABLE 133 North America Delaminated Market by Country, 2019 - 2022, USD Million
- TABLE 134 North America Delaminated Market by Country, 2023 - 2030, USD Million
- TABLE 135 North America Delaminated Market by Country, 2019 - 2022, Kilo Tonnes
- TABLE 136 North America Delaminated Market by Country, 2023 - 2030, Kilo Tonnes
- TABLE 137 North America Surface-modified & Unprocessed Market by Country, 2019 - 2022, USD Million
- TABLE 138 North America Surface-modified & Unprocessed Market by Country, 2023 - 2030, USD Million
- TABLE 139 North America Surface-modified & Unprocessed Market by Country, 2019 - 2022, Kilo Tonnes
- TABLE 140 North America Surface-modified & Unprocessed Market by Country, 2023 - 2030, Kilo Tonnes
- TABLE 141 North America Kaolin Market by Country, 2019 - 2022, USD Million
- TABLE 142 North America Kaolin Market by Country, 2023 - 2030, USD Million
- TABLE 143 North America Kaolin Market by Country, 2019 - 2022, Kilo Tonnes
- TABLE 144 North America Kaolin Market by Country, 2023 - 2030, Kilo Tonnes
- TABLE 145 US Kaolin Market, 2019 - 2022, USD Million
- TABLE 146 US Kaolin Market, 2023 - 2030, USD Million
- TABLE 147 US Kaolin Market, 2019 - 2022, Kilo Tonnes
- TABLE 148 US Kaolin Market, 2023 - 2030, Kilo Tonnes
- TABLE 149 US Kaolin Market by Application, 2019 - 2022, USD Million
- TABLE 150 US Kaolin Market by Application, 2023 - 2030, USD Million
- TABLE 151 US Kaolin Market by Application, 2019 - 2022, Kilo Tonnes
- TABLE 152 US Kaolin Market by Application, 2023 - 2030, Kilo Tonnes
- TABLE 153 US Kaolin Market by Process, 2019 - 2022, USD Million
- TABLE 154 US Kaolin Market by Process, 2023 - 2030, USD Million
- TABLE 155 US Kaolin Market by Process, 2019 - 2022, Kilo Tonnes
- TABLE 156 US Kaolin Market by Process, 2023 - 2030, Kilo Tonnes
- TABLE 157 Canada Kaolin Market, 2019 - 2022, USD Million
- TABLE 158 Canada Kaolin Market, 2023 - 2030, USD Million
- TABLE 159 Canada Kaolin Market, 2019 - 2022, Kilo Tonnes
- TABLE 160 Canada Kaolin Market, 2023 - 2030, Kilo Tonnes
- TABLE 161 Canada Kaolin Market by Application, 2019 - 2022, USD Million
- TABLE 162 Canada Kaolin Market by Application, 2023 - 2030, USD Million
- TABLE 163 Canada Kaolin Market by Application, 2019 - 2022, Kilo Tonnes
- TABLE 164 Canada Kaolin Market by Application, 2023 - 2030, Kilo Tonnes
- TABLE 165 Canada Kaolin Market by Process, 2019 - 2022, USD Million
- TABLE 166 Canada Kaolin Market by Process, 2023 - 2030, USD Million
- TABLE 167 Canada Kaolin Market by Process, 2019 - 2022, Kilo Tonnes
- TABLE 168 Canada Kaolin Market by Process, 2023 - 2030, Kilo Tonnes
- TABLE 169 Mexico Kaolin Market, 2019 - 2022, USD Million
- TABLE 170 Mexico Kaolin Market, 2023 - 2030, USD Million
- TABLE 171 Mexico Kaolin Market, 2019 - 2022, Kilo Tonnes
- TABLE 172 Mexico Kaolin Market, 2023 - 2030, Kilo Tonnes
- TABLE 173 Mexico Kaolin Market by Application, 2019 - 2022, USD Million
- TABLE 174 Mexico Kaolin Market by Application, 2023 - 2030, USD Million
- TABLE 175 Mexico Kaolin Market by Application, 2019 - 2022, Kilo Tonnes
- TABLE 176 Mexico Kaolin Market by Application, 2023 - 2030, Kilo Tonnes
- TABLE 177 Mexico Kaolin Market by Process, 2019 - 2022, USD Million
- TABLE 178 Mexico Kaolin Market by Process, 2023 - 2030, USD Million
- TABLE 179 Mexico Kaolin Market by Process, 2019 - 2022, Kilo Tonnes
- TABLE 180 Mexico Kaolin Market by Process, 2023 - 2030, Kilo Tonnes
- TABLE 181 Rest of North America Kaolin Market, 2019 - 2022, USD Million
- TABLE 182 Rest of North America Kaolin Market, 2023 - 2030, USD Million
- TABLE 183 Rest of North America Kaolin Market, 2019 - 2022, Kilo Tonnes
- TABLE 184 Rest of North America Kaolin Market, 2023 - 2030, Kilo Tonnes
- TABLE 185 Rest of North America Kaolin Market by Application, 2019 - 2022, USD Million
- TABLE 186 Rest of North America Kaolin Market by Application, 2023 - 2030, USD Million
- TABLE 187 Rest of North America Kaolin Market by Application, 2019 - 2022, Kilo Tonnes
- TABLE 188 Rest of North America Kaolin Market by Application, 2023 - 2030, Kilo Tonnes
- TABLE 189 Rest of North America Kaolin Market by Process, 2019 - 2022, USD Million
- TABLE 190 Rest of North America Kaolin Market by Process, 2023 - 2030, USD Million
- TABLE 191 Rest of North America Kaolin Market by Process, 2019 - 2022, Kilo Tonnes
- TABLE 192 Rest of North America Kaolin Market by Process, 2023 - 2030, Kilo Tonnes
- TABLE 193 Europe Kaolin Market, 2019 - 2022, USD Million
- TABLE 194 Europe Kaolin Market, 2023 - 2030, USD Million
- TABLE 195 Europe Kaolin Market, 2019 - 2022, Kilo Tonnes
- TABLE 196 Europe Kaolin Market, 2023 - 2030, Kilo Tonnes
- TABLE 197 Europe Kaolin Market by Application, 2019 - 2022, USD Million
- TABLE 198 Europe Kaolin Market by Application, 2023 - 2030, USD Million
- TABLE 199 Europe Kaolin Market by Application, 2019 - 2022, Kilo Tonnes
- TABLE 200 Europe Kaolin Market by Application, 2023 - 2030, Kilo Tonnes
- TABLE 201 Europe Paper Market by Country, 2019 - 2022, USD Million
- TABLE 202 Europe Paper Market by Country, 2023 - 2030, USD Million
- TABLE 203 Europe Paper Market by Country, 2019 - 2022, Kilo Tonnes
- TABLE 204 Europe Paper Market by Country, 2023 - 2030, Kilo Tonnes
- TABLE 205 Europe Ceramics Market by Country, 2019 - 2022, USD Million
- TABLE 206 Europe Ceramics Market by Country, 2023 - 2030, USD Million
- TABLE 207 Europe Ceramics Market by Country, 2019 - 2022, Kilo Tonnes
- TABLE 208 Europe Ceramics Market by Country, 2023 - 2030, Kilo Tonnes
- TABLE 209 Europe Fiber Glass Market by Country, 2019 - 2022, USD Million
- TABLE 210 Europe Fiber Glass Market by Country, 2023 - 2030, USD Million
- TABLE 211 Europe Fiber Glass Market by Country, 2019 - 2022, Kilo Tonnes
- TABLE 212 Europe Fiber Glass Market by Country, 2023 - 2030, Kilo Tonnes
- TABLE 213 Europe Rubber Market by Country, 2019 - 2022, USD Million
- TABLE 214 Europe Rubber Market by Country, 2023 - 2030, USD Million
- TABLE 215 Europe Rubber Market by Country, 2019 - 2022, Kilo Tonnes
- TABLE 216 Europe Rubber Market by Country, 2023 - 2030, Kilo Tonnes
- TABLE 217 Europe Pharmaceuticals & Medical Market by Country, 2019 - 2022, USD Million
- TABLE 218 Europe Pharmaceuticals & Medical Market by Country, 2023 - 2030, USD Million
- TABLE 219 Europe Pharmaceuticals & Medical Market by Country, 2019 - 2022, Kilo Tonnes
- TABLE 220 Europe Pharmaceuticals & Medical Market by Country, 2023 - 2030, Kilo Tonnes
- TABLE 221 Europe Paints & Coatings Market by Country, 2019 - 2022, USD Million
- TABLE 222 Europe Paints & Coatings Market by Country, 2023 - 2030, USD Million
- TABLE 223 Europe Paints & Coatings Market by Country, 2019 - 2022, Kilo Tonnes
- TABLE 224 Europe Paints & Coatings Market by Country, 2023 - 2030, Kilo Tonnes
- TABLE 225 Europe Cosmetics Market by Country, 2019 - 2022, USD Million
- TABLE 226 Europe Cosmetics Market by Country, 2023 - 2030, USD Million
- TABLE 227 Europe Cosmetics Market by Country, 2019 - 2022, Kilo Tonnes
- TABLE 228 Europe Cosmetics Market by Country, 2023 - 2030, Kilo Tonnes
- TABLE 229 Europe Plastics Market by Country, 2019 - 2022, USD Million
- TABLE 230 Europe Plastics Market by Country, 2023 - 2030, USD Million
- TABLE 231 Europe Plastics Market by Country, 2019 - 2022, Kilo Tonnes
- TABLE 232 Europe Plastics Market by Country, 2023 - 2030, Kilo Tonnes
- TABLE 233 Europe Others Market by Country, 2019 - 2022, USD Million
- TABLE 234 Europe Others Market by Country, 2023 - 2030, USD Million
- TABLE 235 Europe Others Market by Country, 2019 - 2022, Kilo Tonnes
- TABLE 236 Europe Others Market by Country, 2023 - 2030, Kilo Tonnes
- TABLE 237 Europe Kaolin Market by Process, 2019 - 2022, USD Million
- TABLE 238 Europe Kaolin Market by Process, 2023 - 2030, USD Million
- TABLE 239 Europe Kaolin Market by Process, 2019 - 2022, Kilo Tonnes
- TABLE 240 Europe Kaolin Market by Process, 2023 - 2030, Kilo Tonnes
- TABLE 241 Europe Water-washed Market by Country, 2019 - 2022, USD Million
- TABLE 242 Europe Water-washed Market by Country, 2023 - 2030, USD Million
- TABLE 243 Europe Water-washed Market by Country, 2019 - 2022, Kilo Tonnes
- TABLE 244 Europe Water-washed Market by Country, 2023 - 2030, Kilo Tonnes
- TABLE 245 Europe Airfloat Market by Country, 2019 - 2022, USD Million
- TABLE 246 Europe Airfloat Market by Country, 2023 - 2030, USD Million
- TABLE 247 Europe Airfloat Market by Country, 2019 - 2022, Kilo Tonnes
- TABLE 248 Europe Airfloat Market by Country, 2023 - 2030, Kilo Tonnes
- TABLE 249 Europe Calcined Market by Country, 2019 - 2022, USD Million
- TABLE 250 Europe Calcined Market by Country, 2023 - 2030, USD Million
- TABLE 251 Europe Calcined Market by Country, 2019 - 2022, Kilo Tonnes
- TABLE 252 Europe Calcined Market by Country, 2023 - 2030, Kilo Tonnes
- TABLE 253 Europe Delaminated Market by Country, 2019 - 2022, USD Million
- TABLE 254 Europe Delaminated Market by Country, 2023 - 2030, USD Million
- TABLE 255 Europe Delaminated Market by Country, 2019 - 2022, Kilo Tonnes
- TABLE 256 Europe Delaminated Market by Country, 2023 - 2030, Kilo Tonnes
- TABLE 257 Europe Surface-modified & Unprocessed Market by Country, 2019 - 2022, USD Million
- TABLE 258 Europe Surface-modified & Unprocessed Market by Country, 2023 - 2030, USD Million
- TABLE 259 Europe Surface-modified & Unprocessed Market by Country, 2019 - 2022, Kilo Tonnes
- TABLE 260 Europe Surface-modified & Unprocessed Market by Country, 2023 - 2030, Kilo Tonnes
- TABLE 261 Europe Kaolin Market by Country, 2019 - 2022, USD Million
- TABLE 262 Europe Kaolin Market by Country, 2023 - 2030, USD Million
- TABLE 263 Europe Kaolin Market by Country, 2019 - 2022, Kilo Tonnes
- TABLE 264 Europe Kaolin Market by Country, 2023 - 2030, Kilo Tonnes
- TABLE 265 Germany Kaolin Market, 2019 - 2022, USD Million
- TABLE 266 Germany Kaolin Market, 2023 - 2030, USD Million
- TABLE 267 Germany Kaolin Market, 2019 - 2022, Kilo Tonnes
- TABLE 268 Germany Kaolin Market, 2023 - 2030, Kilo Tonnes
- TABLE 269 Germany Kaolin Market by Application, 2019 - 2022, USD Million
- TABLE 270 Germany Kaolin Market by Application, 2023 - 2030, USD Million
- TABLE 271 Germany Kaolin Market by Application, 2019 - 2022, Kilo Tonnes
- TABLE 272 Germany Kaolin Market by Application, 2023 - 2030, Kilo Tonnes
- TABLE 273 Germany Kaolin Market by Process, 2019 - 2022, USD Million
- TABLE 274 Germany Kaolin Market by Process, 2023 - 2030, USD Million
- TABLE 275 Germany Kaolin Market by Process, 2019 - 2022, Kilo Tonnes
- TABLE 276 Germany Kaolin Market by Process, 2023 - 2030, Kilo Tonnes
- TABLE 277 UK Kaolin Market, 2019 - 2022, USD Million
- TABLE 278 UK Kaolin Market, 2023 - 2030, USD Million
- TABLE 279 UK Kaolin Market, 2019 - 2022, Kilo Tonnes
- TABLE 280 UK Kaolin Market, 2023 - 2030, Kilo Tonnes
- TABLE 281 UK Kaolin Market by Application, 2019 - 2022, USD Million
- TABLE 282 UK Kaolin Market by Application, 2023 - 2030, USD Million
- TABLE 283 UK Kaolin Market by Application, 2019 - 2022, Kilo Tonnes
- TABLE 284 UK Kaolin Market by Application, 2023 - 2030, Kilo Tonnes
- TABLE 285 UK Kaolin Market by Process, 2019 - 2022, USD Million
- TABLE 286 UK Kaolin Market by Process, 2023 - 2030, USD Million
- TABLE 287 UK Kaolin Market by Process, 2019 - 2022, Kilo Tonnes
- TABLE 288 UK Kaolin Market by Process, 2023 - 2030, Kilo Tonnes
- TABLE 289 France Kaolin Market, 2019 - 2022, USD Million
- TABLE 290 France Kaolin Market, 2023 - 2030, USD Million
- TABLE 291 France Kaolin Market, 2019 - 2022, Kilo Tonnes
- TABLE 292 France Kaolin Market, 2023 - 2030, Kilo Tonnes
- TABLE 293 France Kaolin Market by Application, 2019 - 2022, USD Million
- TABLE 294 France Kaolin Market by Application, 2023 - 2030, USD Million
- TABLE 295 France Kaolin Market by Application, 2019 - 2022, Kilo Tonnes
- TABLE 296 France Kaolin Market by Application, 2023 - 2030, Kilo Tonnes
- TABLE 297 France Kaolin Market by Process, 2019 - 2022, USD Million
- TABLE 298 France Kaolin Market by Process, 2023 - 2030, USD Million
- TABLE 299 France Kaolin Market by Process, 2019 - 2022, Kilo Tonnes
- TABLE 300 France Kaolin Market by Process, 2023 - 2030, Kilo Tonnes
- TABLE 301 Russia Kaolin Market, 2019 - 2022, USD Million
- TABLE 302 Russia Kaolin Market, 2023 - 2030, USD Million
- TABLE 303 Russia Kaolin Market, 2019 - 2022, Kilo Tonnes
- TABLE 304 Russia Kaolin Market, 2023 - 2030, Kilo Tonnes
- TABLE 305 Russia Kaolin Market by Application, 2019 - 2022, USD Million
- TABLE 306 Russia Kaolin Market by Application, 2023 - 2030, USD Million
- TABLE 307 Russia Kaolin Market by Application, 2019 - 2022, Kilo Tonnes
- TABLE 308 Russia Kaolin Market by Application, 2023 - 2030, Kilo Tonnes
- TABLE 309 Russia Kaolin Market by Process, 2019 - 2022, USD Million
- TABLE 310 Russia Kaolin Market by Process, 2023 - 2030, USD Million
- TABLE 311 Russia Kaolin Market by Process, 2019 - 2022, Kilo Tonnes
- TABLE 312 Russia Kaolin Market by Process, 2023 - 2030, Kilo Tonnes
- TABLE 313 Spain Kaolin Market, 2019 - 2022, USD Million
- TABLE 314 Spain Kaolin Market, 2023 - 2030, USD Million
- TABLE 315 Spain Kaolin Market, 2019 - 2022, Kilo Tonnes
- TABLE 316 Spain Kaolin Market, 2023 - 2030, Kilo Tonnes
- TABLE 317 Spain Kaolin Market by Application, 2019 - 2022, USD Million
- TABLE 318 Spain Kaolin Market by Application, 2023 - 2030, USD Million
- TABLE 319 Spain Kaolin Market by Application, 2019 - 2022, Kilo Tonnes
- TABLE 320 Spain Kaolin Market by Application, 2023 - 2030, Kilo Tonnes
- TABLE 321 Spain Kaolin Market by Process, 2019 - 2022, USD Million
- TABLE 322 Spain Kaolin Market by Process, 2023 - 2030, USD Million
- TABLE 323 Spain Kaolin Market by Process, 2019 - 2022, Kilo Tonnes
- TABLE 324 Spain Kaolin Market by Process, 2023 - 2030, Kilo Tonnes
- TABLE 325 Italy Kaolin Market, 2019 - 2022, USD Million
- TABLE 326 Italy Kaolin Market, 2023 - 2030, USD Million
- TABLE 327 Italy Kaolin Market, 2019 - 2022, Kilo Tonnes
- TABLE 328 Italy Kaolin Market, 2023 - 2030, Kilo Tonnes
- TABLE 329 Italy Kaolin Market by Application, 2019 - 2022, USD Million
- TABLE 330 Italy Kaolin Market by Application, 2023 - 2030, USD Million
- TABLE 331 Italy Kaolin Market by Application, 2019 - 2022, Kilo Tonnes
- TABLE 332 Italy Kaolin Market by Application, 2023 - 2030, Kilo Tonnes
- TABLE 333 Italy Kaolin Market by Process, 2019 - 2022, USD Million
- TABLE 334 Italy Kaolin Market by Process, 2023 - 2030, USD Million
- TABLE 335 Italy Kaolin Market by Process, 2019 - 2022, Kilo Tonnes
- TABLE 336 Italy Kaolin Market by Process, 2023 - 2030, Kilo Tonnes
- TABLE 337 Rest of Europe Kaolin Market, 2019 - 2022, USD Million
- TABLE 338 Rest of Europe Kaolin Market, 2023 - 2030, USD Million
- TABLE 339 Rest of Europe Kaolin Market, 2019 - 2022, Kilo Tonnes
- TABLE 340 Rest of Europe Kaolin Market, 2023 - 2030, Kilo Tonnes
- TABLE 341 Rest of Europe Kaolin Market by Application, 2019 - 2022, USD Million
- TABLE 342 Rest of Europe Kaolin Market by Application, 2023 - 2030, USD Million
- TABLE 343 Rest of Europe Kaolin Market by Application, 2019 - 2022, Kilo Tonnes
- TABLE 344 Rest of Europe Kaolin Market by Application, 2023 - 2030, Kilo Tonnes
- TABLE 345 Rest of Europe Kaolin Market by Process, 2019 - 2022, USD Million
- TABLE 346 Rest of Europe Kaolin Market by Process, 2023 - 2030, USD Million
- TABLE 347 Rest of Europe Kaolin Market by Process, 2019 - 2022, Kilo Tonnes
- TABLE 348 Rest of Europe Kaolin Market by Process, 2023 - 2030, Kilo Tonnes
- TABLE 349 Asia Pacific Kaolin Market, 2019 - 2022, USD Million
- TABLE 350 Asia Pacific Kaolin Market, 2023 - 2030, USD Million
- TABLE 351 Asia Pacific Kaolin Market, 2019 - 2022, Kilo Tonnes
- TABLE 352 Asia Pacific Kaolin Market, 2023 - 2030, Kilo Tonnes
- TABLE 353 Asia Pacific Kaolin Market by Application, 2019 - 2022, USD Million
- TABLE 354 Asia Pacific Kaolin Market by Application, 2023 - 2030, USD Million
- TABLE 355 Asia Pacific Kaolin Market by Application, 2019 - 2022, Kilo Tonnes
- TABLE 356 Asia Pacific Kaolin Market by Application, 2023 - 2030, Kilo Tonnes
- TABLE 357 Asia Pacific Paper Market by Country, 2019 - 2022, USD Million
- TABLE 358 Asia Pacific Paper Market by Country, 2023 - 2030, USD Million
- TABLE 359 Asia Pacific Paper Market by Country, 2019 - 2022, Kilo Tonnes
- TABLE 360 Asia Pacific Paper Market by Country, 2023 - 2030, Kilo Tonnes
- TABLE 361 Asia Pacific Ceramics Market by Country, 2019 - 2022, USD Million
- TABLE 362 Asia Pacific Ceramics Market by Country, 2023 - 2030, USD Million
- TABLE 363 Asia Pacific Ceramics Market by Country, 2019 - 2022, Kilo Tonnes
- TABLE 364 Asia Pacific Ceramics Market by Country, 2023 - 2030, Kilo Tonnes
- TABLE 365 Asia Pacific Fiber Glass Market by Country, 2019 - 2022, USD Million
- TABLE 366 Asia Pacific Fiber Glass Market by Country, 2023 - 2030, USD Million
- TABLE 367 Asia Pacific Fiber Glass Market by Country, 2019 - 2022, Kilo Tonnes
- TABLE 368 Asia Pacific Fiber Glass Market by Country, 2023 - 2030, Kilo Tonnes
- TABLE 369 Asia Pacific Rubber Market by Country, 2019 - 2022, USD Million
- TABLE 370 Asia Pacific Rubber Market by Country, 2023 - 2030, USD Million
- TABLE 371 Asia Pacific Rubber Market by Country, 2019 - 2022, Kilo Tonnes
- TABLE 372 Asia Pacific Rubber Market by Country, 2023 - 2030, Kilo Tonnes
- TABLE 373 Asia Pacific Pharmaceuticals & Medical Market by Country, 2019 - 2022, USD Million
- TABLE 374 Asia Pacific Pharmaceuticals & Medical Market by Country, 2023 - 2030, USD Million
- TABLE 375 Asia Pacific Pharmaceuticals & Medical Market by Country, 2019 - 2022, Kilo Tonnes
- TABLE 376 Asia Pacific Pharmaceuticals & Medical Market by Country, 2023 - 2030, Kilo Tonnes
- TABLE 377 Asia Pacific Paints & Coatings Market by Country, 2019 - 2022, USD Million
- TABLE 378 Asia Pacific Paints & Coatings Market by Country, 2023 - 2030, USD Million
- TABLE 379 Asia Pacific Paints & Coatings Market by Country, 2019 - 2022, Kilo Tonnes
- TABLE 380 Asia Pacific Paints & Coatings Market by Country, 2023 - 2030, Kilo Tonnes
- TABLE 381 Asia Pacific Cosmetics Market by Country, 2019 - 2022, USD Million
- TABLE 382 Asia Pacific Cosmetics Market by Country, 2023 - 2030, USD Million
- TABLE 383 Asia Pacific Cosmetics Market by Country, 2019 - 2022, Kilo Tonnes
- TABLE 384 Asia Pacific Cosmetics Market by Country, 2023 - 2030, Kilo Tonnes
- TABLE 385 Asia Pacific Plastics Market by Country, 2019 - 2022, USD Million
- TABLE 386 Asia Pacific Plastics Market by Country, 2023 - 2030, USD Million
- TABLE 387 Asia Pacific Plastics Market by Country, 2019 - 2022, Kilo Tonnes
- TABLE 388 Asia Pacific Plastics Market by Country, 2023 - 2030, Kilo Tonnes
- TABLE 389 Asia Pacific Others Market by Country, 2019 - 2022, USD Million
- TABLE 390 Asia Pacific Others Market by Country, 2023 - 2030, USD Million
- TABLE 391 Asia Pacific Others Market by Country, 2019 - 2022, Kilo Tonnes
- TABLE 392 Asia Pacific Others Market by Country, 2023 - 2030, Kilo Tonnes
- TABLE 393 Asia Pacific Kaolin Market by Process, 2019 - 2022, USD Million
- TABLE 394 Asia Pacific Kaolin Market by Process, 2023 - 2030, USD Million
- TABLE 395 Asia Pacific Kaolin Market by Process, 2019 - 2022, Kilo Tonnes
- TABLE 396 Asia Pacific Kaolin Market by Process, 2023 - 2030, Kilo Tonnes
- TABLE 397 Asia Pacific Water-washed Market by Country, 2019 - 2022, USD Million
- TABLE 398 Asia Pacific Water-washed Market by Country, 2023 - 2030, USD Million
- TABLE 399 Asia Pacific Water-washed Market by Country, 2019 - 2022, Kilo Tonnes
- TABLE 400 Asia Pacific Water-washed Market by Country, 2023 - 2030, Kilo Tonnes
- TABLE 401 Asia Pacific Airfloat Market by Country, 2019 - 2022, USD Million
- TABLE 402 Asia Pacific Airfloat Market by Country, 2023 - 2030, USD Million
- TABLE 403 Asia Pacific Airfloat Market by Country, 2019 - 2022, Kilo Tonnes
- TABLE 404 Asia Pacific Airfloat Market by Country, 2023 - 2030, Kilo Tonnes
- TABLE 405 Asia Pacific Calcined Market by Country, 2019 - 2022, USD Million
- TABLE 406 Asia Pacific Calcined Market by Country, 2023 - 2030, USD Million
- TABLE 407 Asia Pacific Calcined Market by Country, 2019 - 2022, Kilo Tonnes
- TABLE 408 Asia Pacific Calcined Market by Country, 2023 - 2030, Kilo Tonnes
- TABLE 409 Asia Pacific Delaminated Market by Country, 2019 - 2022, USD Million
- TABLE 410 Asia Pacific Delaminated Market by Country, 2023 - 2030, USD Million
- TABLE 411 Asia Pacific Delaminated Market by Country, 2019 - 2022, Kilo Tonnes
- TABLE 412 Asia Pacific Delaminated Market by Country, 2023 - 2030, Kilo Tonnes
- TABLE 413 Asia Pacific Surface-modified & Unprocessed Market by Country, 2019 - 2022, USD Million
- TABLE 414 Asia Pacific Surface-modified & Unprocessed Market by Country, 2023 - 2030, USD Million
- TABLE 415 Asia Pacific Surface-modified & Unprocessed Market by Country, 2019 - 2022, Kilo Tonnes
- TABLE 416 Asia Pacific Surface-modified & Unprocessed Market by Country, 2023 - 2030, Kilo Tonnes
- TABLE 417 Asia Pacific Kaolin Market by Country, 2019 - 2022, USD Million
- TABLE 418 Asia Pacific Kaolin Market by Country, 2023 - 2030, USD Million
- TABLE 419 Asia Pacific Kaolin Market by Country, 2019 - 2022, Kilo Tonnes
- TABLE 420 Asia Pacific Kaolin Market by Country, 2023 - 2030, Kilo Tonnes
- TABLE 421 China Kaolin Market, 2019 - 2022, USD Million
- TABLE 422 China Kaolin Market, 2023 - 2030, USD Million
- TABLE 423 China Kaolin Market, 2019 - 2022, Kilo Tonnes
- TABLE 424 China Kaolin Market, 2023 - 2030, Kilo Tonnes
- TABLE 425 China Kaolin Market by Application, 2019 - 2022, USD Million
- TABLE 426 China Kaolin Market by Application, 2023 - 2030, USD Million
- TABLE 427 China Kaolin Market by Application, 2019 - 2022, Kilo Tonnes
- TABLE 428 China Kaolin Market by Application, 2023 - 2030, Kilo Tonnes
- TABLE 429 China Kaolin Market by Process, 2019 - 2022, USD Million
- TABLE 430 China Kaolin Market by Process, 2023 - 2030, USD Million
- TABLE 431 China Kaolin Market by Process, 2019 - 2022, Kilo Tonnes
- TABLE 432 China Kaolin Market by Process, 2023 - 2030, Kilo Tonnes
- TABLE 433 Japan Kaolin Market, 2019 - 2022, USD Million
- TABLE 434 Japan Kaolin Market, 2023 - 2030, USD Million
- TABLE 435 Japan Kaolin Market, 2019 - 2022, Kilo Tonnes
- TABLE 436 Japan Kaolin Market, 2023 - 2030, Kilo Tonnes
- TABLE 437 Japan Kaolin Market by Application, 2019 - 2022, USD Million
- TABLE 438 Japan Kaolin Market by Application, 2023 - 2030, USD Million
- TABLE 439 Japan Kaolin Market by Application, 2019 - 2022, Kilo Tonnes
- TABLE 440 Japan Kaolin Market by Application, 2023 - 2030, Kilo Tonnes
- TABLE 441 Japan Kaolin Market by Process, 2019 - 2022, USD Million
- TABLE 442 Japan Kaolin Market by Process, 2023 - 2030, USD Million
- TABLE 443 Japan Kaolin Market by Process, 2019 - 2022, Kilo Tonnes
- TABLE 444 Japan Kaolin Market by Process, 2023 - 2030, Kilo Tonnes
- TABLE 445 India Kaolin Market, 2019 - 2022, USD Million
- TABLE 446 India Kaolin Market, 2023 - 2030, USD Million
- TABLE 447 India Kaolin Market, 2019 - 2022, Kilo Tonnes
- TABLE 448 India Kaolin Market, 2023 - 2030, Kilo Tonnes
- TABLE 449 India Kaolin Market by Application, 2019 - 2022, USD Million
- TABLE 450 India Kaolin Market by Application, 2023 - 2030, USD Million
- TABLE 451 India Kaolin Market by Application, 2019 - 2022, Kilo Tonnes
- TABLE 452 India Kaolin Market by Application, 2023 - 2030, Kilo Tonnes
- TABLE 453 India Kaolin Market by Process, 2019 - 2022, USD Million
- TABLE 454 India Kaolin Market by Process, 2023 - 2030, USD Million
- TABLE 455 India Kaolin Market by Process, 2019 - 2022, Kilo Tonnes
- TABLE 456 India Kaolin Market by Process, 2023 - 2030, Kilo Tonnes
- TABLE 457 South Korea Kaolin Market, 2019 - 2022, USD Million
- TABLE 458 South Korea Kaolin Market, 2023 - 2030, USD Million
- TABLE 459 South Korea Kaolin Market, 2019 - 2022, Kilo Tonnes
- TABLE 460 South Korea Kaolin Market, 2023 - 2030, Kilo Tonnes
- TABLE 461 South Korea Kaolin Market by Application, 2019 - 2022, USD Million
- TABLE 462 South Korea Kaolin Market by Application, 2023 - 2030, USD Million
- TABLE 463 South Korea Kaolin Market by Application, 2019 - 2022, Kilo Tonnes
- TABLE 464 South Korea Kaolin Market by Application, 2023 - 2030, Kilo Tonnes
- TABLE 465 South Korea Kaolin Market by Process, 2019 - 2022, USD Million
- TABLE 466 South Korea Kaolin Market by Process, 2023 - 2030, USD Million
- TABLE 467 South Korea Kaolin Market by Process, 2019 - 2022, Kilo Tonnes
- TABLE 468 South Korea Kaolin Market by Process, 2023 - 2030, Kilo Tonnes
- TABLE 469 Singapore Kaolin Market, 2019 - 2022, USD Million
- TABLE 470 Singapore Kaolin Market, 2023 - 2030, USD Million
- TABLE 471 Singapore Kaolin Market, 2019 - 2022, Kilo Tonnes
- TABLE 472 Singapore Kaolin Market, 2023 - 2030, Kilo Tonnes
- TABLE 473 Singapore Kaolin Market by Application, 2019 - 2022, USD Million
- TABLE 474 Singapore Kaolin Market by Application, 2023 - 2030, USD Million
- TABLE 475 Singapore Kaolin Market by Application, 2019 - 2022, Kilo Tonnes
- TABLE 476 Singapore Kaolin Market by Application, 2023 - 2030, Kilo Tonnes
- TABLE 477 Singapore Kaolin Market by Process, 2019 - 2022, USD Million
- TABLE 478 Singapore Kaolin Market by Process, 2023 - 2030, USD Million
- TABLE 479 Singapore Kaolin Market by Process, 2019 - 2022, Kilo Tonnes
- TABLE 480 Singapore Kaolin Market by Process, 2023 - 2030, Kilo Tonnes
- TABLE 481 Malaysia Kaolin Market, 2019 - 2022, USD Million
- TABLE 482 Malaysia Kaolin Market, 2023 - 2030, USD Million
- TABLE 483 Malaysia Kaolin Market, 2019 - 2022, Kilo Tonnes
- TABLE 484 Malaysia Kaolin Market, 2023 - 2030, Kilo Tonnes
- TABLE 485 Malaysia Kaolin Market by Application, 2019 - 2022, USD Million
- TABLE 486 Malaysia Kaolin Market by Application, 2023 - 2030, USD Million
- TABLE 487 Malaysia Kaolin Market by Application, 2019 - 2022, Kilo Tonnes
- TABLE 488 Malaysia Kaolin Market by Application, 2023 - 2030, Kilo Tonnes
- TABLE 489 Malaysia Kaolin Market by Process, 2019 - 2022, USD Million
- TABLE 490 Malaysia Kaolin Market by Process, 2023 - 2030, USD Million
- TABLE 491 Malaysia Kaolin Market by Process, 2019 - 2022, Kilo Tonnes
- TABLE 492 Malaysia Kaolin Market by Process, 2023 - 2030, Kilo Tonnes
- TABLE 493 Rest of Asia Pacific Kaolin Market, 2019 - 2022, USD Million
- TABLE 494 Rest of Asia Pacific Kaolin Market, 2023 - 2030, USD Million
- TABLE 495 Rest of Asia Pacific Kaolin Market, 2019 - 2022, Kilo Tonnes
- TABLE 496 Rest of Asia Pacific Kaolin Market, 2023 - 2030, Kilo Tonnes
- TABLE 497 Rest of Asia Pacific Kaolin Market by Application, 2019 - 2022, USD Million
- TABLE 498 Rest of Asia Pacific Kaolin Market by Application, 2023 - 2030, USD Million
- TABLE 499 Rest of Asia Pacific Kaolin Market by Application, 2019 - 2022, Kilo Tonnes
- TABLE 500 Rest of Asia Pacific Kaolin Market by Application, 2023 - 2030, Kilo Tonnes
- TABLE 501 Rest of Asia Pacific Kaolin Market by Process, 2019 - 2022, USD Million
- TABLE 502 Rest of Asia Pacific Kaolin Market by Process, 2023 - 2030, USD Million
- TABLE 503 Rest of Asia Pacific Kaolin Market by Process, 2019 - 2022, Kilo Tonnes
- TABLE 504 Rest of Asia Pacific Kaolin Market by Process, 2023 - 2030, Kilo Tonnes
- TABLE 505 LAMEA Kaolin Market, 2019 - 2022, USD Million
- TABLE 506 LAMEA Kaolin Market, 2023 - 2030, USD Million
- TABLE 507 LAMEA Kaolin Market, 2019 - 2022, Kilo Tonnes
- TABLE 508 LAMEA Kaolin Market, 2023 - 2030, Kilo Tonnes
- TABLE 509 LAMEA Kaolin Market by Application, 2019 - 2022, USD Million
- TABLE 510 LAMEA Kaolin Market by Application, 2023 - 2030, USD Million
- TABLE 511 LAMEA Kaolin Market by Application, 2019 - 2022, Kilo Tonnes
- TABLE 512 LAMEA Kaolin Market by Application, 2023 - 2030, Kilo Tonnes
- TABLE 513 LAMEA Paper Market by Country, 2019 - 2022, USD Million
- TABLE 514 LAMEA Paper Market by Country, 2023 - 2030, USD Million
- TABLE 515 LAMEA Paper Market by Country, 2019 - 2022, Kilo Tonnes
- TABLE 516 LAMEA Paper Market by Country, 2023 - 2030, Kilo Tonnes
- TABLE 517 LAMEA Ceramics Market by Country, 2019 - 2022, USD Million
- TABLE 518 LAMEA Ceramics Market by Country, 2023 - 2030, USD Million
- TABLE 519 LAMEA Ceramics Market by Country, 2019 - 2022, Kilo Tonnes
- TABLE 520 LAMEA Ceramics Market by Country, 2023 - 2030, Kilo Tonnes
- TABLE 521 LAMEA Fiber Glass Market by Country, 2019 - 2022, USD Million
- TABLE 522 LAMEA Fiber Glass Market by Country, 2023 - 2030, USD Million
- TABLE 523 LAMEA Fiber Glass Market by Country, 2019 - 2022, Kilo Tonnes
- TABLE 524 LAMEA Fiber Glass Market by Country, 2023 - 2030, Kilo Tonnes
- TABLE 525 LAMEA Rubber Market by Country, 2019 - 2022, USD Million
- TABLE 526 LAMEA Rubber Market by Country, 2023 - 2030, USD Million
- TABLE 527 LAMEA Rubber Market by Country, 2019 - 2022, Kilo Tonnes
- TABLE 528 LAMEA Rubber Market by Country, 2023 - 2030, Kilo Tonnes
- TABLE 529 LAMEA Pharmaceuticals & Medical Market by Country, 2019 - 2022, USD Million
- TABLE 530 LAMEA Pharmaceuticals & Medical Market by Country, 2023 - 2030, USD Million
- TABLE 531 LAMEA Pharmaceuticals & Medical Market by Country, 2019 - 2022, Kilo Tonnes
- TABLE 532 LAMEA Pharmaceuticals & Medical Market by Country, 2023 - 2030, Kilo Tonnes
- TABLE 533 LAMEA Paints & Coatings Market by Country, 2019 - 2022, USD Million
- TABLE 534 LAMEA Paints & Coatings Market by Country, 2023 - 2030, USD Million
- TABLE 535 LAMEA Paints & Coatings Market by Country, 2019 - 2022, Kilo Tonnes
- TABLE 536 LAMEA Paints & Coatings Market by Country, 2023 - 2030, Kilo Tonnes
- TABLE 537 LAMEA Cosmetics Market by Country, 2019 - 2022, USD Million
- TABLE 538 LAMEA Cosmetics Market by Country, 2023 - 2030, USD Million
- TABLE 539 LAMEA Cosmetics Market by Country, 2019 - 2022, Kilo Tonnes
- TABLE 540 LAMEA Cosmetics Market by Country, 2023 - 2030, Kilo Tonnes
- TABLE 541 LAMEA Plastics Market by Country, 2019 - 2022, USD Million
- TABLE 542 LAMEA Plastics Market by Country, 2023 - 2030, USD Million
- TABLE 543 LAMEA Plastics Market by Country, 2019 - 2022, Kilo Tonnes
- TABLE 544 LAMEA Plastics Market by Country, 2023 - 2030, Kilo Tonnes
- TABLE 545 LAMEA Others Market by Country, 2019 - 2022, USD Million
- TABLE 546 LAMEA Others Market by Country, 2023 - 2030, USD Million
- TABLE 547 LAMEA Others Market by Country, 2019 - 2022, Kilo Tonnes
- TABLE 548 LAMEA Others Market by Country, 2023 - 2030, Kilo Tonnes
- TABLE 549 LAMEA Kaolin Market by Process, 2019 - 2022, USD Million
- TABLE 550 LAMEA Kaolin Market by Process, 2023 - 2030, USD Million
- TABLE 551 LAMEA Kaolin Market by Process, 2019 - 2022, Kilo Tonnes
- TABLE 552 LAMEA Kaolin Market by Process, 2023 - 2030, Kilo Tonnes
- TABLE 553 LAMEA Water-washed Market by Country, 2019 - 2022, USD Million
- TABLE 554 LAMEA Water-washed Market by Country, 2023 - 2030, USD Million
- TABLE 555 LAMEA Water-washed Market by Country, 2019 - 2022, Kilo Tonnes
- TABLE 556 LAMEA Water-washed Market by Country, 2023 - 2030, Kilo Tonnes
- TABLE 557 LAMEA Airfloat Market by Country, 2019 - 2022, USD Million
- TABLE 558 LAMEA Airfloat Market by Country, 2023 - 2030, USD Million
- TABLE 559 LAMEA Airfloat Market by Country, 2019 - 2022, Kilo Tonnes
- TABLE 560 LAMEA Airfloat Market by Country, 2023 - 2030, Kilo Tonnes
- TABLE 561 LAMEA Calcined Market by Country, 2019 - 2022, USD Million
- TABLE 562 LAMEA Calcined Market by Country, 2023 - 2030, USD Million
- TABLE 563 LAMEA Calcined Market by Country, 2019 - 2022, Kilo Tonnes
- TABLE 564 LAMEA Calcined Market by Country, 2023 - 2030, Kilo Tonnes
- TABLE 565 LAMEA Delaminated Market by Country, 2019 - 2022, USD Million
- TABLE 566 LAMEA Delaminated Market by Country, 2023 - 2030, USD Million
- TABLE 567 LAMEA Delaminated Market by Country, 2019 - 2022, Kilo Tonnes
- TABLE 568 LAMEA Delaminated Market by Country, 2023 - 2030, Kilo Tonnes
- TABLE 569 LAMEA Surface-modified & Unprocessed Market by Country, 2019 - 2022, USD Million
- TABLE 570 LAMEA Surface-modified & Unprocessed Market by Country, 2023 - 2030, USD Million
- TABLE 571 LAMEA Surface-modified & Unprocessed Market by Country, 2019 - 2022, Kilo Tonnes
- TABLE 572 LAMEA Surface-modified & Unprocessed Market by Country, 2023 - 2030, Kilo Tonnes
- TABLE 573 LAMEA Kaolin Market by Country, 2019 - 2022, USD Million
- TABLE 574 LAMEA Kaolin Market by Country, 2023 - 2030, USD Million
- TABLE 575 LAMEA Kaolin Market by Country, 2019 - 2022, Kilo Tonnes
- TABLE 576 LAMEA Kaolin Market by Country, 2023 - 2030, Kilo Tonnes
- TABLE 577 Brazil Kaolin Market, 2019 - 2022, USD Million
- TABLE 578 Brazil Kaolin Market, 2023 - 2030, USD Million
- TABLE 579 Brazil Kaolin Market, 2019 - 2022, Kilo Tonnes
- TABLE 580 Brazil Kaolin Market, 2023 - 2030, Kilo Tonnes
- TABLE 581 Brazil Kaolin Market by Application, 2019 - 2022, USD Million
- TABLE 582 Brazil Kaolin Market by Application, 2023 - 2030, USD Million
- TABLE 583 Brazil Kaolin Market by Application, 2019 - 2022, Kilo Tonnes
- TABLE 584 Brazil Kaolin Market by Application, 2023 - 2030, Kilo Tonnes
- TABLE 585 Brazil Kaolin Market by Process, 2019 - 2022, USD Million
- TABLE 586 Brazil Kaolin Market by Process, 2023 - 2030, USD Million
- TABLE 587 Brazil Kaolin Market by Process, 2019 - 2022, Kilo Tonnes
- TABLE 588 Brazil Kaolin Market by Process, 2023 - 2030, Kilo Tonnes
- TABLE 589 Argentina Kaolin Market, 2019 - 2022, USD Million
- TABLE 590 Argentina Kaolin Market, 2023 - 2030, USD Million
- TABLE 591 Argentina Kaolin Market, 2019 - 2022, Kilo Tonnes
- TABLE 592 Argentina Kaolin Market, 2023 - 2030, Kilo Tonnes
- TABLE 593 Argentina Kaolin Market by Application, 2019 - 2022, USD Million
- TABLE 594 Argentina Kaolin Market by Application, 2023 - 2030, USD Million
- TABLE 595 Argentina Kaolin Market by Application, 2019 - 2022, Kilo Tonnes
- TABLE 596 Argentina Kaolin Market by Application, 2023 - 2030, Kilo Tonnes
- TABLE 597 Argentina Kaolin Market by Process, 2019 - 2022, USD Million
- TABLE 598 Argentina Kaolin Market by Process, 2023 - 2030, USD Million
- TABLE 599 Argentina Kaolin Market by Process, 2019 - 2022, Kilo Tonnes
- TABLE 600 Argentina Kaolin Market by Process, 2023 - 2030, Kilo Tonnes
- TABLE 601 UAE Kaolin Market, 2019 - 2022, USD Million
- TABLE 602 UAE Kaolin Market, 2023 - 2030, USD Million
- TABLE 603 UAE Kaolin Market, 2019 - 2022, Kilo Tonnes
- TABLE 604 UAE Kaolin Market, 2023 - 2030, Kilo Tonnes
- TABLE 605 UAE Kaolin Market by Application, 2019 - 2022, USD Million
- TABLE 606 UAE Kaolin Market by Application, 2023 - 2030, USD Million
- TABLE 607 UAE Kaolin Market by Application, 2019 - 2022, Kilo Tonnes
- TABLE 608 UAE Kaolin Market by Application, 2023 - 2030, Kilo Tonnes
- TABLE 609 UAE Kaolin Market by Process, 2019 - 2022, USD Million
- TABLE 610 UAE Kaolin Market by Process, 2023 - 2030, USD Million
- TABLE 611 UAE Kaolin Market by Process, 2019 - 2022, Kilo Tonnes
- TABLE 612 UAE Kaolin Market by Process, 2023 - 2030, Kilo Tonnes
- TABLE 613 Saudi Arabia Kaolin Market, 2019 - 2022, USD Million
- TABLE 614 Saudi Arabia Kaolin Market, 2023 - 2030, USD Million
- TABLE 615 Saudi Arabia Kaolin Market, 2019 - 2022, Kilo Tonnes
- TABLE 616 Saudi Arabia Kaolin Market, 2023 - 2030, Kilo Tonnes
- TABLE 617 Saudi Arabia Kaolin Market by Application, 2019 - 2022, USD Million
- TABLE 618 Saudi Arabia Kaolin Market by Application, 2023 - 2030, USD Million
- TABLE 619 Saudi Arabia Kaolin Market by Application, 2019 - 2022, Kilo Tonnes
- TABLE 620 Saudi Arabia Kaolin Market by Application, 2023 - 2030, Kilo Tonnes
- TABLE 621 Saudi Arabia Kaolin Market by Process, 2019 - 2022, USD Million
- TABLE 622 Saudi Arabia Kaolin Market by Process, 2023 - 2030, USD Million
- TABLE 623 Saudi Arabia Kaolin Market by Process, 2019 - 2022, Kilo Tonnes
- TABLE 624 Saudi Arabia Kaolin Market by Process, 2023 - 2030, Kilo Tonnes
- TABLE 625 South Africa Kaolin Market, 2019 - 2022, USD Million
- TABLE 626 South Africa Kaolin Market, 2023 - 2030, USD Million
- TABLE 627 South Africa Kaolin Market, 2019 - 2022, Kilo Tonnes
- TABLE 628 South Africa Kaolin Market, 2023 - 2030, Kilo Tonnes
- TABLE 629 South Africa Kaolin Market by Application, 2019 - 2022, USD Million
- TABLE 630 South Africa Kaolin Market by Application, 2023 - 2030, USD Million
- TABLE 631 South Africa Kaolin Market by Application, 2019 - 2022, Kilo Tonnes
- TABLE 632 South Africa Kaolin Market by Application, 2023 - 2030, Kilo Tonnes
- TABLE 633 South Africa Kaolin Market by Process, 2019 - 2022, USD Million
- TABLE 634 South Africa Kaolin Market by Process, 2023 - 2030, USD Million
- TABLE 635 South Africa Kaolin Market by Process, 2019 - 2022, Kilo Tonnes
- TABLE 636 South Africa Kaolin Market by Process, 2023 - 2030, Kilo Tonnes
- TABLE 637 Nigeria Kaolin Market, 2019 - 2022, USD Million
- TABLE 638 Nigeria Kaolin Market, 2023 - 2030, USD Million
- TABLE 639 Nigeria Kaolin Market, 2019 - 2022, Kilo Tonnes
- TABLE 640 Nigeria Kaolin Market, 2023 - 2030, Kilo Tonnes
- TABLE 641 Nigeria Kaolin Market by Application, 2019 - 2022, USD Million
- TABLE 642 Nigeria Kaolin Market by Application, 2023 - 2030, USD Million
- TABLE 643 Nigeria Kaolin Market by Application, 2019 - 2022, Kilo Tonnes
- TABLE 644 Nigeria Kaolin Market by Application, 2023 - 2030, Kilo Tonnes
- TABLE 645 Nigeria Kaolin Market by Process, 2019 - 2022, USD Million
- TABLE 646 Nigeria Kaolin Market by Process, 2023 - 2030, USD Million
- TABLE 647 Nigeria Kaolin Market by Process, 2019 - 2022, Kilo Tonnes
- TABLE 648 Nigeria Kaolin Market by Process, 2023 - 2030, Kilo Tonnes
- TABLE 649 Rest of LAMEA Kaolin Market, 2019 - 2022, USD Million
- TABLE 650 Rest of LAMEA Kaolin Market, 2023 - 2030, USD Million
- TABLE 651 Rest of LAMEA Kaolin Market, 2019 - 2022, Kilo Tonnes
- TABLE 652 Rest of LAMEA Kaolin Market, 2023 - 2030, Kilo Tonnes
- TABLE 653 Rest of LAMEA Kaolin Market by Application, 2019 - 2022, USD Million
- TABLE 654 Rest of LAMEA Kaolin Market by Application, 2023 - 2030, USD Million
- TABLE 655 Rest of LAMEA Kaolin Market by Application, 2019 - 2022, Kilo Tonnes
- TABLE 656 Rest of LAMEA Kaolin Market by Application, 2023 - 2030, Kilo Tonnes
- TABLE 657 Rest of LAMEA Kaolin Market by Process, 2019 - 2022, USD Million
- TABLE 658 Rest of LAMEA Kaolin Market by Process, 2023 - 2030, USD Million
- TABLE 659 Rest of LAMEA Kaolin Market by Process, 2019 - 2022, Kilo Tonnes
- TABLE 660 Rest of LAMEA Kaolin Market by Process, 2023 - 2030, Kilo Tonnes
- TABLE 661 Key Information - BASF SE
- TABLE 662 key Information - Imerys S.A.
- TABLE 663 Key Information - Active Minerals International, LLC
- TABLE 664 Key Information - Lasselsberger Group GmbH
- TABLE 665 Key Information - Thiele Kaolin Company
- TABLE 666 Key Information - SCR-Sibelco NV
- TABLE 667 Key Information - Quazwerke GmbH
- TABLE 668 Key Information - 20 microns limited
- TABLE 669 Key Information - W. R. Grace & Co.
- TABLE 670 Key Information - Sedlecky kaolin a.s.
The Global Kaolin Market size is expected to reach $4.8 billion by 2030, rising at a market growth of 3.9% CAGR during the forecast period. In the year 2022, the market attained a volume of 19,735.2 kilo tonnes, experiencing a growth of 3.1% (2019-2022).
The global construction industry's growth drives the demand for ceramic products, such as tiles, sanitaryware, and building materials. Thus, the ceramics segment acquired $949.2 million in 2022. Kaolin is a key ingredient in ceramic formulations used for flooring, wall tiles, and decorative elements in construction, contributing to its increased demand. The expanding global ceramic industry, driven by increasing international trade, contributes to the growing demand for kaolin as a fundamental raw material in ceramic manufacturing worldwide.
The cosmetics and personal care industry represents a driving force behind the demand for kaolin due to its versatile applications and beneficial properties within this sector. It possesses gentle absorbent qualities that make it suitable for skincare formulations. It's utilized in facial masks, cleansers, scrubs, and other skincare products to absorb excess oil, dirt, and impurities from the skin without irritating it, making it suitable for multiple skin types, especially oily and sensitive skin. Additionally, the paints and coatings industry is a significant driver for the market due to the mineral's versatile properties and crucial role in enhancing various aspects of paint and coating formulations. IT is a functional extender in paints and coatings, improving properties like opacity, brightness, and tint strength. It is used as a pigment to enhance coatings' coverage and color development while reducing reliance on more expensive pigments like titanium dioxide. It contributes to coatings' durability and weather resistance, enhancing their performance against harsh environmental conditions, UV radiation, and moisture, extending the lifespan of painted surfaces. Thus, the extensive use of kaolin in painting and coating substances propels the demand for the market.
However, kaolin production involves various inputs, including energy (such as natural gas used in processing), labor, and equipment. Fluctuations in the prices of these inputs directly affect the overall production cost of kaolin. For instance, if energy costs rise abruptly, it can significantly increase the cost of processing kaolin, impacting its market price. Kaolin prices are susceptible to fluctuations caused by shifts in supply and demand. If the demand for kaolin suddenly surges or if there are disruptions in the supply chain, the market might experience price spikes. On the contrary, a contraction in demand or excess supply may result in price reductions, thereby impacting the profitability of kaolin producers. It can affect profit margins, impact investment decisions, and make it harder to secure long-term contracts, as the uncertainty in pricing may deter potential buyers or consumers. Thus, the fluctuations in the raw material prices are impeding the market's growth.
By Application Analysis
Based on application, the market is segmented into paper, ceramics, paint & coatings, fiber glass, plastics, rubber, pharmaceuticals & medical, cosmetics, and others. In 2022, paint & coatings segment witnessed a remarkable revenue share in the market. It acts as an excellent pigment extender and opacifier in paints and coatings, enhancing opacity and brightness while reducing the amount of expensive titanium dioxide required, thereby reducing production costs. The paint and coating segment in the market continues to grow due to kaolin's versatile properties, cost-effectiveness, and role in enhancing the performance and aesthetics of various coatings used in diverse industries.
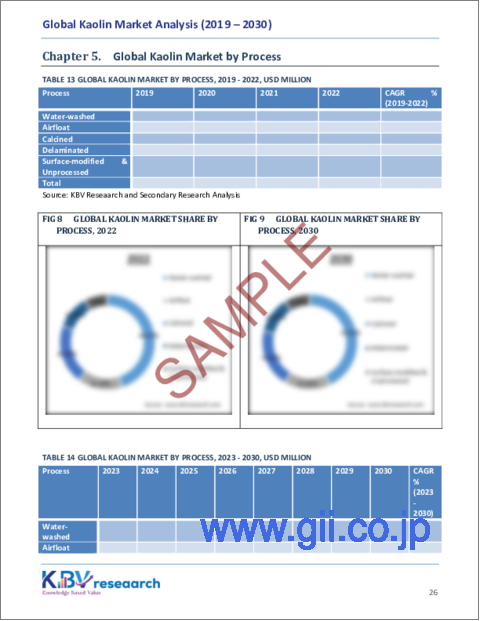
By Process Analysis
By process, the market is divided into water-washed, airfloat, calcined, delaminated, and surface-modified & unprocessed. The water-washed segment procured the largest revenue share in the market in 2022. Water-washed kaolin tends to have a higher purity compared to other processes. This purity is desirable for applications where impurities can be detrimental, such as in the production of ceramics, paper, and pharmaceuticals. Moreover, the water-washing process is considered environmentally friendly, as it typically requires less chemical treatment and generates less waste. These factors, among others, contribute to the demand for kaolin obtained from the water-washed process across various industries.
By Regional Analysis
Region-wise, the market is analyzed across North America, Europe, Asia Pacific, and LAMEA. In 2022, the Asia Pacific region witnessed the maximum revenue share in the market. The region is rich in kaolin deposits, with countries like China, India, Australia, and Vietnam having substantial kaolin reserves. This abundant raw material fosters local production and supply, reducing import dependence. Furthermore, the combination of abundant resources, industrial growth, diverse applications across industries, and the region's emphasis on sustainable materials collectively position Asia Pacific as a prominent region for the market.
List of Key Companies Profiled
- BASF SE
- Imerys S.A. (Belgian Securities B.V.)
- Active Minerals International, LLC
- Lasselsberger Group GmbH
- Thiele Kaolin Company
- SCR-Sibelco NV
- Quazwerke GmbH
- 20 microns limited
- W. R. Grace & Co.
- Sedlecky kaolin a.s.
Global Kaolin Market Report Segmentation
By Application (Volume, Kilo Tonnes, USD Billion, 2019-2030)
- Paper
- Ceramics
- Fiber Glass
- Rubber
- Pharmaceuticals & Medical
- Paints & Coatings
- Cosmetics
- Plastics
- Others
By Process (Volume, Kilo Tonnes, USD Billion, 2019-2030)
- Water-washed
- Airfloat
- Calcined
- Delaminated
- Surface-modified & Unprocessed
By Geography (Volume, Kilo Tonnes, USD Billion, 2019-2030)
- North America
- US
- Canada
- Mexico
- Rest of North America
- Europe
- Germany
- UK
- France
- Russia
- Spain
- Italy
- Rest of Europe
- Asia Pacific
- China
- Japan
- India
- South Korea
- Singapore
- Malaysia
- Rest of Asia Pacific
- LAMEA
- Brazil
- Argentina
- UAE
- Saudi Arabia
- South Africa
- Nigeria
- Rest of LAMEA
Table of Contents
Chapter 1. Market Scope & Methodology
- 1.1 Market Definition
- 1.2 Objectives
- 1.3 Market Scope
- 1.4 Segmentation
- 1.4.1 Global Kaolin Market, by Application
- 1.4.2 Global Kaolin Market, by Process
- 1.4.3 Global Kaolin Market, by Geography
- 1.5 Methodology for the research
Chapter 2. Market at a Glance
- 2.1 Key Highlights
Chapter 3. Market Overview
- 3.1 Introduction
- 3.1.1 Overview
- 3.1.1.1 Market Composition and Scenario
- 3.1.1 Overview
- 3.2 Key Factors Impacting the Market
- 3.2.1 Market Drivers
- 3.2.2 Market Opportunities
- 3.2.3 Market Restraints
- 3.2.4 Market Challenges
- 3.3 Porter Five Forces Analysis
Chapter 4. Global Kaolin Market by Application
- 4.1 Global Paper Market by Region
- 4.2 Global Ceramics Market by Region
- 4.3 Global Fiber Glass Market by Region
- 4.4 Global Rubber Market by Region
- 4.5 Global Pharmaceuticals & Medical Market by Region
- 4.6 Global Paints & Coatings Market by Region
- 4.7 Global Cosmetics Market by Region
- 4.8 Global Plastics Market by Region
- 4.9 Global Others Market by Region
Chapter 5. Global Kaolin Market by Process
- 5.1 Global Water-washed Market by Region
- 5.2 Global Airfloat Market by Region
- 5.3 Global Calcined Market by Region
- 5.4 Global Delaminated Market by Region
- 5.5 Global Surface-modified & Unprocessed Market by Region
Chapter 6. Global Kaolin Market by Region
- 6.1 North America Kaolin Market
- 6.1.1 North America Kaolin Market by Application
- 6.1.1.1 North America Paper Market by Country
- 6.1.1.2 North America Ceramics Market by Country
- 6.1.1.3 North America Fiber Glass Market by Country
- 6.1.1.4 North America Rubber Market by Country
- 6.1.1.5 North America Pharmaceuticals & Medical Market by Country
- 6.1.1.6 North America Paints & Coatings Market by Country
- 6.1.1.7 North America Cosmetics Market by Country
- 6.1.1.8 North America Plastics Market by Country
- 6.1.1.9 North America Others Market by Country
- 6.1.2 North America Kaolin Market by Process
- 6.1.2.1 North America Water-washed Market by Country
- 6.1.2.2 North America Airfloat Market by Country
- 6.1.2.3 North America Calcined Market by Country
- 6.1.2.4 North America Delaminated Market by Country
- 6.1.2.5 North America Surface-modified & Unprocessed Market by Country
- 6.1.3 North America Kaolin Market by Country
- 6.1.3.1 US Kaolin Market
- 6.1.3.1.1 US Kaolin Market by Application
- 6.1.3.1.2 US Kaolin Market by Process
- 6.1.3.2 Canada Kaolin Market
- 6.1.3.2.1 Canada Kaolin Market by Application
- 6.1.3.2.2 Canada Kaolin Market by Process
- 6.1.3.3 Mexico Kaolin Market
- 6.1.3.3.1 Mexico Kaolin Market by Application
- 6.1.3.3.2 Mexico Kaolin Market by Process
- 6.1.3.4 Rest of North America Kaolin Market
- 6.1.3.4.1 Rest of North America Kaolin Market by Application
- 6.1.3.4.2 Rest of North America Kaolin Market by Process
- 6.1.3.1 US Kaolin Market
- 6.1.1 North America Kaolin Market by Application
- 6.2 Europe Kaolin Market
- 6.2.1 Europe Kaolin Market by Application
- 6.2.1.1 Europe Paper Market by Country
- 6.2.1.2 Europe Ceramics Market by Country
- 6.2.1.3 Europe Fiber Glass Market by Country
- 6.2.1.4 Europe Rubber Market by Country
- 6.2.1.5 Europe Pharmaceuticals & Medical Market by Country
- 6.2.1.6 Europe Paints & Coatings Market by Country
- 6.2.1.7 Europe Cosmetics Market by Country
- 6.2.1.8 Europe Plastics Market by Country
- 6.2.1.9 Europe Others Market by Country
- 6.2.2 Europe Kaolin Market by Process
- 6.2.2.1 Europe Water-washed Market by Country
- 6.2.2.2 Europe Airfloat Market by Country
- 6.2.2.3 Europe Calcined Market by Country
- 6.2.2.4 Europe Delaminated Market by Country
- 6.2.2.5 Europe Surface-modified & Unprocessed Market by Country
- 6.2.3 Europe Kaolin Market by Country
- 6.2.3.1 Germany Kaolin Market
- 6.2.3.1.1 Germany Kaolin Market by Application
- 6.2.3.1.2 Germany Kaolin Market by Process
- 6.2.3.2 UK Kaolin Market
- 6.2.3.2.1 UK Kaolin Market by Application
- 6.2.3.2.2 UK Kaolin Market by Process
- 6.2.3.3 France Kaolin Market
- 6.2.3.3.1 France Kaolin Market by Application
- 6.2.3.3.2 France Kaolin Market by Process
- 6.2.3.4 Russia Kaolin Market
- 6.2.3.4.1 Russia Kaolin Market by Application
- 6.2.3.4.2 Russia Kaolin Market by Process
- 6.2.3.5 Spain Kaolin Market
- 6.2.3.5.1 Spain Kaolin Market by Application
- 6.2.3.5.2 Spain Kaolin Market by Process
- 6.2.3.6 Italy Kaolin Market
- 6.2.3.6.1 Italy Kaolin Market by Application
- 6.2.3.6.2 Italy Kaolin Market by Process
- 6.2.3.7 Rest of Europe Kaolin Market
- 6.2.3.7.1 Rest of Europe Kaolin Market by Application
- 6.2.3.7.2 Rest of Europe Kaolin Market by Process
- 6.2.3.1 Germany Kaolin Market
- 6.2.1 Europe Kaolin Market by Application
- 6.3 Asia Pacific Kaolin Market
- 6.3.1 Asia Pacific Kaolin Market by Application
- 6.3.1.1 Asia Pacific Paper Market by Country
- 6.3.1.2 Asia Pacific Ceramics Market by Country
- 6.3.1.3 Asia Pacific Fiber Glass Market by Country
- 6.3.1.4 Asia Pacific Rubber Market by Country
- 6.3.1.5 Asia Pacific Pharmaceuticals & Medical Market by Country
- 6.3.1.6 Asia Pacific Paints & Coatings Market by Country
- 6.3.1.7 Asia Pacific Cosmetics Market by Country
- 6.3.1.8 Asia Pacific Plastics Market by Country
- 6.3.1.9 Asia Pacific Others Market by Country
- 6.3.2 Asia Pacific Kaolin Market by Process
- 6.3.2.1 Asia Pacific Water-washed Market by Country
- 6.3.2.2 Asia Pacific Airfloat Market by Country
- 6.3.2.3 Asia Pacific Calcined Market by Country
- 6.3.2.4 Asia Pacific Delaminated Market by Country
- 6.3.2.5 Asia Pacific Surface-modified & Unprocessed Market by Country
- 6.3.3 Asia Pacific Kaolin Market by Country
- 6.3.3.1 China Kaolin Market
- 6.3.3.1.1 China Kaolin Market by Application
- 6.3.3.1.2 China Kaolin Market by Process
- 6.3.3.2 Japan Kaolin Market
- 6.3.3.2.1 Japan Kaolin Market by Application
- 6.3.3.2.2 Japan Kaolin Market by Process
- 6.3.3.3 India Kaolin Market
- 6.3.3.3.1 India Kaolin Market by Application
- 6.3.3.3.2 India Kaolin Market by Process
- 6.3.3.4 South Korea Kaolin Market
- 6.3.3.4.1 South Korea Kaolin Market by Application
- 6.3.3.4.2 South Korea Kaolin Market by Process
- 6.3.3.5 Singapore Kaolin Market
- 6.3.3.5.1 Singapore Kaolin Market by Application
- 6.3.3.5.2 Singapore Kaolin Market by Process
- 6.3.3.6 Malaysia Kaolin Market
- 6.3.3.6.1 Malaysia Kaolin Market by Application
- 6.3.3.6.2 Malaysia Kaolin Market by Process
- 6.3.3.7 Rest of Asia Pacific Kaolin Market
- 6.3.3.7.1 Rest of Asia Pacific Kaolin Market by Application
- 6.3.3.7.2 Rest of Asia Pacific Kaolin Market by Process
- 6.3.3.1 China Kaolin Market
- 6.3.1 Asia Pacific Kaolin Market by Application
- 6.4 LAMEA Kaolin Market
- 6.4.1 LAMEA Kaolin Market by Application
- 6.4.1.1 LAMEA Paper Market by Country
- 6.4.1.2 LAMEA Ceramics Market by Country
- 6.4.1.3 LAMEA Fiber Glass Market by Country
- 6.4.1.4 LAMEA Rubber Market by Country
- 6.4.1.5 LAMEA Pharmaceuticals & Medical Market by Country
- 6.4.1.6 LAMEA Paints & Coatings Market by Country
- 6.4.1.7 LAMEA Cosmetics Market by Country
- 6.4.1.8 LAMEA Plastics Market by Country
- 6.4.1.9 LAMEA Others Market by Country
- 6.4.2 LAMEA Kaolin Market by Process
- 6.4.2.1 LAMEA Water-washed Market by Country
- 6.4.2.2 LAMEA Airfloat Market by Country
- 6.4.2.3 LAMEA Calcined Market by Country
- 6.4.2.4 LAMEA Delaminated Market by Country
- 6.4.2.5 LAMEA Surface-modified & Unprocessed Market by Country
- 6.4.3 LAMEA Kaolin Market by Country
- 6.4.3.1 Brazil Kaolin Market
- 6.4.3.1.1 Brazil Kaolin Market by Application
- 6.4.3.1.2 Brazil Kaolin Market by Process
- 6.4.3.2 Argentina Kaolin Market
- 6.4.3.2.1 Argentina Kaolin Market by Application
- 6.4.3.2.2 Argentina Kaolin Market by Process
- 6.4.3.3 UAE Kaolin Market
- 6.4.3.3.1 UAE Kaolin Market by Application
- 6.4.3.3.2 UAE Kaolin Market by Process
- 6.4.3.4 Saudi Arabia Kaolin Market
- 6.4.3.4.1 Saudi Arabia Kaolin Market by Application
- 6.4.3.4.2 Saudi Arabia Kaolin Market by Process
- 6.4.3.5 South Africa Kaolin Market
- 6.4.3.5.1 South Africa Kaolin Market by Application
- 6.4.3.5.2 South Africa Kaolin Market by Process
- 6.4.3.6 Nigeria Kaolin Market
- 6.4.3.6.1 Nigeria Kaolin Market by Application
- 6.4.3.6.2 Nigeria Kaolin Market by Process
- 6.4.3.7 Rest of LAMEA Kaolin Market
- 6.4.3.7.1 Rest of LAMEA Kaolin Market by Application
- 6.4.3.7.2 Rest of LAMEA Kaolin Market by Process
- 6.4.3.1 Brazil Kaolin Market
- 6.4.1 LAMEA Kaolin Market by Application
Chapter 7. Company Profiles
- 7.1 BASF SE
- 7.1.1 Company Overview
- 7.1.2 Financial Analysis
- 7.1.3 Segmental and Regional Analysis
- 7.1.4 Research & Development Expense
- 7.1.5 SWOT Analysis
- 7.2 Imerys S.A. (Belgian Securities B.V.)
- 7.2.1 Company Overview
- 7.2.2 Financial Analysis
- 7.2.3 Segmental and Regional Analysis
- 7.2.4 SWOT Analysis
- 7.3 Active Minerals International, LLC
- 7.3.1 Company Overview
- 7.4 Lasselsberger Group GmbH
- 7.4.1 Company Overview
- 7.5 Thiele Kaolin Company
- 7.5.1 Company Overview
- 7.6 SCR-Sibelco NV
- 7.6.1 Company Overview
- 7.6.2 Financial Analysis
- 7.7 Quazwerke GmbH
- 7.7.1 Company Overview
- 7.8 20 Microns limited
- 7.8.1 Company Overview
- 7.8.2 Financial Analysis
- 7.8.3 Regional Analysis
- 7.9 W. R. Grace & Co.
- 7.9.1 Company Overview
- 7.10. Sedlecky kaolin a.s.
- 7.10.1 Company Overview