|
|
市場調査レポート
商品コード
1397738
硫酸カリウムの世界市場規模、シェア、産業動向分析レポート:形態別、純度別、エンドユーザー別、地域別の展望と予測、2023年~2030年Global Potassium Sulfate Market Size, Share & Industry Trends Analysis Report By Form (Solid, and Liquid), By Purity, By End User (Agriculture, Industrial, Pharmaceuticals, Food & Beverages, and Others), By Regional Outlook and Forecast, 2023 - 2030 |
||||||
|
|||||||
|
|||||||

| 硫酸カリウムの世界市場規模、シェア、産業動向分析レポート:形態別、純度別、エンドユーザー別、地域別の展望と予測、2023年~2030年 |
|
出版日: 2023年12月15日
発行: KBV Research
ページ情報: 英文 319 Pages
納期: 即納可能
|

全表示
- 概要
- 図表
- 目次
硫酸カリウム市場規模は、予測期間中にCAGR 4.5%で成長し、2030年までに60億米ドルに達すると予測されます。2022年の市場規模は6,758.0キロトンで成長率は3.2%となっています(2019-2022年)。
この化学薬品はカリ鉱物から抽出されることが多く、その抽出プロセスには多大な労力とエネルギー消費が伴います。地下採掘や溶液採掘のような伝統的な採掘方法は、化学製品製造のための原料を入手するための全体的なコストの一因となりうる。カリ鉱物の入手と抽出のコストは、化学製品の最終コストに大きく影響します。さらに、化学物質生産の一次情報源であるカリ埋蔵量の利用可能性は限られています。この制限により、埋蔵量へのアクセス競争が激化し、採掘コストが上昇する可能性があります。これらの要因により、将来的には化学薬品に対する需要が減少する可能性があります。
形態の展望
市場は形態によって固体と液体に二分されます。2022年には、液体セグメントが市場で大きな収益シェアを獲得しました。液体化学製剤を含む液体肥料は、施用が容易であることから好まれることが多いです。灌漑システムと簡単に混合できるため、農家にとって施肥がより便利になります。液体肥料は、特に現代の精密農業において、正確で均一な散布を可能にします。液体肥料は、植物の葉に直接散布する葉面散布に適しています。こうした点がこの分野の需要を押し上げると思われます。
純度の展望
純度によって、市場は99%までと99%以上に分けられます。2022年には、99%超のセグメントが市場で大きな収益シェアを占めています。農業はますます精密志向になっており、農家は作物への正確な栄養供給を確保するために高純度の肥料を求めています。純度99%以上の肥料は、濃縮された信頼性の高いカリウム源を提供し、不純物を混入させることなく作物の特定のニーズに対応します。そのため、この分野は今後数年間で急速に拡大すると思われます。
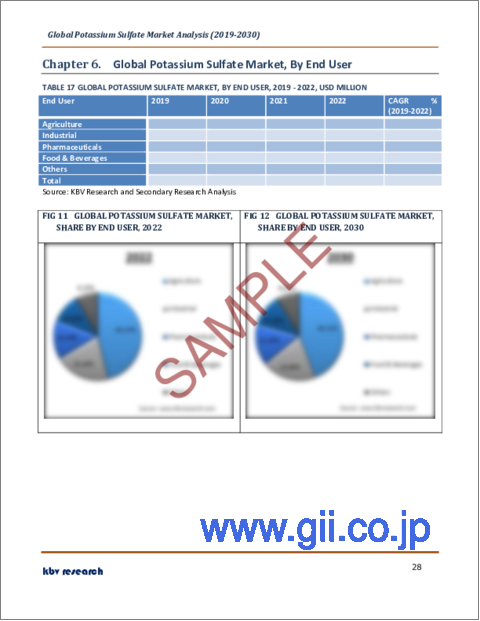
エンドユーザーの展望
市場はエンドユーザー別に、農業、工業、飲食品、その他に区分されます。2022年には、産業部門が市場で大きな収益シェアを占めました。工業分野では、この化学薬品は特定の医薬製剤に利用されています。医薬品や製薬プロセスへの配合が需要に寄与しています。この化学物質は、化学産業において貴重な化合物であり、様々な化学物質を製造するための原料として機能します。さらに、この化学物質は食品添加物として食品産業での使用も認められています。特定の食品において、ゲル化剤、固化剤、安定剤として使用されることがあります。そのため、この分野は今後数年間で急速に成長すると思われます。
地域別展望
地域別に見ると、市場は北米、欧州、アジア太平洋、LAMEAに区分されます。アジア太平洋セグメントは、2022年の市場で最も高い収益シェアを獲得しました。多様な気候と大規模な農業部門を有するアジア太平洋地域では、農業の拡大と集約化が進んでいます。農家が収量を最適化し、作物の品質を向上させようとしているため、硫酸カリウムを含む肥料の需要は増加すると思われます。この化学肥料は、色や風味に影響を与えるため好まれ、果物や野菜のような高価値商品の場合には特に重要です。こうした要因から、この分野での需要は増加すると思われます。
目次
第1章 市場範囲と調査手法
- 市場の定義
- 目的
- 市場範囲
- セグメンテーション
- 調査手法
第2章 市場要覧
- 主なハイライト
第3章 市場概要
- イントロダクション
- 概要
- 市場構成とシナリオ
- 概要
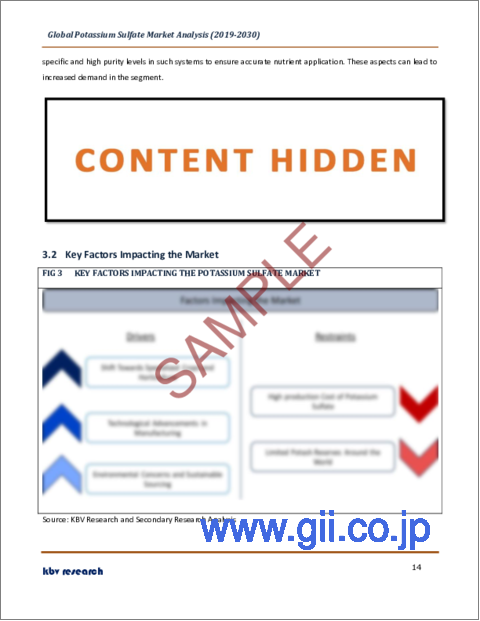
- 市場に影響を与える主な要因
- 市場促進要因
- 市場抑制要因
- ポーターファイブフォース分析
第4章 世界の硫酸カリウム市場:形態別
- 世界の固体市場:地域別
- 世界の液体市場:地域別
第5章 世界の硫酸カリウム市場:純度別
- 世界の99%未満市場:地域別
- 世界の99%超市場:地域別
第6章 世界の硫酸カリウム市場:エンドユーザー別
- 世界の農業市場:地域別
- 世界の産業市場:地域別
- 世界の医薬品市場:地域別
- 世界の食品および飲料市場:地域別
- 世界のその他の市場:地域別
第7章 世界の硫酸カリウム市場:地域別
- 北米
- 欧州
- アジア太平洋
- ラテンアメリカ・中東・アフリカ
第8章 企業プロファイル
- Sesoda Corporation
- Sociedad Quimica Y Minera De Chile SA
- Halogen
- Yara International ASA
- The Mosaic Company
- Compass Minerals International, Inc
- K+S Aktiengesellschaft
- Intrepid Potash Inc
- Tessenderlo Group nv
第9章 市場の成功必須条件
LIST OF TABLES
- TABLE 1 Global Potassium Sulfate Market, 2019 - 2022, USD Million
- TABLE 2 Global Potassium Sulfate Market, 2023 - 2030, USD Million
- TABLE 3 Global Potassium Sulfate Market, 2019 - 2022, Kilo Tonnes
- TABLE 4 Global Potassium Sulfate Market, 2023 - 2030, Kilo Tonnes
- TABLE 5 Global Potassium Sulfate Market, By Form, 2019 - 2022, USD Million
- TABLE 6 Global Potassium Sulfate Market, By Form, 2023 - 2030, USD Million
- TABLE 7 Global Potassium Sulfate Market, By Form, 2019 - 2022, Kilo Tonnes
- TABLE 8 Global Potassium Sulfate Market, By Form, 2023 - 2030, Kilo Tonnes
- TABLE 9 Global Solid Market, By Region, 2019 - 2022, USD Million
- TABLE 10 Global Solid Market, By Region, 2023 - 2030, USD Million
- TABLE 11 Global Solid Market, By Region, 2019 - 2022, Kilo Tonnes
- TABLE 12 Global Solid Market, By Region, 2023 - 2030, Kilo Tonnes
- TABLE 13 Global Liquid Market, By Region, 2019 - 2022, USD Million
- TABLE 14 Global Liquid Market, By Region, 2023 - 2030, USD Million
- TABLE 15 Global Liquid Market, By Region, 2019 - 2022, Kilo Tonnes
- TABLE 16 Global Liquid Market, By Region, 2023 - 2030, Kilo Tonnes
- TABLE 17 Global Potassium Sulfate Market, By Purity, 2019 - 2022, USD Million
- TABLE 18 Global Potassium Sulfate Market, By Purity, 2023 - 2030, USD Million
- TABLE 19 Global Potassium Sulfate Market, By Purity, 2019 - 2022, Kilo Tonnes
- TABLE 20 Global Potassium Sulfate Market, By Purity, 2023 - 2030, Kilo Tonnes
- TABLE 21 Global Up to 99% Market, By Region, 2019 - 2022, USD Million
- TABLE 22 Global Up to 99% Market, By Region, 2023 - 2030, USD Million
- TABLE 23 Global Up to 99% Market, By Region, 2019 - 2022, Kilo Tonnes
- TABLE 24 Global Up to 99% Market, By Region, 2023 - 2030, Kilo Tonnes
- TABLE 25 Global Greater than 99% Market, By Region, 2019 - 2022, USD Million
- TABLE 26 Global Greater than 99% Market, By Region, 2023 - 2030, USD Million
- TABLE 27 Global Greater than 99% Market, By Region, 2019 - 2022, Kilo Tonnes
- TABLE 28 Global Greater than 99% Market, By Region, 2023 - 2030, Kilo Tonnes
- TABLE 29 Global Potassium Sulfate Market, By End User, 2019 - 2022, USD Million
- TABLE 30 Global Potassium Sulfate Market, By End User, 2023 - 2030, USD Million
- TABLE 31 Global Potassium Sulfate Market, By End User, 2019 - 2022, Kilo Tonnes
- TABLE 32 Global Potassium Sulfate Market, By End User, 2023 - 2030, Kilo Tonnes
- TABLE 33 Global Agriculture Market, By Region, 2019 - 2022, USD Million
- TABLE 34 Global Agriculture Market, By Region, 2023 - 2030, USD Million
- TABLE 35 Global Agriculture Market, By Region, 2019 - 2022, Kilo Tonnes
- TABLE 36 Global Agriculture Market, By Region, 2023 - 2030, Kilo Tonnes
- TABLE 37 Global Industrial Market, By Region, 2019 - 2022, USD Million
- TABLE 38 Global Industrial Market, By Region, 2023 - 2030, USD Million
- TABLE 39 Global Industrial Market, By Region, 2019 - 2022, Kilo Tonnes
- TABLE 40 Global Industrial Market, By Region, 2023 - 2030, Kilo Tonnes
- TABLE 41 Global Pharmaceuticals Market, By Region, 2019 - 2022, USD Million
- TABLE 42 Global Pharmaceuticals Market, By Region, 2023 - 2030, USD Million
- TABLE 43 Global Pharmaceuticals Market, By Region, 2019 - 2022, Kilo Tonnes
- TABLE 44 Global Pharmaceuticals Market, By Region, 2023 - 2030, Kilo Tonnes
- TABLE 45 Global Food & Beverages Market, By Region, 2019 - 2022, USD Million
- TABLE 46 Global Food & Beverages Market, By Region, 2023 - 2030, USD Million
- TABLE 47 Global Food & Beverages Market, By Region, 2019 - 2022, Kilo Tonnes
- TABLE 48 Global Food & Beverages Market, By Region, 2023 - 2030, Kilo Tonnes
- TABLE 49 Global Others Market, By Region, 2019 - 2022, USD Million
- TABLE 50 Global Others Market, By Region, 2023 - 2030, USD Million
- TABLE 51 Global Others Market, By Region, 2019 - 2022, Kilo Tonnes
- TABLE 52 Global Others Market, By Region, 2023 - 2030, Kilo Tonnes
- TABLE 53 Global Potassium Sulfate Market, By Region, 2019 - 2022, USD Million
- TABLE 54 Global Potassium Sulfate Market, By Region, 2023 - 2030, USD Million
- TABLE 55 Global Potassium Sulfate Market, By Region, 2019 - 2022, Kilo Tonnes
- TABLE 56 Global Potassium Sulfate Market, By Region, 2023 - 2030, Kilo Tonnes
- TABLE 57 North America Potassium Sulfate Market, 2019 - 2022, USD Million
- TABLE 58 North America Potassium Sulfate Market, 2023 - 2030, USD Million
- TABLE 59 North America Potassium Sulfate Market, 2019 - 2022, Kilo Tonnes
- TABLE 60 North America Potassium Sulfate Market, 2023 - 2030, Kilo Tonnes
- TABLE 61 North America Potassium Sulfate Market, By Form, 2019 - 2022, USD Million
- TABLE 62 North America Potassium Sulfate Market, By Form, 2023 - 2030, USD Million
- TABLE 63 North America Potassium Sulfate Market, By Form, 2019 - 2022, Kilo Tonnes
- TABLE 64 North America Potassium Sulfate Market, By Form, 2023 - 2030, Kilo Tonnes
- TABLE 65 North America Solid Market, By Country, 2019 - 2022, USD Million
- TABLE 66 North America Solid Market, By Country, 2023 - 2030, USD Million
- TABLE 67 North America Solid Market, By Country, 2019 - 2022, Kilo Tonnes
- TABLE 68 North America Solid Market, By Country, 2023 - 2030, Kilo Tonnes
- TABLE 69 North America Liquid Market, By Country, 2019 - 2022, USD Million
- TABLE 70 North America Liquid Market, By Country, 2023 - 2030, USD Million
- TABLE 71 North America Liquid Market, By Country, 2019 - 2022, Kilo Tonnes
- TABLE 72 North America Liquid Market, By Country, 2023 - 2030, Kilo Tonnes
- TABLE 73 North America Potassium Sulfate Market, By Purity, 2019 - 2022, USD Million
- TABLE 74 North America Potassium Sulfate Market, By Purity, 2023 - 2030, USD Million
- TABLE 75 North America Potassium Sulfate Market, By Purity, 2019 - 2022, Kilo Tonnes
- TABLE 76 North America Potassium Sulfate Market, By Purity, 2023 - 2030, Kilo Tonnes
- TABLE 77 North America Up to 99% Market, By Country, 2019 - 2022, USD Million
- TABLE 78 North America Up to 99% Market, By Country, 2023 - 2030, USD Million
- TABLE 79 North America Up to 99% Market, By Country, 2019 - 2022, Kilo Tonnes
- TABLE 80 North America Up to 99% Market, By Country, 2023 - 2030, Kilo Tonnes
- TABLE 81 North America Greater than 99% Market, By Country, 2019 - 2022, USD Million
- TABLE 82 North America Greater than 99% Market, By Country, 2023 - 2030, USD Million
- TABLE 83 North America Greater than 99% Market, By Country, 2019 - 2022, Kilo Tonnes
- TABLE 84 North America Greater than 99% Market, By Country, 2023 - 2030, Kilo Tonnes
- TABLE 85 North America Potassium Sulfate Market, By End User, 2019 - 2022, USD Million
- TABLE 86 North America Potassium Sulfate Market, By End User, 2023 - 2030, USD Million
- TABLE 87 North America Potassium Sulfate Market, By End User, 2019 - 2022, Kilo Tonnes
- TABLE 88 North America Potassium Sulfate Market, By End User, 2023 - 2030, Kilo Tonnes
- TABLE 89 North America Agriculture Market, By Country, 2019 - 2022, USD Million
- TABLE 90 North America Agriculture Market, By Country, 2023 - 2030, USD Million
- TABLE 91 North America Agriculture Market, By Country, 2019 - 2022, Kilo Tonnes
- TABLE 92 North America Agriculture Market, By Country, 2023 - 2030, Kilo Tonnes
- TABLE 93 North America Industrial Market, By Country, 2019 - 2022, USD Million
- TABLE 94 North America Industrial Market, By Country, 2023 - 2030, USD Million
- TABLE 95 North America Industrial Market, By Country, 2019 - 2022, Kilo Tonnes
- TABLE 96 North America Industrial Market, By Country, 2023 - 2030, Kilo Tonnes
- TABLE 97 North America Pharmaceuticals Market, By Country, 2019 - 2022, USD Million
- TABLE 98 North America Pharmaceuticals Market, By Country, 2023 - 2030, USD Million
- TABLE 99 North America Pharmaceuticals Market, By Country, 2019 - 2022, Kilo Tonnes
- TABLE 100 North America Pharmaceuticals Market, By Country, 2023 - 2030, Kilo Tonnes
- TABLE 101 North America Food & Beverages Market, By Country, 2019 - 2022, USD Million
- TABLE 102 North America Food & Beverages Market, By Country, 2023 - 2030, USD Million
- TABLE 103 North America Food & Beverages Market, By Country, 2019 - 2022, Kilo Tonnes
- TABLE 104 North America Food & Beverages Market, By Country, 2023 - 2030, Kilo Tonnes
- TABLE 105 North America Others Market, By Country, 2019 - 2022, USD Million
- TABLE 106 North America Others Market, By Country, 2023 - 2030, USD Million
- TABLE 107 North America Others Market, By Country, 2019 - 2022, Kilo Tonnes
- TABLE 108 North America Others Market, By Country, 2023 - 2030, Kilo Tonnes
- TABLE 109 North America Potassium Sulfate Market, By Country, 2019 - 2022, USD Million
- TABLE 110 North America Potassium Sulfate Market, By Country, 2023 - 2030, USD Million
- TABLE 111 North America Potassium Sulfate Market, By Country, 2019 - 2022, Kilo Tonnes
- TABLE 112 North America Potassium Sulfate Market, By Country, 2023 - 2030, Kilo Tonnes
- TABLE 113 US Potassium Sulfate Market, 2019 - 2022, USD Million
- TABLE 114 US Potassium Sulfate Market, 2023 - 2030, USD Million
- TABLE 115 US Potassium Sulfate Market, 2019 - 2022, Kilo Tonnes
- TABLE 116 US Potassium Sulfate Market, 2023 - 2030, Kilo Tonnes
- TABLE 117 US Potassium Sulfate Market, By Form, 2019 - 2022, USD Million
- TABLE 118 US Potassium Sulfate Market, By Form, 2023 - 2030, USD Million
- TABLE 119 US Potassium Sulfate Market, By Form, 2019 - 2022, Kilo Tonnes
- TABLE 120 US Potassium Sulfate Market, By Form, 2023 - 2030, Kilo Tonnes
- TABLE 121 US Potassium Sulfate Market, By Purity, 2019 - 2022, USD Million
- TABLE 122 US Potassium Sulfate Market, By Purity, 2023 - 2030, USD Million
- TABLE 123 US Potassium Sulfate Market, By Purity, 2019 - 2022, Kilo Tonnes
- TABLE 124 US Potassium Sulfate Market, By Purity, 2023 - 2030, Kilo Tonnes
- TABLE 125 US Potassium Sulfate Market, By End User, 2019 - 2022, USD Million
- TABLE 126 US Potassium Sulfate Market, By End User, 2023 - 2030, USD Million
- TABLE 127 US Potassium Sulfate Market, By End User, 2019 - 2022, Kilo Tonnes
- TABLE 128 US Potassium Sulfate Market, By End User, 2023 - 2030, Kilo Tonnes
- TABLE 129 Canada Potassium Sulfate Market, 2019 - 2022, USD Million
- TABLE 130 Canada Potassium Sulfate Market, 2023 - 2030, USD Million
- TABLE 131 Canada Potassium Sulfate Market, 2019 - 2022, Kilo Tonnes
- TABLE 132 Canada Potassium Sulfate Market, 2023 - 2030, Kilo Tonnes
- TABLE 133 Canada Potassium Sulfate Market, By Form, 2019 - 2022, USD Million
- TABLE 134 Canada Potassium Sulfate Market, By Form, 2023 - 2030, USD Million
- TABLE 135 Canada Potassium Sulfate Market, By Form, 2019 - 2022, Kilo Tonnes
- TABLE 136 Canada Potassium Sulfate Market, By Form, 2023 - 2030, Kilo Tonnes
- TABLE 137 Canada Potassium Sulfate Market, By Purity, 2019 - 2022, USD Million
- TABLE 138 Canada Potassium Sulfate Market, By Purity, 2023 - 2030, USD Million
- TABLE 139 Canada Potassium Sulfate Market, By Purity, 2019 - 2022, Kilo Tonnes
- TABLE 140 Canada Potassium Sulfate Market, By Purity, 2023 - 2030, Kilo Tonnes
- TABLE 141 Canada Potassium Sulfate Market, By End User, 2019 - 2022, USD Million
- TABLE 142 Canada Potassium Sulfate Market, By End User, 2023 - 2030, USD Million
- TABLE 143 Canada Potassium Sulfate Market, By End User, 2019 - 2022, Kilo Tonnes
- TABLE 144 Canada Potassium Sulfate Market, By End User, 2023 - 2030, Kilo Tonnes
- TABLE 145 Mexico Potassium Sulfate Market, 2019 - 2022, USD Million
- TABLE 146 Mexico Potassium Sulfate Market, 2023 - 2030, USD Million
- TABLE 147 Mexico Potassium Sulfate Market, 2019 - 2022, Kilo Tonnes
- TABLE 148 Mexico Potassium Sulfate Market, 2023 - 2030, Kilo Tonnes
- TABLE 149 Mexico Potassium Sulfate Market, By Form, 2019 - 2022, USD Million
- TABLE 150 Mexico Potassium Sulfate Market, By Form, 2023 - 2030, USD Million
- TABLE 151 Mexico Potassium Sulfate Market, By Form, 2019 - 2022, Kilo Tonnes
- TABLE 152 Mexico Potassium Sulfate Market, By Form, 2023 - 2030, Kilo Tonnes
- TABLE 153 Mexico Potassium Sulfate Market, By Purity, 2019 - 2022, USD Million
- TABLE 154 Mexico Potassium Sulfate Market, By Purity, 2023 - 2030, USD Million
- TABLE 155 Mexico Potassium Sulfate Market, By Purity, 2019 - 2022, Kilo Tonnes
- TABLE 156 Mexico Potassium Sulfate Market, By Purity, 2023 - 2030, Kilo Tonnes
- TABLE 157 Mexico Potassium Sulfate Market, By End User, 2019 - 2022, USD Million
- TABLE 158 Mexico Potassium Sulfate Market, By End User, 2023 - 2030, USD Million
- TABLE 159 Mexico Potassium Sulfate Market, By End User, 2019 - 2022, Kilo Tonnes
- TABLE 160 Mexico Potassium Sulfate Market, By End User, 2023 - 2030, Kilo Tonnes
- TABLE 161 Rest of North America Potassium Sulfate Market, 2019 - 2022, USD Million
- TABLE 162 Rest of North America Potassium Sulfate Market, 2023 - 2030, USD Million
- TABLE 163 Rest of North America Potassium Sulfate Market, 2019 - 2022, Kilo Tonnes
- TABLE 164 Rest of North America Potassium Sulfate Market, 2023 - 2030, Kilo Tonnes
- TABLE 165 Rest of North America Potassium Sulfate Market, By Form, 2019 - 2022, USD Million
- TABLE 166 Rest of North America Potassium Sulfate Market, By Form, 2023 - 2030, USD Million
- TABLE 167 Rest of North America Potassium Sulfate Market, By Form, 2019 - 2022, Kilo Tonnes
- TABLE 168 Rest of North America Potassium Sulfate Market, By Form, 2023 - 2030, Kilo Tonnes
- TABLE 169 Rest of North America Potassium Sulfate Market, By Purity, 2019 - 2022, USD Million
- TABLE 170 Rest of North America Potassium Sulfate Market, By Purity, 2023 - 2030, USD Million
- TABLE 171 Rest of North America Potassium Sulfate Market, By Purity, 2019 - 2022, Kilo Tonnes
- TABLE 172 Rest of North America Potassium Sulfate Market, By Purity, 2023 - 2030, Kilo Tonnes
- TABLE 173 Rest of North America Potassium Sulfate Market, By End User, 2019 - 2022, USD Million
- TABLE 174 Rest of North America Potassium Sulfate Market, By End User, 2023 - 2030, USD Million
- TABLE 175 Rest of North America Potassium Sulfate Market, By End User, 2019 - 2022, Kilo Tonnes
- TABLE 176 Rest of North America Potassium Sulfate Market, By End User, 2023 - 2030, Kilo Tonnes
- TABLE 177 Europe Potassium Sulfate Market, 2019 - 2022, USD Million
- TABLE 178 Europe Potassium Sulfate Market, 2023 - 2030, USD Million
- TABLE 179 Europe Potassium Sulfate Market, 2019 - 2022, Kilo Tonnes
- TABLE 180 Europe Potassium Sulfate Market, 2023 - 2030, Kilo Tonnes
- TABLE 181 Europe Potassium Sulfate Market, By Form, 2019 - 2022, USD Million
- TABLE 182 Europe Potassium Sulfate Market, By Form, 2023 - 2030, USD Million
- TABLE 183 Europe Potassium Sulfate Market, By Form, 2019 - 2022, Kilo Tonnes
- TABLE 184 Europe Potassium Sulfate Market, By Form, 2023 - 2030, Kilo Tonnes
- TABLE 185 Europe Solid Market, By Country, 2019 - 2022, USD Million
- TABLE 186 Europe Solid Market, By Country, 2023 - 2030, USD Million
- TABLE 187 Europe Solid Market, By Country, 2019 - 2022, Kilo Tonnes
- TABLE 188 Europe Solid Market, By Country, 2023 - 2030, Kilo Tonnes
- TABLE 189 Europe Liquid Market, By Country, 2019 - 2022, USD Million
- TABLE 190 Europe Liquid Market, By Country, 2023 - 2030, USD Million
- TABLE 191 Europe Liquid Market, By Country, 2019 - 2022, Kilo Tonnes
- TABLE 192 Europe Liquid Market, By Country, 2023 - 2030, Kilo Tonnes
- TABLE 193 Europe Potassium Sulfate Market, By Purity, 2019 - 2022, USD Million
- TABLE 194 Europe Potassium Sulfate Market, By Purity, 2023 - 2030, USD Million
- TABLE 195 Europe Potassium Sulfate Market, By Purity, 2019 - 2022, Kilo Tonnes
- TABLE 196 Europe Potassium Sulfate Market, By Purity, 2023 - 2030, Kilo Tonnes
- TABLE 197 Europe Up to 99% Market, By Country, 2019 - 2022, USD Million
- TABLE 198 Europe Up to 99% Market, By Country, 2023 - 2030, USD Million
- TABLE 199 Europe Up to 99% Market, By Country, 2019 - 2022, Kilo Tonnes
- TABLE 200 Europe Up to 99% Market, By Country, 2023 - 2030, Kilo Tonnes
- TABLE 201 Europe Greater than 99% Market, By Country, 2019 - 2022, USD Million
- TABLE 202 Europe Greater than 99% Market, By Country, 2023 - 2030, USD Million
- TABLE 203 Europe Greater than 99% Market, By Country, 2019 - 2022, Kilo Tonnes
- TABLE 204 Europe Greater than 99% Market, By Country, 2023 - 2030, Kilo Tonnes
- TABLE 205 Europe Potassium Sulfate Market, By End User, 2019 - 2022, USD Million
- TABLE 206 Europe Potassium Sulfate Market, By End User, 2023 - 2030, USD Million
- TABLE 207 Europe Potassium Sulfate Market, By End User, 2019 - 2022, Kilo Tonnes
- TABLE 208 Europe Potassium Sulfate Market, By End User, 2023 - 2030, Kilo Tonnes
- TABLE 209 Europe Agriculture Market, By Country, 2019 - 2022, USD Million
- TABLE 210 Europe Agriculture Market, By Country, 2023 - 2030, USD Million
- TABLE 211 Europe Agriculture Market, By Country, 2019 - 2022, Kilo Tonnes
- TABLE 212 Europe Agriculture Market, By Country, 2023 - 2030, Kilo Tonnes
- TABLE 213 Europe Industrial Market, By Country, 2019 - 2022, USD Million
- TABLE 214 Europe Industrial Market, By Country, 2023 - 2030, USD Million
- TABLE 215 Europe Industrial Market, By Country, 2019 - 2022, Kilo Tonnes
- TABLE 216 Europe Industrial Market, By Country, 2023 - 2030, Kilo Tonnes
- TABLE 217 Europe Pharmaceuticals Market, By Country, 2019 - 2022, USD Million
- TABLE 218 Europe Pharmaceuticals Market, By Country, 2023 - 2030, USD Million
- TABLE 219 Europe Pharmaceuticals Market, By Country, 2019 - 2022, Kilo Tonnes
- TABLE 220 Europe Pharmaceuticals Market, By Country, 2023 - 2030, Kilo Tonnes
- TABLE 221 Europe Food & Beverages Market, By Country, 2019 - 2022, USD Million
- TABLE 222 Europe Food & Beverages Market, By Country, 2023 - 2030, USD Million
- TABLE 223 Europe Food & Beverages Market, By Country, 2019 - 2022, Kilo Tonnes
- TABLE 224 Europe Food & Beverages Market, By Country, 2023 - 2030, Kilo Tonnes
- TABLE 225 Europe Others Market, By Country, 2019 - 2022, USD Million
- TABLE 226 Europe Others Market, By Country, 2023 - 2030, USD Million
- TABLE 227 Europe Others Market, By Country, 2019 - 2022, Kilo Tonnes
- TABLE 228 Europe Others Market, By Country, 2023 - 2030, Kilo Tonnes
- TABLE 229 Europe Potassium Sulfate Market, By Country, 2019 - 2022, USD Million
- TABLE 230 Europe Potassium Sulfate Market, By Country, 2023 - 2030, USD Million
- TABLE 231 Europe Potassium Sulfate Market, By Country, 2019 - 2022, Kilo Tonnes
- TABLE 232 Europe Potassium Sulfate Market, By Country, 2023 - 2030, Kilo Tonnes
- TABLE 233 Russia Potassium Sulfate Market, 2019 - 2022, USD Million
- TABLE 234 Russia Potassium Sulfate Market, 2023 - 2030, USD Million
- TABLE 235 Russia Potassium Sulfate Market, 2019 - 2022, Kilo Tonnes
- TABLE 236 Russia Potassium Sulfate Market, 2023 - 2030, Kilo Tonnes
- TABLE 237 Russia Potassium Sulfate Market, By Form, 2019 - 2022, USD Million
- TABLE 238 Russia Potassium Sulfate Market, By Form, 2023 - 2030, USD Million
- TABLE 239 Russia Potassium Sulfate Market, By Form, 2019 - 2022, Kilo Tonnes
- TABLE 240 Russia Potassium Sulfate Market, By Form, 2023 - 2030, Kilo Tonnes
- TABLE 241 Russia Potassium Sulfate Market, By Purity, 2019 - 2022, USD Million
- TABLE 242 Russia Potassium Sulfate Market, By Purity, 2023 - 2030, USD Million
- TABLE 243 Russia Potassium Sulfate Market, By Purity, 2019 - 2022, Kilo Tonnes
- TABLE 244 Russia Potassium Sulfate Market, By Purity, 2023 - 2030, Kilo Tonnes
- TABLE 245 Russia Potassium Sulfate Market, By End User, 2019 - 2022, USD Million
- TABLE 246 Russia Potassium Sulfate Market, By End User, 2023 - 2030, USD Million
- TABLE 247 Russia Potassium Sulfate Market, By End User, 2019 - 2022, Kilo Tonnes
- TABLE 248 Russia Potassium Sulfate Market, By End User, 2023 - 2030, Kilo Tonnes
- TABLE 249 France Potassium Sulfate Market, 2019 - 2022, USD Million
- TABLE 250 France Potassium Sulfate Market, 2023 - 2030, USD Million
- TABLE 251 France Potassium Sulfate Market, 2019 - 2022, Kilo Tonnes
- TABLE 252 France Potassium Sulfate Market, 2023 - 2030, Kilo Tonnes
- TABLE 253 France Potassium Sulfate Market, By Form, 2019 - 2022, USD Million
- TABLE 254 France Potassium Sulfate Market, By Form, 2023 - 2030, USD Million
- TABLE 255 France Potassium Sulfate Market, By Form, 2019 - 2022, Kilo Tonnes
- TABLE 256 France Potassium Sulfate Market, By Form, 2023 - 2030, Kilo Tonnes
- TABLE 257 France Potassium Sulfate Market, By Purity, 2019 - 2022, USD Million
- TABLE 258 France Potassium Sulfate Market, By Purity, 2023 - 2030, USD Million
- TABLE 259 France Potassium Sulfate Market, By Purity, 2019 - 2022, Kilo Tonnes
- TABLE 260 France Potassium Sulfate Market, By Purity, 2023 - 2030, Kilo Tonnes
- TABLE 261 France Potassium Sulfate Market, By End User, 2019 - 2022, USD Million
- TABLE 262 France Potassium Sulfate Market, By End User, 2023 - 2030, USD Million
- TABLE 263 France Potassium Sulfate Market, By End User, 2019 - 2022, Kilo Tonnes
- TABLE 264 France Potassium Sulfate Market, By End User, 2023 - 2030, Kilo Tonnes
- TABLE 265 Germany Potassium Sulfate Market, 2019 - 2022, USD Million
- TABLE 266 Germany Potassium Sulfate Market, 2023 - 2030, USD Million
- TABLE 267 Germany Potassium Sulfate Market, 2019 - 2022, Kilo Tonnes
- TABLE 268 Germany Potassium Sulfate Market, 2023 - 2030, Kilo Tonnes
- TABLE 269 Germany Potassium Sulfate Market, By Form, 2019 - 2022, USD Million
- TABLE 270 Germany Potassium Sulfate Market, By Form, 2023 - 2030, USD Million
- TABLE 271 Germany Potassium Sulfate Market, By Form, 2019 - 2022, Kilo Tonnes
- TABLE 272 Germany Potassium Sulfate Market, By Form, 2023 - 2030, Kilo Tonnes
- TABLE 273 Germany Potassium Sulfate Market, By Purity, 2019 - 2022, USD Million
- TABLE 274 Germany Potassium Sulfate Market, By Purity, 2023 - 2030, USD Million
- TABLE 275 Germany Potassium Sulfate Market, By Purity, 2019 - 2022, Kilo Tonnes
- TABLE 276 Germany Potassium Sulfate Market, By Purity, 2023 - 2030, Kilo Tonnes
- TABLE 277 Germany Potassium Sulfate Market, By End User, 2019 - 2022, USD Million
- TABLE 278 Germany Potassium Sulfate Market, By End User, 2023 - 2030, USD Million
- TABLE 279 Germany Potassium Sulfate Market, By End User, 2019 - 2022, Kilo Tonnes
- TABLE 280 Germany Potassium Sulfate Market, By End User, 2023 - 2030, Kilo Tonnes
- TABLE 281 UK Potassium Sulfate Market, 2019 - 2022, USD Million
- TABLE 282 UK Potassium Sulfate Market, 2023 - 2030, USD Million
- TABLE 283 UK Potassium Sulfate Market, 2019 - 2022, Kilo Tonnes
- TABLE 284 UK Potassium Sulfate Market, 2023 - 2030, Kilo Tonnes
- TABLE 285 UK Potassium Sulfate Market, By Form, 2019 - 2022, USD Million
- TABLE 286 UK Potassium Sulfate Market, By Form, 2023 - 2030, USD Million
- TABLE 287 UK Potassium Sulfate Market, By Form, 2019 - 2022, Kilo Tonnes
- TABLE 288 UK Potassium Sulfate Market, By Form, 2023 - 2030, Kilo Tonnes
- TABLE 289 UK Potassium Sulfate Market, By Purity, 2019 - 2022, USD Million
- TABLE 290 UK Potassium Sulfate Market, By Purity, 2023 - 2030, USD Million
- TABLE 291 UK Potassium Sulfate Market, By Purity, 2019 - 2022, Kilo Tonnes
- TABLE 292 UK Potassium Sulfate Market, By Purity, 2023 - 2030, Kilo Tonnes
- TABLE 293 UK Potassium Sulfate Market, By End User, 2019 - 2022, USD Million
- TABLE 294 UK Potassium Sulfate Market, By End User, 2023 - 2030, USD Million
- TABLE 295 UK Potassium Sulfate Market, By End User, 2019 - 2022, Kilo Tonnes
- TABLE 296 UK Potassium Sulfate Market, By End User, 2023 - 2030, Kilo Tonnes
- TABLE 297 Spain Potassium Sulfate Market, 2019 - 2022, USD Million
- TABLE 298 Spain Potassium Sulfate Market, 2023 - 2030, USD Million
- TABLE 299 Spain Potassium Sulfate Market, 2019 - 2022, Kilo Tonnes
- TABLE 300 Spain Potassium Sulfate Market, 2023 - 2030, Kilo Tonnes
- TABLE 301 Spain Potassium Sulfate Market, By Form, 2019 - 2022, USD Million
- TABLE 302 Spain Potassium Sulfate Market, By Form, 2023 - 2030, USD Million
- TABLE 303 Spain Potassium Sulfate Market, By Form, 2019 - 2022, Kilo Tonnes
- TABLE 304 Spain Potassium Sulfate Market, By Form, 2023 - 2030, Kilo Tonnes
- TABLE 305 Spain Potassium Sulfate Market, By Purity, 2019 - 2022, USD Million
- TABLE 306 Spain Potassium Sulfate Market, By Purity, 2023 - 2030, USD Million
- TABLE 307 Spain Potassium Sulfate Market, By Purity, 2019 - 2022, Kilo Tonnes
- TABLE 308 Spain Potassium Sulfate Market, By Purity, 2023 - 2030, Kilo Tonnes
- TABLE 309 Spain Potassium Sulfate Market, By End User, 2019 - 2022, USD Million
- TABLE 310 Spain Potassium Sulfate Market, By End User, 2023 - 2030, USD Million
- TABLE 311 Spain Potassium Sulfate Market, By End User, 2019 - 2022, Kilo Tonnes
- TABLE 312 Spain Potassium Sulfate Market, By End User, 2023 - 2030, Kilo Tonnes
The Global Potassium Sulfate Market size is expected to reach $6 billion by 2030, rising at a market growth of 4.5% CAGR during the forecast period. In the year 2022, the market attained a volume of 6,758.0 Kilo Tonnes experiencing a growth of 3.2% (2019-2022).
The increasing focus on specialty crops, fruits, and high-value agriculture in North America can drive the demand for fertilizers like potassium sulfate. Consequently, the North American region would acquire nearly 17% of the total market share by 2030 As a significant agricultural region, North America relies on fertilizers to enhance crop yields. Trends may influence the adoption of this chemical in sustainable agriculture and organic farming, and there is a growing awareness of the impact of fertilizers on soil health. Some of the factors impacting the market are shift towards specialized crops and horticulture, technological advancements in manufacturing and high production cost of the chemical.
Specialized crops often have specific nutrient requirements for optimal growth, quality, and yield. Fruits, vegetables, and high-value horticultural products demand a balanced supply of essential nutrients throughout their growth. The, providing both potassium and sulfur in a chloride-free form, meets the nutrient needs of these crops without introducing elements that could be detrimental to their development. Furthermore, the trend toward specialized crops aligns with the broader movement toward organic and sustainable agriculture. The chemical is well-suited for the cultivation of specialized crops within the context of sustainable agricultural systems. These factors will drive the demand for the chemical in the coming years. Additionally, Advancements in extraction methods, including more efficient mining techniques and the utilization of alternative sources, have expanded the availability of raw materials for the chemical production. Furthermore, energy-intensive processes are common in chemical manufacturing. Progress in energy-efficient technologies, including optimizing heating and ventilation systems and utilizing renewable energy sources, contributes to the sustainability of the chemical production. Owing to these factors, there will be an increased demand in the market.
However, this chemical is often derived from potash minerals, and the extraction process can be labor-intensive and involve substantial energy consumption. Traditional mining methods, such as underground or solution mining, can contribute to the overall cost of obtaining raw materials for chemical production. The cost of accessing and extracting potash minerals significantly influences the final cost of the chemical. Moreover, the availability of potash reserves, the primary source for the chemical production, is limited. This limitation can increase competition for access to these reserves, potentially driving up extraction costs. Owing to these factors, there can be reduced demand for the chemical in the future.
Form Outlook
Based on form, the market is bifurcated into solid and liquid. In 2022, the liquid segment garnered a significant revenue share in the market. Liquid fertilizers, including liquid chemical formulations, are often preferred for their ease of application. They can be easily mixed with irrigation systems, making application more convenient for farmers. The liquid form allows for precise and uniform distribution, especially in modern precision agriculture practices. Liquid form is suitable for foliar application, where the fertilizer is sprayed directly on the leaves of the plants. These aspects will boost the demand in the segment.
Purity Outlook
On the basis of purity, the market is divided into up to 99% and greater than 99%. In 2022, the greater than 99% segment witnessed a substantial revenue share in the market. Agriculture is increasingly becoming precision-oriented, with farmers seeking fertilizers that offer high purity to ensure precise nutrient delivery to crops. Fertilizers with greater than 99% purity provide a concentrated and reliable source of potassium, addressing the specific needs of crops without introducing impurities. Therefore, the segment will expand rapidly in the coming years.
End User Outlook
Based on end user, the market is segmented into agriculture, industrial, pharmaceuticals, food & beverages, and others. In 2022, the industrial segment witnessed a substantial revenue share in the market. Within the industrial sector, the chemical is utilized in certain pharmaceutical formulations. Its inclusion in medications and pharmaceutical processes contributes to the demand. The chemical is a valuable compound in the chemical industry, serving as a raw material for producing various chemicals. Moreover, the chemical is recognized for its use in the food industry as a food additive. It may be employed as a gelling agent, firming agent, or stabilizer in certain food products. Therefore, the segment will grow rapidly in the coming years.
Regional Outlook
By region, the market is segmented into North America, Europe, Asia Pacific, and LAMEA. The Asia Pacific segment procured the highest revenue share in the market in 2022. With its diverse climates and large agricultural sector, the Asia Pacific region has been experiencing agricultural expansion and intensification. As farmers seek to optimize yields and improve crop quality, the demand for fertilizers, including potassium sulfate, will likely increase. The chemical is preferred for its effect on color and flavor, which is especially significant in the case of high-value commodities like fruits and vegetables. Owing to these factors, there will be an increased demand in the segment.
The market research report covers the analysis of key stake holders of the market. Key companies profiled in the report include Yara International ASA, Compass Minerals International, Inc., Halogen, Sesoda Corporation, K+S Aktiengesellschaft, SOCIEDAD QUIMICA Y MINERA DE CHILE S.A, Intrepid Potash Inc., Tessenderlo Group nv and The Mosaic Company
Scope of the Study
Market Segments covered in the Report:
By Form (Volume, Kilo Tonnes, USD Billion, 2019-2030)
- Solid
- Liquid
By Purity (Volume, Kilo Tonnes, USD Billion, 2019-2030)
- Up to 99%
- Greater than 99%
By End User (Volume, Kilo Tonnes, USD Billion, 2019-2030)
- Agriculture
- Industrial
- Pharmaceuticals
- Food & Beverages
- Others
By Geography (Volume, Kilo Tonnes, USD Billion, 2019-2030)
- North America
- US
- Canada
- Mexico
- Rest of North America
- Europe
- Russia
- France
- Germany
- UK
- Spain
- Italy
- Rest of Europe
- Asia Pacific
- China
- India
- Japan
- South Korea
- Australia
- Indonesia
- Rest of Asia Pacific
- LAMEA
- Brazil
- Argentina
- UAE
- Saudi Arabia
- South Africa
- Nigeria
- Rest of LAMEA
Companies Profiled
- Yara International ASA
- Compass Minerals International, Inc.
- Halogen
- Sesoda Corporation
- K+S Aktiengesellschaft
- SOCIEDAD QUIMICA Y MINERA DE CHILE S.A
- Intrepid Potash Inc.
- Tessenderlo Group nv
- The Mosaic Company
Unique Offerings from KBV Research
- Exhaustive coverage
- Highest number of market tables and figures
- Subscription based model available
- Guaranteed best price
- Assured post sales research support with 10% customization free
Table of Contents
Chapter 1. Market Scope & Methodology
- 1.1 Market Definition
- 1.2 Objectives
- 1.3 Market Scope
- 1.4 Segmentation
- 1.4.1 Global Potassium Sulfate Market, by Form
- 1.4.2 Global Potassium Sulfate Market, by Purity
- 1.4.3 Global Potassium Sulfate Market, by End User
- 1.4.4 Global Potassium Sulfate Market, by Geography
- 1.5 Methodology for the research
Chapter 2. Market At a Glance
- 2.1 Key Highlights
Chapter 3. Market Overview
- 3.1 Introduction
- 3.1.1 Overview
- 3.1.1.1 Market Composition and Scenario
- 3.1.1 Overview
- 3.2 Key Factors Impacting the Market
- 3.2.1 Market Drivers
- 3.2.2 Market Restraints
- 3.3 Porter Five Forces Analysis
Chapter 4. Global Potassium Sulfate Market, By Form
- 4.1 Global Solid Market, By Region
- 4.2 Global Liquid Market, By Region
Chapter 5. Global Potassium Sulfate Market, By Purity
- 5.1 Global Up to 99% Market, By Region
- 5.2 Global Greater than 99% Market, By Region
Chapter 6. Global Potassium Sulfate Market, By End User
- 6.1 Global Agriculture Market, By Region
- 6.2 Global Industrial Market, By Region
- 6.3 Global Pharmaceuticals Market, By Region
- 6.4 Global Food & Beverages Market, By Region
- 6.5 Global Others Market, By Region
Chapter 7. Global Potassium Sulfate Market, By Region
- 7.1 North America Potassium Sulfate Market
- 7.1.1 North America Potassium Sulfate Market, By Form
- 7.1.1.1 North America Solid Market, By Country
- 7.1.1.2 North America Liquid Market, By Country
- 7.1.2 North America Potassium Sulfate Market, By Purity
- 7.1.2.1 North America Up to 99% Market, By Country
- 7.1.2.2 North America Greater than 99% Market, By Country
- 7.1.3 North America Potassium Sulfate Market, By End User
- 7.1.3.1 North America Agriculture Market, By Country
- 7.1.3.2 North America Industrial Market, By Country
- 7.1.3.3 North America Pharmaceuticals Market, By Country
- 7.1.3.4 North America Food & Beverages Market, By Country
- 7.1.3.5 North America Others Market, By Country
- 7.1.4 North America Potassium Sulfate Market, By Country
- 7.1.4.1 US Potassium Sulfate Market
- 7.1.4.1.1 US Potassium Sulfate Market, By Form
- 7.1.4.1.2 US Potassium Sulfate Market, By Purity
- 7.1.4.1.3 US Potassium Sulfate Market, By End User
- 7.1.4.2 Canada Potassium Sulfate Market
- 7.1.4.2.1 Canada Potassium Sulfate Market, By Form
- 7.1.4.2.2 Canada Potassium Sulfate Market, By Purity
- 7.1.4.2.3 Canada Potassium Sulfate Market, By End User
- 7.1.4.3 Mexico Potassium Sulfate Market
- 7.1.4.3.1 Mexico Potassium Sulfate Market, By Form
- 7.1.4.3.2 Mexico Potassium Sulfate Market, By Purity
- 7.1.4.3.3 Mexico Potassium Sulfate Market, By End User
- 7.1.4.4 Rest of North America Potassium Sulfate Market
- 7.1.4.4.1 Rest of North America Potassium Sulfate Market, By Form
- 7.1.4.4.2 Rest of North America Potassium Sulfate Market, By Purity
- 7.1.4.4.3 Rest of North America Potassium Sulfate Market, By End User
- 7.1.4.1 US Potassium Sulfate Market
- 7.1.1 North America Potassium Sulfate Market, By Form
- 7.2 Europe Potassium Sulfate Market
- 7.2.1 Europe Potassium Sulfate Market, By Form
- 7.2.1.1 Europe Solid Market, By Country
- 7.2.1.2 Europe Liquid Market, By Country
- 7.2.2 Europe Potassium Sulfate Market, By Purity
- 7.2.2.1 Europe Up to 99% Market, By Country
- 7.2.2.2 Europe Greater than 99% Market, By Country
- 7.2.3 Europe Potassium Sulfate Market, By End User
- 7.2.3.1 Europe Agriculture Market, By Country
- 7.2.3.2 Europe Industrial Market, By Country
- 7.2.3.3 Europe Pharmaceuticals Market, By Country
- 7.2.3.4 Europe Food & Beverages Market, By Country
- 7.2.3.5 Europe Others Market, By Country
- 7.2.4 Europe Potassium Sulfate Market, By Country
- 7.2.4.1 Russia Potassium Sulfate Market
- 7.2.4.1.1 Russia Potassium Sulfate Market, By Form
- 7.2.4.1.2 Russia Potassium Sulfate Market, By Purity
- 7.2.4.1.3 Russia Potassium Sulfate Market, By End User
- 7.2.4.2 France Potassium Sulfate Market
- 7.2.4.2.1 France Potassium Sulfate Market, By Form
- 7.2.4.2.2 France Potassium Sulfate Market, By Purity
- 7.2.4.2.3 France Potassium Sulfate Market, By End User
- 7.2.4.3 Germany Potassium Sulfate Market
- 7.2.4.3.1 Germany Potassium Sulfate Market, By Form
- 7.2.4.3.2 Germany Potassium Sulfate Market, By Purity
- 7.2.4.3.3 Germany Potassium Sulfate Market, By End User
- 7.2.4.4 UK Potassium Sulfate Market
- 7.2.4.4.1 UK Potassium Sulfate Market, By Form
- 7.2.4.4.2 UK Potassium Sulfate Market, By Purity
- 7.2.4.4.3 UK Potassium Sulfate Market, By End User
- 7.2.4.5 Spain Potassium Sulfate Market
- 7.2.4.5.1 Spain Potassium Sulfate Market, By Form
- 7.2.4.5.2 Spain Potassium Sulfate Market, By Purity
- 7.2.4.5.3 Spain Potassium Sulfate Market, By End User
- 7.2.4.6 Italy Potassium Sulfate Market
- 7.2.4.6.1 Italy Potassium Sulfate Market, By Form
- 7.2.4.6.2 Italy Potassium Sulfate Market, By Purity
- 7.2.4.6.3 Italy Potassium Sulfate Market, By End User
- 7.2.4.7 Rest of Europe Potassium Sulfate Market
- 7.2.4.7.1 Rest of Europe Potassium Sulfate Market, By Form
- 7.2.4.7.2 Rest of Europe Potassium Sulfate Market, By Purity
- 7.2.4.7.3 Rest of Europe Potassium Sulfate Market, By End User
- 7.2.4.1 Russia Potassium Sulfate Market
- 7.2.1 Europe Potassium Sulfate Market, By Form
- 7.3 Asia Pacific Potassium Sulfate Market
- 7.3.1 Asia Pacific Potassium Sulfate Market, By Form
- 7.3.1.1 Asia Pacific Solid Market, By Country
- 7.3.1.2 Asia Pacific Liquid Market, By Country
- 7.3.2 Asia Pacific Potassium Sulfate Market, By Purity
- 7.3.2.1 Asia Pacific Up to 99% Market, By Country
- 7.3.2.2 Asia Pacific Greater than 99% Market, By Country
- 7.3.3 Asia Pacific Potassium Sulfate Market, By End User
- 7.3.3.1 Asia Pacific Agriculture Market, By Country
- 7.3.3.2 Asia Pacific Industrial Market, By Country
- 7.3.3.3 Asia Pacific Pharmaceuticals Market, By Country
- 7.3.3.4 Asia Pacific Food & Beverages Market, By Country
- 7.3.3.5 Asia Pacific Others Market, By Country
- 7.3.4 Asia Pacific Potassium Sulfate Market, By Country
- 7.3.4.1 China Potassium Sulfate Market
- 7.3.4.1.1 China Potassium Sulfate Market, By Form
- 7.3.4.1.2 China Potassium Sulfate Market, By Purity
- 7.3.4.1.3 China Potassium Sulfate Market, By End User
- 7.3.4.2 India Potassium Sulfate Market
- 7.3.4.2.1 India Potassium Sulfate Market, By Form
- 7.3.4.2.2 India Potassium Sulfate Market, By Purity
- 7.3.4.2.3 India Potassium Sulfate Market, By End User
- 7.3.4.3 Japan Potassium Sulfate Market
- 7.3.4.3.1 Japan Potassium Sulfate Market, By Form
- 7.3.4.3.2 Japan Potassium Sulfate Market, By Purity
- 7.3.4.3.3 Japan Potassium Sulfate Market, By End User
- 7.3.4.4 South Korea Potassium Sulfate Market
- 7.3.4.4.1 South Korea Potassium Sulfate Market, By Form
- 7.3.4.4.2 South Korea Potassium Sulfate Market, By Purity
- 7.3.4.4.3 South Korea Potassium Sulfate Market, By End User
- 7.3.4.5 Australia Potassium Sulfate Market
- 7.3.4.5.1 Australia Potassium Sulfate Market, By Form
- 7.3.4.5.2 Australia Potassium Sulfate Market, By Purity
- 7.3.4.5.3 Australia Potassium Sulfate Market, By End User
- 7.3.4.6 Indonesia Potassium Sulfate Market
- 7.3.4.6.1 Indonesia Potassium Sulfate Market, By Form
- 7.3.4.6.2 Indonesia Potassium Sulfate Market, By Purity
- 7.3.4.6.3 Indonesia Potassium Sulfate Market, By End User
- 7.3.4.7 Rest of Asia Pacific Potassium Sulfate Market
- 7.3.4.7.1 Rest of Asia Pacific Potassium Sulfate Market, By Form
- 7.3.4.7.2 Rest of Asia Pacific Potassium Sulfate Market, By Purity
- 7.3.4.7.3 Rest of Asia Pacific Potassium Sulfate Market, By End User
- 7.3.4.1 China Potassium Sulfate Market
- 7.3.1 Asia Pacific Potassium Sulfate Market, By Form
- 7.4 LAMEA Potassium Sulfate Market
- 7.4.1 LAMEA Potassium Sulfate Market, By Form
- 7.4.1.1 LAMEA Solid Market, By Country
- 7.4.1.2 LAMEA Liquid Market, By Country
- 7.4.2 LAMEA Potassium Sulfate Market, By Purity
- 7.4.2.1 LAMEA Up to 99% Market, By Country
- 7.4.2.2 LAMEA Greater than 99% Market, By Country
- 7.4.3 LAMEA Potassium Sulfate Market, By End User
- 7.4.3.1 LAMEA Agriculture Market, By Country
- 7.4.3.2 LAMEA Industrial Market, By Country
- 7.4.3.3 LAMEA Pharmaceuticals Market, By Country
- 7.4.3.4 LAMEA Food & Beverages Market, By Country
- 7.4.3.5 LAMEA Others Market, By Country
- 7.4.4 LAMEA Potassium Sulfate Market, By Country
- 7.4.4.1 Brazil Potassium Sulfate Market
- 7.4.4.1.1 Brazil Potassium Sulfate Market, By Form
- 7.4.4.1.2 Brazil Potassium Sulfate Market, By Purity
- 7.4.4.1.3 Brazil Potassium Sulfate Market, By End User
- 7.4.4.2 Argentina Potassium Sulfate Market
- 7.4.4.2.1 Argentina Potassium Sulfate Market, By Form
- 7.4.4.2.2 Argentina Potassium Sulfate Market, By Purity
- 7.4.4.2.3 Argentina Potassium Sulfate Market, By End User
- 7.4.4.3 UAE Potassium Sulfate Market
- 7.4.4.3.1 UAE Potassium Sulfate Market, By Form
- 7.4.4.3.2 UAE Potassium Sulfate Market, By Purity
- 7.4.4.3.3 UAE Potassium Sulfate Market, By End User
- 7.4.4.4 Saudi Arabia Potassium Sulfate Market
- 7.4.4.4.1 Saudi Arabia Potassium Sulfate Market, By Form
- 7.4.4.4.2 Saudi Arabia Potassium Sulfate Market, By Purity
- 7.4.4.4.3 Saudi Arabia Potassium Sulfate Market, By End User
- 7.4.4.5 South Africa Potassium Sulfate Market
- 7.4.4.5.1 South Africa Potassium Sulfate Market, By Form
- 7.4.4.5.2 South Africa Potassium Sulfate Market, By Purity
- 7.4.4.5.3 South Africa Potassium Sulfate Market, By End User
- 7.4.4.6 Nigeria Potassium Sulfate Market
- 7.4.4.6.1 Nigeria Potassium Sulfate Market, By Form
- 7.4.4.6.2 Nigeria Potassium Sulfate Market, By Purity
- 7.4.4.6.3 Nigeria Potassium Sulfate Market, By End User
- 7.4.4.7 Rest of LAMEA Potassium Sulfate Market
- 7.4.4.7.1 Rest of LAMEA Potassium Sulfate Market, By Form
- 7.4.4.7.2 Rest of LAMEA Potassium Sulfate Market, By Purity
- 7.4.4.7.3 Rest of LAMEA Potassium Sulfate Market, By End User
- 7.4.4.1 Brazil Potassium Sulfate Market
- 7.4.1 LAMEA Potassium Sulfate Market, By Form
Chapter 8. Company Profiles
- 8.1 Sesoda Corporation
- 8.1.1 Company Overview
- 8.1.2 Financial Analysis
- 8.2 Sociedad Quimica Y Minera De Chile S.A
- 8.2.1 Company Overview
- 8.2.2 Financial Analysis
- 8.2.3 Segmental and Regional Analysis
- 8.3 Halogen
- 8.3.1 Company Overview
- 8.4 Yara International ASA
- 8.4.1 Company Overview
- 8.4.2 Financial Analysis
- 8.4.3 Segmental and Regional Analysis
- 8.4.4 Research & Development Expenses
- 8.5 The Mosaic Company
- 8.5.1 Company Overview
- 8.5.2 Financial Analysis
- 8.5.3 Segmental and Regional Analysis
- 8.5.4 SWOT Analysis
- 8.6 Compass Minerals International, Inc.
- 8.6.1 Company Overview
- 8.6.2 Financial Analysis
- 8.6.3 Segmental and Regional Analysis
- 8.6.4 SWOT Analysis
- 8.7 K+S Aktiengesellschaft
- 8.7.1 Company Overview
- 8.7.2 Financial Analysis
- 8.7.3 Regional Analysis
- 8.7.4 Research & Development Expenses
- 8.7.5 Recent strategies and developments:
- 8.7.5.1 Partnerships, Collaborations, and Agreements:
- 8.8 Intrepid Potash Inc.
- 8.8.1 Company Overview
- 8.8.2 Financial Analysis
- 8.8.3 Segmental Analysis
- 8.8.4 SWOT Analysis
- 8.9 Tessenderlo Group nv
- 8.9.1 Company Overview
- 8.9.2 Financial Analysis
- 8.9.3 Segmental and Regional Analysis
- 8.9.4 Research & Development Expenses
- 8.9.5 SWOT Analysis

