|
|
市場調査レポート
商品コード
1395858
ベクトルデータベースの世界市場規模、シェア、産業動向分析レポート:提供別、技術別、業界別、地域別展望と予測、2023年~2030年Global Vector Database Market Size, Share & Industry Trends Analysis Report By Offering, By Technology (Natural Language Processing, Computer Vision, and Recommendation Systems), By Vertical, By Regional Outlook and Forecast, 2023 - 2030 |
||||||
|
|
|||||||
|
|||||||


| ベクトルデータベースの世界市場規模、シェア、産業動向分析レポート:提供別、技術別、業界別、地域別展望と予測、2023年~2030年 |
|
出版日: 2023年11月30日
発行: KBV Research
ページ情報: 英文 250 Pages
納期: 即納可能
|

- 全表示
- 概要
- 図表
- 目次
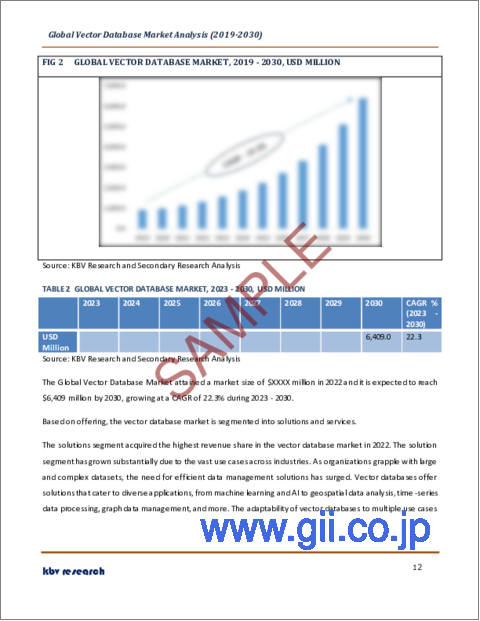
ベクトルデータベース市場規模は2030年までに64億米ドルに達し、予測期間中のCAGRは22.3%の市場成長率で上昇すると予測されます。
しかし、高性能サーバー、大容量メモリー、特定の処理装置(計算を高速化するGPUなど)など、必要なインフラを取得するには多額の初期費用がかかります。例えば、インメモリデータベースでは、データをメモリに直接保存して処理するため、十分なメモリ容量を備えた堅牢なインフラが必要になります。このような特殊なハードウェア要件は、初期設定コストを大幅に引き上げる可能性があります。特に、投資収益率(ROI)やデータベースが組織に提供できる直接的な価値を評価する際には、このようなコストの高さが躊躇の原因となる可能性があります。したがって、こうした側面が今後数年間の市場の成長を抑制すると予想されます。
提供の展望
市場セグメンテーションでは、市場はソリューションとサービスに区分されます。2022年の市場では、ソリューション部門が最も高い収益シェアを獲得しました。ソリューション・セグメントは、業種を超えた膨大な使用事例によって大きく成長しています。組織が大規模で複雑なデータセットに取り組む中で、効率的なデータ管理ソリューションのニーズが急増しています。これらのデータベースは、機械学習やAIから地理空間データ分析、時系列データ処理、グラフデータ管理など、多様なアプリケーションに対応するソリューションを提供しています。これらのデータベースは、複数のユースケースに適応できるため、ソリューションセグメント内での成長を促進しています。その結果、同分野は将来的に成長を遂げると思われます。
技術の展望
技術別に見ると、市場は自然言語処理、コンピューター・ビジョン、レコメンデーション・システムに分けられます。2022年には、コンピュータ・ビジョン分野が市場で大きな収益シェアを占めています。スマートフォン、監視カメラ、IoTデバイスなどのデバイスの普及により、画像・映像データが急増し、データ量が飛躍的に増加しています。コンピュータビジョンアプリケーションは、効率的な保存、検索、分析を必要とする膨大な量の視覚データを生成するが、ベクトルデータベースは高次元データを効率的に処理できるため、その管理に適しています。そのため、この分野は今後数年で急拡大すると予想されます。
業界別展望
業界別では、BFSI、小売&eコマース、ヘルスケア、IT&ITeS、メディア&エンターテインメント、製造、その他に分類されます。BFSIセグメントは、2022年の市場でかなりの収益シェアを獲得しました。BFSI組織は膨大な量の取引データと顧客データを扱っています。ベクトルデータベースを使用することで、このデータをリアルタイムで分析し、顧客行動、リスク評価、不正検知に関する洞察を得ることができます。これらのデータベースは、金融機関がパターンや動向を迅速に特定し、パーソナライズされたサービスやより正確なリスク評価を可能にします。BFSI分野は、時系列、複雑な金融モデル、リレーショナル・データなど、複雑なデータ構造を扱う。したがって、この分野は今後数年で急速に拡大すると思われます。
地域別展望
地域別では、北米、欧州、アジア太平洋、LAMEAに区分されます。2022年には、北米セグメントが市場で最も高い収益シェアを獲得しました。北米には、金融、eコマース、ヘルスケア、テクノロジーなど、多くのデータ集約型産業が存在します。これらの業界は、効率的なデータ管理ソリューションに大きく依存しています。膨大な量のデータを迅速に処理できる ベクトルデータベースは、こうした業界でますます普及しています。データ主導の意思決定が重視されるようになり、北米の企業は堅牢なビジネス・インテリジェンスおよび分析ツールへの投資を増やしています。そのため、この分野での需要は高まると思われます。
目次
第1章 市場範囲と調査手法
- 市場の定義
- 目的
- 市場範囲
- セグメンテーション
- 調査手法
第2章 市場要覧
- 主なハイライト
第3章 市場概要
- イントロダクション
- 概要
- 市場構成とシナリオ
- 概要
- 市場に影響を与える主な要因
- 市場促進要因
- 市場抑制要因
第4章 競合分析- 世界
- 市場シェア分析
- ポーターのファイブフォース分析
第5章 世界のベクトルデータベース市場:提供別
- 世界ソリューション市場:地域別
- 世界サービス市場:地域別
第6章 世界のベクトルデータベース市場:技術別
- 世界の自然言語処理市場:地域別
- 世界のコンピュータビジョン市場:地域別
- 世界のレコメンデーションシステム市場:地域別
第7章 世界のベクトルデータベース市場:業界別
- 世界のITおよびITeS市場:地域別
- 世界のヘルスケア市場:地域別
- 世界のBFSI市場:地域別
- 世界の小売およびeコマース市場:地域別
- 世界のメディア&エンターテインメント市場:地域別
- 世界の製造業市場:地域別
- 世界のその他の市場:地域別
第8章 世界のベクトルデータベース市場:地域別
- 北米
- 北米の市場:国別
- 米国
- カナダ
- メキシコ
- その他北米地域
- 北米の市場:国別
- 欧州
- 欧州の市場:国別
- ドイツ
- 英国
- フランス
- ロシア
- スペイン
- イタリア
- その他欧州地域
- 欧州の市場:国別
- アジア太平洋
- アジア太平洋の市場:国別
- 中国
- 日本
- インド
- 韓国
- シンガポール
- マレーシア
- その他アジア太平洋地域
- アジア太平洋の市場:国別
- ラテンアメリカ・中東・アフリカ
- ラテンアメリカ・中東・アフリカの市場:国別
- ブラジル
- アルゼンチン
- アラブ首長国連邦
- サウジアラビア
- 南アフリカ
- ナイジェリア
- その他ラテンアメリカ・中東・アフリカ地域
- ラテンアメリカ・中東・アフリカの市場:国別
第9章 企業プロファイル
- Microsoft Corporation
- Elastic NV
- Alibaba Cloud(Alibaba Group Holding Limited)
- Amazon Web Services, Inc(Amazon.com, Inc.)
- Google LLC(Alphabet Inc)
- DataStax, Inc
- GSI Technology, Inc
- Clarifai, Inc
- Pinecone Systems, Inc
- Rockset, Inc
第10章 市場の成功必須条件
LIST OF TABLES
- TABLE 1 Global Vector Database Market, 2019 - 2022, USD Million
- TABLE 2 Global Vector Database Market, 2023 - 2030, USD Million
- TABLE 3 Global Vector Database Market by Offering, 2019 - 2022, USD Million
- TABLE 4 Global Vector Database Market by Offering, 2023 - 2030, USD Million
- TABLE 5 Global Solutions Market by Region, 2019 - 2022, USD Million
- TABLE 6 Global Solutions Market by Region, 2023 - 2030, USD Million
- TABLE 7 Global Services Market by Region, 2019 - 2022, USD Million
- TABLE 8 Global Services Market by Region, 2023 - 2030, USD Million
- TABLE 9 Global Vector Database Market by Technology, 2019 - 2022, USD Million
- TABLE 10 Global Vector Database Market by Technology, 2023 - 2030, USD Million
- TABLE 11 Global Natural Language Processing Market by Region, 2019 - 2022, USD Million
- TABLE 12 Global Natural Language Processing Market by Region, 2023 - 2030, USD Million
- TABLE 13 Global Computer Vision Market by Region, 2019 - 2022, USD Million
- TABLE 14 Global Computer Vision Market by Region, 2023 - 2030, USD Million
- TABLE 15 Global Recommendation Systems Market by Region, 2019 - 2022, USD Million
- TABLE 16 Global Recommendation Systems Market by Region, 2023 - 2030, USD Million
- TABLE 17 Global Vector Database Market by Vertical, 2019 - 2022, USD Million
- TABLE 18 Global Vector Database Market by Vertical, 2023 - 2030, USD Million
- TABLE 19 Global IT & ITeS Market by Region, 2019 - 2022, USD Million
- TABLE 20 Global IT & ITeS Market by Region, 2023 - 2030, USD Million
- TABLE 21 Global Healthcare Market by Region, 2019 - 2022, USD Million
- TABLE 22 Global Healthcare Market by Region, 2023 - 2030, USD Million
- TABLE 23 Global BFSI Market by Region, 2019 - 2022, USD Million
- TABLE 24 Global BFSI Market by Region, 2023 - 2030, USD Million
- TABLE 25 Global Retail & E-commerce Market by Region, 2019 - 2022, USD Million
- TABLE 26 Global Retail & E-commerce Market by Region, 2023 - 2030, USD Million
- TABLE 27 Global Media & Entertainment Market by Region, 2019 - 2022, USD Million
- TABLE 28 Global Media & Entertainment Market by Region, 2023 - 2030, USD Million
- TABLE 29 Global Manufacturing Market by Region, 2019 - 2022, USD Million
- TABLE 30 Global Manufacturing Market by Region, 2023 - 2030, USD Million
- TABLE 31 Global Others Market by Region, 2019 - 2022, USD Million
- TABLE 32 Global Others Market by Region, 2023 - 2030, USD Million
- TABLE 33 Global Vector Database Market by Region, 2019 - 2022, USD Million
- TABLE 34 Global Vector Database Market by Region, 2023 - 2030, USD Million
- TABLE 35 North America Vector Database Market, 2019 - 2022, USD Million
- TABLE 36 North America Vector Database Market, 2023 - 2030, USD Million
- TABLE 37 North America Vector Database Market by Offering, 2019 - 2022, USD Million
- TABLE 38 North America Vector Database Market by Offering, 2023 - 2030, USD Million
- TABLE 39 North America Solutions Market by Region, 2019 - 2022, USD Million
- TABLE 40 North America Solutions Market by Region, 2023 - 2030, USD Million
- TABLE 41 North America Services Market by Region, 2019 - 2022, USD Million
- TABLE 42 North America Services Market by Region, 2023 - 2030, USD Million
- TABLE 43 North America Vector Database Market by Technology, 2019 - 2022, USD Million
- TABLE 44 North America Vector Database Market by Technology, 2023 - 2030, USD Million
- TABLE 45 North America Natural Language Processing Market by Country, 2019 - 2022, USD Million
- TABLE 46 North America Natural Language Processing Market by Country, 2023 - 2030, USD Million
- TABLE 47 North America Computer Vision Market by Country, 2019 - 2022, USD Million
- TABLE 48 North America Computer Vision Market by Country, 2023 - 2030, USD Million
- TABLE 49 North America Recommendation Systems Market by Country, 2019 - 2022, USD Million
- TABLE 50 North America Recommendation Systems Market by Country, 2023 - 2030, USD Million
- TABLE 51 North America Vector Database Market by Vertical, 2019 - 2022, USD Million
- TABLE 52 North America Vector Database Market by Vertical, 2023 - 2030, USD Million
- TABLE 53 North America IT & ITeS Market by Country, 2019 - 2022, USD Million
- TABLE 54 North America IT & ITeS Market by Country, 2023 - 2030, USD Million
- TABLE 55 North America Healthcare Market by Country, 2019 - 2022, USD Million
- TABLE 56 North America Healthcare Market by Country, 2023 - 2030, USD Million
- TABLE 57 North America BFSI Market by Country, 2019 - 2022, USD Million
- TABLE 58 North America BFSI Market by Country, 2023 - 2030, USD Million
- TABLE 59 North America Retail & E-commerce Market by Country, 2019 - 2022, USD Million
- TABLE 60 North America Retail & E-commerce Market by Country, 2023 - 2030, USD Million
- TABLE 61 North America Media & Entertainment Market by Country, 2019 - 2022, USD Million
- TABLE 62 North America Media & Entertainment Market by Country, 2023 - 2030, USD Million
- TABLE 63 North America Manufacturing Market by Country, 2019 - 2022, USD Million
- TABLE 64 North America Manufacturing Market by Country, 2023 - 2030, USD Million
- TABLE 65 North America Others Market by Country, 2019 - 2022, USD Million
- TABLE 66 North America Others Market by Country, 2023 - 2030, USD Million
- TABLE 67 North America Vector Database Market by Country, 2019 - 2022, USD Million
- TABLE 68 North America Vector Database Market by Country, 2023 - 2030, USD Million
- TABLE 69 US Vector Database Market, 2019 - 2022, USD Million
- TABLE 70 US Vector Database Market, 2023 - 2030, USD Million
- TABLE 71 US Vector Database Market by Offering, 2019 - 2022, USD Million
- TABLE 72 US Vector Database Market by Offering, 2023 - 2030, USD Million
- TABLE 73 US Vector Database Market by Technology, 2019 - 2022, USD Million
- TABLE 74 US Vector Database Market by Technology, 2023 - 2030, USD Million
- TABLE 75 US Vector Database Market by Vertical, 2019 - 2022, USD Million
- TABLE 76 US Vector Database Market by Vertical, 2023 - 2030, USD Million
- TABLE 77 Canada Vector Database Market, 2019 - 2022, USD Million
- TABLE 78 Canada Vector Database Market, 2023 - 2030, USD Million
- TABLE 79 Canada Vector Database Market by Offering, 2019 - 2022, USD Million
- TABLE 80 Canada Vector Database Market by Offering, 2023 - 2030, USD Million
- TABLE 81 Canada Vector Database Market by Technology, 2019 - 2022, USD Million
- TABLE 82 Canada Vector Database Market by Technology, 2023 - 2030, USD Million
- TABLE 83 Canada Vector Database Market by Vertical, 2019 - 2022, USD Million
- TABLE 84 Canada Vector Database Market by Vertical, 2023 - 2030, USD Million
- TABLE 85 Mexico Vector Database Market, 2019 - 2022, USD Million
- TABLE 86 Mexico Vector Database Market, 2023 - 2030, USD Million
- TABLE 87 Mexico Vector Database Market by Offering, 2019 - 2022, USD Million
- TABLE 88 Mexico Vector Database Market by Offering, 2023 - 2030, USD Million
- TABLE 89 Mexico Vector Database Market by Technology, 2019 - 2022, USD Million
- TABLE 90 Mexico Vector Database Market by Technology, 2023 - 2030, USD Million
- TABLE 91 Mexico Vector Database Market by Vertical, 2019 - 2022, USD Million
- TABLE 92 Mexico Vector Database Market by Vertical, 2023 - 2030, USD Million
- TABLE 93 Rest of North America Vector Database Market, 2019 - 2022, USD Million
- TABLE 94 Rest of North America Vector Database Market, 2023 - 2030, USD Million
- TABLE 95 Rest of North America Vector Database Market by Offering, 2019 - 2022, USD Million
- TABLE 96 Rest of North America Vector Database Market by Offering, 2023 - 2030, USD Million
- TABLE 97 Rest of North America Vector Database Market by Technology, 2019 - 2022, USD Million
- TABLE 98 Rest of North America Vector Database Market by Technology, 2023 - 2030, USD Million
- TABLE 99 Rest of North America Vector Database Market by Vertical, 2019 - 2022, USD Million
- TABLE 100 Rest of North America Vector Database Market by Vertical, 2023 - 2030, USD Million
- TABLE 101 Europe Vector Database Market, 2019 - 2022, USD Million
- TABLE 102 Europe Vector Database Market, 2023 - 2030, USD Million
- TABLE 103 Europe Vector Database Market by Offering, 2019 - 2022, USD Million
- TABLE 104 Europe Vector Database Market by Offering, 2023 - 2030, USD Million
- TABLE 105 Europe Solutions Market by Country, 2019 - 2022, USD Million
- TABLE 106 Europe Solutions Market by Country, 2023 - 2030, USD Million
- TABLE 107 Europe Services Market by Country, 2019 - 2022, USD Million
- TABLE 108 Europe Services Market by Country, 2023 - 2030, USD Million
- TABLE 109 Europe Vector Database Market by Technology, 2019 - 2022, USD Million
- TABLE 110 Europe Vector Database Market by Technology, 2023 - 2030, USD Million
- TABLE 111 Europe Natural Language Processing Market by Country, 2019 - 2022, USD Million
- TABLE 112 Europe Natural Language Processing Market by Country, 2023 - 2030, USD Million
- TABLE 113 Europe Computer Vision Market by Country, 2019 - 2022, USD Million
- TABLE 114 Europe Computer Vision Market by Country, 2023 - 2030, USD Million
- TABLE 115 Europe Recommendation Systems Market by Country, 2019 - 2022, USD Million
- TABLE 116 Europe Recommendation Systems Market by Country, 2023 - 2030, USD Million
- TABLE 117 Europe Vector Database Market by Vertical, 2019 - 2022, USD Million
- TABLE 118 Europe Vector Database Market by Vertical, 2023 - 2030, USD Million
- TABLE 119 Europe IT & ITeS Market by Country, 2019 - 2022, USD Million
- TABLE 120 Europe IT & ITeS Market by Country, 2023 - 2030, USD Million
- TABLE 121 Europe Healthcare Market by Country, 2019 - 2022, USD Million
- TABLE 122 Europe Healthcare Market by Country, 2023 - 2030, USD Million
- TABLE 123 Europe BFSI Market by Country, 2019 - 2022, USD Million
- TABLE 124 Europe BFSI Market by Country, 2023 - 2030, USD Million
- TABLE 125 Europe Retail & E-commerce Market by Country, 2019 - 2022, USD Million
- TABLE 126 Europe Retail & E-commerce Market by Country, 2023 - 2030, USD Million
- TABLE 127 Europe Media & Entertainment Market by Country, 2019 - 2022, USD Million
- TABLE 128 Europe Media & Entertainment Market by Country, 2023 - 2030, USD Million
- TABLE 129 Europe Manufacturing Market by Country, 2019 - 2022, USD Million
- TABLE 130 Europe Manufacturing Market by Country, 2023 - 2030, USD Million
- TABLE 131 Europe Others Market by Country, 2019 - 2022, USD Million
- TABLE 132 Europe Others Market by Country, 2023 - 2030, USD Million
- TABLE 133 Europe Vector Database Market by Country, 2019 - 2022, USD Million
- TABLE 134 Europe Vector Database Market by Country, 2023 - 2030, USD Million
- TABLE 135 Germany Vector Database Market, 2019 - 2022, USD Million
- TABLE 136 Germany Vector Database Market, 2023 - 2030, USD Million
- TABLE 137 Germany Vector Database Market by Offering, 2019 - 2022, USD Million
- TABLE 138 Germany Vector Database Market by Offering, 2023 - 2030, USD Million
- TABLE 139 Germany Vector Database Market by Technology, 2019 - 2022, USD Million
- TABLE 140 Germany Vector Database Market by Technology, 2023 - 2030, USD Million
- TABLE 141 Germany Vector Database Market by Vertical, 2019 - 2022, USD Million
- TABLE 142 Germany Vector Database Market by Vertical, 2023 - 2030, USD Million
- TABLE 143 UK Vector Database Market, 2019 - 2022, USD Million
- TABLE 144 UK Vector Database Market, 2023 - 2030, USD Million
- TABLE 145 UK Vector Database Market by Offering, 2019 - 2022, USD Million
- TABLE 146 UK Vector Database Market by Offering, 2023 - 2030, USD Million
- TABLE 147 UK Vector Database Market by Technology, 2019 - 2022, USD Million
- TABLE 148 UK Vector Database Market by Technology, 2023 - 2030, USD Million
- TABLE 149 UK Vector Database Market by Vertical, 2019 - 2022, USD Million
- TABLE 150 UK Vector Database Market by Vertical, 2023 - 2030, USD Million
- TABLE 151 France Vector Database Market, 2019 - 2022, USD Million
- TABLE 152 France Vector Database Market, 2023 - 2030, USD Million
- TABLE 153 France Vector Database Market by Offering, 2019 - 2022, USD Million
- TABLE 154 France Vector Database Market by Offering, 2023 - 2030, USD Million
- TABLE 155 France Vector Database Market by Technology, 2019 - 2022, USD Million
- TABLE 156 France Vector Database Market by Technology, 2023 - 2030, USD Million
- TABLE 157 France Vector Database Market by Vertical, 2019 - 2022, USD Million
- TABLE 158 France Vector Database Market by Vertical, 2023 - 2030, USD Million
- TABLE 159 Russia Vector Database Market, 2019 - 2022, USD Million
- TABLE 160 Russia Vector Database Market, 2023 - 2030, USD Million
- TABLE 161 Russia Vector Database Market by Offering, 2019 - 2022, USD Million
- TABLE 162 Russia Vector Database Market by Offering, 2023 - 2030, USD Million
- TABLE 163 Russia Vector Database Market by Technology, 2019 - 2022, USD Million
- TABLE 164 Russia Vector Database Market by Technology, 2023 - 2030, USD Million
- TABLE 165 Russia Vector Database Market by Vertical, 2019 - 2022, USD Million
- TABLE 166 Russia Vector Database Market by Vertical, 2023 - 2030, USD Million
- TABLE 167 Spain Vector Database Market, 2019 - 2022, USD Million
- TABLE 168 Spain Vector Database Market, 2023 - 2030, USD Million
- TABLE 169 Spain Vector Database Market by Offering, 2019 - 2022, USD Million
- TABLE 170 Spain Vector Database Market by Offering, 2023 - 2030, USD Million
- TABLE 171 Spain Vector Database Market by Technology, 2019 - 2022, USD Million
- TABLE 172 Spain Vector Database Market by Technology, 2023 - 2030, USD Million
- TABLE 173 Spain Vector Database Market by Vertical, 2019 - 2022, USD Million
- TABLE 174 Spain Vector Database Market by Vertical, 2023 - 2030, USD Million
- TABLE 175 Italy Vector Database Market, 2019 - 2022, USD Million
- TABLE 176 Italy Vector Database Market, 2023 - 2030, USD Million
- TABLE 177 Italy Vector Database Market by Offering, 2019 - 2022, USD Million
- TABLE 178 Italy Vector Database Market by Offering, 2023 - 2030, USD Million
- TABLE 179 Italy Vector Database Market by Technology, 2019 - 2022, USD Million
- TABLE 180 Italy Vector Database Market by Technology, 2023 - 2030, USD Million
- TABLE 181 Italy Vector Database Market by Vertical, 2019 - 2022, USD Million
- TABLE 182 Italy Vector Database Market by Vertical, 2023 - 2030, USD Million
- TABLE 183 Rest of Europe Vector Database Market, 2019 - 2022, USD Million
- TABLE 184 Rest of Europe Vector Database Market, 2023 - 2030, USD Million
- TABLE 185 Rest of Europe Vector Database Market by Offering, 2019 - 2022, USD Million
- TABLE 186 Rest of Europe Vector Database Market by Offering, 2023 - 2030, USD Million
- TABLE 187 Rest of Europe Vector Database Market by Technology, 2019 - 2022, USD Million
- TABLE 188 Rest of Europe Vector Database Market by Technology, 2023 - 2030, USD Million
- TABLE 189 Rest of Europe Vector Database Market by Vertical, 2019 - 2022, USD Million
- TABLE 190 Rest of Europe Vector Database Market by Vertical, 2023 - 2030, USD Million
- TABLE 191 Asia Pacific Vector Database Market, 2019 - 2022, USD Million
- TABLE 192 Asia Pacific Vector Database Market, 2023 - 2030, USD Million
- TABLE 193 Asia Pacific Vector Database Market by Offering, 2019 - 2022, USD Million
- TABLE 194 Asia Pacific Vector Database Market by Offering, 2023 - 2030, USD Million
- TABLE 195 Asia Pacific Solutions Market by Country, 2019 - 2022, USD Million
- TABLE 196 Asia Pacific Solutions Market by Country, 2023 - 2030, USD Million
- TABLE 197 Asia Pacific Services Market by Country, 2019 - 2022, USD Million
- TABLE 198 Asia Pacific Services Market by Country, 2023 - 2030, USD Million
- TABLE 199 Asia Pacific Vector Database Market by Technology, 2019 - 2022, USD Million
- TABLE 200 Asia Pacific Vector Database Market by Technology, 2023 - 2030, USD Million
- TABLE 201 Asia Pacific Natural Language Processing Market by Country, 2019 - 2022, USD Million
- TABLE 202 Asia Pacific Natural Language Processing Market by Country, 2023 - 2030, USD Million
- TABLE 203 Asia Pacific Computer Vision Market by Country, 2019 - 2022, USD Million
- TABLE 204 Asia Pacific Computer Vision Market by Country, 2023 - 2030, USD Million
- TABLE 205 Asia Pacific Recommendation Systems Market by Country, 2019 - 2022, USD Million
- TABLE 206 Asia Pacific Recommendation Systems Market by Country, 2023 - 2030, USD Million
- TABLE 207 Asia Pacific Vector Database Market by Vertical, 2019 - 2022, USD Million
- TABLE 208 Asia Pacific Vector Database Market by Vertical, 2023 - 2030, USD Million
- TABLE 209 Asia Pacific IT & ITeS Market by Country, 2019 - 2022, USD Million
- TABLE 210 Asia Pacific IT & ITeS Market by Country, 2023 - 2030, USD Million
- TABLE 211 Asia Pacific Healthcare Market by Country, 2019 - 2022, USD Million
- TABLE 212 Asia Pacific Healthcare Market by Country, 2023 - 2030, USD Million
- TABLE 213 Asia Pacific BFSI Market by Country, 2019 - 2022, USD Million
- TABLE 214 Asia Pacific BFSI Market by Country, 2023 - 2030, USD Million
- TABLE 215 Asia Pacific Retail & E-commerce Market by Country, 2019 - 2022, USD Million
- TABLE 216 Asia Pacific Retail & E-commerce Market by Country, 2023 - 2030, USD Million
- TABLE 217 Asia Pacific Media & Entertainment Market by Country, 2019 - 2022, USD Million
- TABLE 218 Asia Pacific Media & Entertainment Market by Country, 2023 - 2030, USD Million
- TABLE 219 Asia Pacific Manufacturing Market by Country, 2019 - 2022, USD Million
- TABLE 220 Asia Pacific Manufacturing Market by Country, 2023 - 2030, USD Million
- TABLE 221 Asia Pacific Others Market by Country, 2019 - 2022, USD Million
- TABLE 222 Asia Pacific Others Market by Country, 2023 - 2030, USD Million
- TABLE 223 Asia Pacific Vector Database Market by Country, 2019 - 2022, USD Million
- TABLE 224 Asia Pacific Vector Database Market by Country, 2023 - 2030, USD Million
- TABLE 225 China Vector Database Market, 2019 - 2022, USD Million
- TABLE 226 China Vector Database Market, 2023 - 2030, USD Million
- TABLE 227 China Vector Database Market by Offering, 2019 - 2022, USD Million
- TABLE 228 China Vector Database Market by Offering, 2023 - 2030, USD Million
- TABLE 229 China Vector Database Market by Technology, 2019 - 2022, USD Million
- TABLE 230 China Vector Database Market by Technology, 2023 - 2030, USD Million
- TABLE 231 China Vector Database Market by Vertical, 2019 - 2022, USD Million
- TABLE 232 China Vector Database Market by Vertical, 2023 - 2030, USD Million
- TABLE 233 Japan Vector Database Market, 2019 - 2022, USD Million
- TABLE 234 Japan Vector Database Market, 2023 - 2030, USD Million
- TABLE 235 Japan Vector Database Market by Offering, 2019 - 2022, USD Million
- TABLE 236 Japan Vector Database Market by Offering, 2023 - 2030, USD Million
- TABLE 237 Japan Vector Database Market by Technology, 2019 - 2022, USD Million
- TABLE 238 Japan Vector Database Market by Technology, 2023 - 2030, USD Million
- TABLE 239 Japan Vector Database Market by Vertical, 2019 - 2022, USD Million
- TABLE 240 Japan Vector Database Market by Vertical, 2023 - 2030, USD Million
- TABLE 241 India Vector Database Market, 2019 - 2022, USD Million
- TABLE 242 India Vector Database Market, 2023 - 2030, USD Million
- TABLE 243 India Vector Database Market by Offering, 2019 - 2022, USD Million
- TABLE 244 India Vector Database Market by Offering, 2023 - 2030, USD Million
- TABLE 245 India Vector Database Market by Technology, 2019 - 2022, USD Million
- TABLE 246 India Vector Database Market by Technology, 2023 - 2030, USD Million
- TABLE 247 India Vector Database Market by Vertical, 2019 - 2022, USD Million
- TABLE 248 India Vector Database Market by Vertical, 2023 - 2030, USD Million
- TABLE 249 South Korea Vector Database Market, 2019 - 2022, USD Million
- TABLE 250 South Korea Vector Database Market, 2023 - 2030, USD Million
- TABLE 251 South Korea Vector Database Market by Offering, 2019 - 2022, USD Million
- TABLE 252 South Korea Vector Database Market by Offering, 2023 - 2030, USD Million
- TABLE 253 South Korea Vector Database Market by Technology, 2019 - 2022, USD Million
- TABLE 254 South Korea Vector Database Market by Technology, 2023 - 2030, USD Million
- TABLE 255 South Korea Vector Database Market by Vertical, 2019 - 2022, USD Million
- TABLE 256 South Korea Vector Database Market by Vertical, 2023 - 2030, USD Million
- TABLE 257 Singapore Vector Database Market, 2019 - 2022, USD Million
- TABLE 258 Singapore Vector Database Market, 2023 - 2030, USD Million
- TABLE 259 Singapore Vector Database Market by Offering, 2019 - 2022, USD Million
- TABLE 260 Singapore Vector Database Market by Offering, 2023 - 2030, USD Million
- TABLE 261 Singapore Vector Database Market by Technology, 2019 - 2022, USD Million
- TABLE 262 Singapore Vector Database Market by Technology, 2023 - 2030, USD Million
- TABLE 263 Singapore Vector Database Market by Vertical, 2019 - 2022, USD Million
- TABLE 264 Singapore Vector Database Market by Vertical, 2023 - 2030, USD Million
- TABLE 265 Malaysia Vector Database Market, 2019 - 2022, USD Million
- TABLE 266 Malaysia Vector Database Market, 2023 - 2030, USD Million
- TABLE 267 Malaysia Vector Database Market by Offering, 2019 - 2022, USD Million
- TABLE 268 Malaysia Vector Database Market by Offering, 2023 - 2030, USD Million
- TABLE 269 Malaysia Vector Database Market by Technology, 2019 - 2022, USD Million
- TABLE 270 Malaysia Vector Database Market by Technology, 2023 - 2030, USD Million
- TABLE 271 Malaysia Vector Database Market by Vertical, 2019 - 2022, USD Million
- TABLE 272 Malaysia Vector Database Market by Vertical, 2023 - 2030, USD Million
- TABLE 273 Rest of Asia Pacific Vector Database Market, 2019 - 2022, USD Million
- TABLE 274 Rest of Asia Pacific Vector Database Market, 2023 - 2030, USD Million
- TABLE 275 Rest of Asia Pacific Vector Database Market by Offering, 2019 - 2022, USD Million
- TABLE 276 Rest of Asia Pacific Vector Database Market by Offering, 2023 - 2030, USD Million
- TABLE 277 Rest of Asia Pacific Vector Database Market by Technology, 2019 - 2022, USD Million
- TABLE 278 Rest of Asia Pacific Vector Database Market by Technology, 2023 - 2030, USD Million
- TABLE 279 Rest of Asia Pacific Vector Database Market by Vertical, 2019 - 2022, USD Million
- TABLE 280 Rest of Asia Pacific Vector Database Market by Vertical, 2023 - 2030, USD Million
The Global Vector Database Market size is expected to reach $6.4 billion by 2030, rising at a market growth of 22.3% CAGR during the forecast period.
The IT and ITeS sector extensively leverage these databases for handling vast amounts of data. Thus, IT and ITeS segment acquired $442.5 million in 2022. These databases offer high-performance solutions for data processing and analytics, empowering companies in this segment to manage, analyze, and derive insights from intricate and high-dimensional datasets. This capability is crucial for diverse applications in software development, data analysis, and customer-oriented solutions. These aspects are beneficial for increasing demand in the segment. Some of the factors impacting the market are the rise of AI and machine learning, need for high performance across sectors, and high cost of implementation and infrastructure.
Integrating AI and ML tools directly within the database environment streamlines the analytics process by eliminating the need for extensive data preprocessing. This means that analytical models can operate on the raw, high-dimensional data stored in these databases, avoiding time-consuming and resource-intensive data preparation stages. As a result, it simplifies the overall data pipeline, allowing organizations to extract insights more rapidly and efficiently. This real-time analysis facilitates quicker decision-making, allowing organizations to respond promptly to changing conditions and emerging trends. Additionally, the high-performance analytics offered by these databases, attributed to their optimized data structures and query processing, play a pivotal role in various sectors. In finance, real-time analysis is vital for making split-second decisions. These databases enable swift analysis of operational data, ensuring streamlined and efficient processes. Owing to these factors, the market will expand rapidly in the coming years.
However, Acquiring the necessary infrastructure, whether it involves high-performance servers, substantial memory, or specific processing units (e.g., GPUs for accelerating computations), can incur substantial upfront costs. For instance, in-memory databases necessitate a robust infrastructure with ample memory capacity to store and process data directly in memory. These specialized hardware requirements can significantly escalate the initial setup costs. The perceived high costs may cause hesitation, particularly when evaluating the return on investment (ROI) and the immediate value the database can provide to the organization. Thus, these aspects are expected to restrain the growth of the market in the coming years.
Offering Outlook
Based on offering, the market is segmented into solutions and services. The solutions segment acquired the highest revenue share in the market in 2022. The solution segment has grown substantially due to the vast use cases across industries. As organizations grapple with large and complex datasets, the need for efficient data management solutions has surged. These databases offer solutions that cater to diverse applications, from machine learning and AI to geospatial data analysis, time-series data processing, graph data management, and more. The adaptability of These databases to multiple use cases has propelled their growth within the solution segment. As a result, the segment will witness increased growth in the future.
Technology Outlook
On the basis of technology, the market is divided into natural language processing, computer vision, and recommendation systems. In 2022, the computer vision segment witnessed a substantial revenue share in the market. The proliferation of image and video data due to the widespread use of devices such as smartphones, surveillance cameras, and IoT devices has led to an exponential increase in data volume. Computer vision applications generate huge amounts of visual data that require efficient storage, retrieval, and analysis, which vector databases are well-suited to manage due to their ability to handle high-dimensional data efficiently. Therefore, the segment is expected to proliferate in the coming years.
Vertical Outlook
Based on vertical, the market is divided into BFSI, retail & e-commerce, healthcare, IT & ITeS, media & entertainment, manufacturing, and others. The BFSI segment procured a substantial revenue share in the market in 2022. BFSI organizations deal with vast amounts of transactional and customer data. The use of vector databases allows for real-time analysis of this data, offering insights into customer behavior, risk assessment, and fraud detection. These databases empower financial institutions to quickly identify patterns and trends, enabling personalized services and more accurate risk evaluations. The BFSI sector deals with intricate data structures, including time series, complex financial models, and relational data. Therefore, the segment will expand rapidly in the upcoming years.
Regional Outlook
By region, the market is segmented into North America, Europe, Asia Pacific, and LAMEA. In 2022, the North America segment acquired the highest revenue share in the market. North America houses many data-intensive industries, such as finance, e-commerce, healthcare, and technology. These sectors rely heavily on efficient data management solutions. Vector databases, with their capabilities to process vast amounts of data quickly, have become increasingly popular in these industries. With a growing emphasis on data-driven decision-making, businesses in North America have been increasingly investing in robust business intelligence and analytics tools. Thus, there will be increased demand in the segment.
The market research report covers the analysis of key stake holders of the market. Key companies profiled in the report include Microsoft Corporation, Elastic N.V., Alibaba Cloud (Alibaba Group Holding Limited), Amazon Web Services, Inc. (Amazon.com, Inc.), Google LLC (Alphabet Inc.), DataStax, Inc., GSI Technology, Inc., Clarifai, Inc., Pinecone Systems, Inc., Rockset, Inc.
Scope of the Study
Market Segments covered in the Report:
By Offering
- Solutions
- Services
By Technology
- Natural Language Processing
- Computer Vision
- Recommendation Systems
By Vertical
- IT & ITeS
- Healthcare
- BFSI
- Retail & E-commerce
- Media & Entertainment
- Manufacturing
- Others
By Geography
- North America
- US
- Canada
- Mexico
- Rest of North America
- Europe
- Germany
- UK
- France
- Russia
- Spain
- Italy
- Rest of Europe
- Asia Pacific
- China
- Japan
- India
- South Korea
- Singapore
- Malaysia
- Rest of Asia Pacific
- LAMEA
- Brazil
- Argentina
- UAE
- Saudi Arabia
- South Africa
- Nigeria
- Rest of LAMEA
Companies Profiled
- Microsoft Corporation
- Elastic N.V.
- Alibaba Cloud (Alibaba Group Holding Limited)
- Amazon Web Services, Inc. (Amazon.com, Inc.)
- Google LLC (Alphabet Inc.)
- DataStax, Inc.
- GSI Technology, Inc.
- Clarifai, Inc.
- Pinecone Systems, Inc.
- Rockset, Inc.
Unique Offerings from KBV Research
- Exhaustive coverage
- Highest number of market tables and figures
- Subscription based model available
- Guaranteed best price
- Assured post sales research support with 10% customization free
Table of Contents
Chapter 1. Market Scope & Methodology
- 1.1 Market Definition
- 1.2 Objectives
- 1.3 Market Scope
- 1.4 Segmentation
- 1.4.1 Global Vector Database Market, by Offering
- 1.4.2 Global Vector Database Market, by Technology
- 1.4.3 Global Vector Database Market, by Vertical
- 1.4.4 Global Vector Database Market, by Geography
- 1.5 Methodology for the research
Chapter 2. Market at a Glance
- 2.1 Key Highlights
Chapter 3. Market Overview
- 3.1 Introduction
- 3.1.1 Overview
- 3.1.1.1 Market Composition and Scenario
- 3.1.1 Overview
- 3.2 Key Factors Impacting the Market
- 3.2.1 Market Drivers
- 3.2.2 Market Restraints
Chapter 4. Competition Analysis - Global
- 4.1 Market Share Analysis, 2022
- 4.2 Porter's Five Forces Analysis
Chapter 5. Global Vector Database Market by Offering
- 5.1 Global Solutions Market by Region
- 5.2 Global Services Market by Region
Chapter 6. Global Vector Database Market by Technology
- 6.1 Global Natural Language Processing Market by Region
- 6.2 Global Computer Vision Market by Region
- 6.3 Global Recommendation Systems Market by Region
Chapter 7. Global Vector Database Market by Vertical
- 7.1 Global IT & ITeS Market by Region
- 7.2 Global Healthcare Market by Region
- 7.3 Global BFSI Market by Region
- 7.4 Global Retail & E-commerce Market by Region
- 7.5 Global Media & Entertainment Market by Region
- 7.6 Global Manufacturing Market by Region
- 7.7 Global Others Market by Region
Chapter 8. Global Vector Database Market by Region
- 8.1 North America Vector Database Market
- 8.1.1 North America Vector Database Market by Offering
- 8.1.1.1 North America Solutions Market by Region
- 8.1.1.2 North America Services Market by Region
- 8.1.2 North America Vector Database Market by Technology
- 8.1.2.1 North America Natural Language Processing Market by Country
- 8.1.2.2 North America Computer Vision Market by Country
- 8.1.2.3 North America Recommendation Systems Market by Country
- 8.1.3 North America Vector Database Market by Vertical
- 8.1.3.1 North America IT & ITeS Market by Country
- 8.1.3.2 North America Healthcare Market by Country
- 8.1.3.3 North America BFSI Market by Country
- 8.1.3.4 North America Retail & E-commerce Market by Country
- 8.1.3.5 North America Media & Entertainment Market by Country
- 8.1.3.6 North America Manufacturing Market by Country
- 8.1.3.7 North America Others Market by Country
- 8.1.4 North America Vector Database Market by Country
- 8.1.4.1 US Vector Database Market
- 8.1.4.1.1 US Vector Database Market by Offering
- 8.1.4.1.2 US Vector Database Market by Technology
- 8.1.4.1.3 US Vector Database Market by Vertical
- 8.1.4.2 Canada Vector Database Market
- 8.1.4.2.1 Canada Vector Database Market by Offering
- 8.1.4.2.2 Canada Vector Database Market by Technology
- 8.1.4.2.3 Canada Vector Database Market by Vertical
- 8.1.4.3 Mexico Vector Database Market
- 8.1.4.3.1 Mexico Vector Database Market by Offering
- 8.1.4.3.2 Mexico Vector Database Market by Technology
- 8.1.4.3.3 Mexico Vector Database Market by Vertical
- 8.1.4.4 Rest of North America Vector Database Market
- 8.1.4.4.1 Rest of North America Vector Database Market by Offering
- 8.1.4.4.2 Rest of North America Vector Database Market by Technology
- 8.1.4.4.3 Rest of North America Vector Database Market by Vertical
- 8.1.4.1 US Vector Database Market
- 8.1.1 North America Vector Database Market by Offering
- 8.2 Europe Vector Database Market
- 8.2.1 Europe Vector Database Market by Offering
- 8.2.1.1 Europe Solutions Market by Country
- 8.2.1.2 Europe Services Market by Country
- 8.2.2 Europe Vector Database Market by Technology
- 8.2.2.1 Europe Natural Language Processing Market by Country
- 8.2.2.2 Europe Computer Vision Market by Country
- 8.2.2.3 Europe Recommendation Systems Market by Country
- 8.2.3 Europe Vector Database Market by Vertical
- 8.2.3.1 Europe IT & ITeS Market by Country
- 8.2.3.2 Europe Healthcare Market by Country
- 8.2.3.3 Europe BFSI Market by Country
- 8.2.3.4 Europe Retail & E-commerce Market by Country
- 8.2.3.5 Europe Media & Entertainment Market by Country
- 8.2.3.6 Europe Manufacturing Market by Country
- 8.2.3.7 Europe Others Market by Country
- 8.2.4 Europe Vector Database Market by Country
- 8.2.4.1 Germany Vector Database Market
- 8.2.4.1.1 Germany Vector Database Market by Offering
- 8.2.4.1.2 Germany Vector Database Market by Technology
- 8.2.4.1.3 Germany Vector Database Market by Vertical
- 8.2.4.2 UK Vector Database Market
- 8.2.4.2.1 UK Vector Database Market by Offering
- 8.2.4.2.2 UK Vector Database Market by Technology
- 8.2.4.2.3 UK Vector Database Market by Vertical
- 8.2.4.3 France Vector Database Market
- 8.2.4.3.1 France Vector Database Market by Offering
- 8.2.4.3.2 France Vector Database Market by Technology
- 8.2.4.3.3 France Vector Database Market by Vertical
- 8.2.4.4 Russia Vector Database Market
- 8.2.4.4.1 Russia Vector Database Market by Offering
- 8.2.4.4.2 Russia Vector Database Market by Technology
- 8.2.4.4.3 Russia Vector Database Market by Vertical
- 8.2.4.5 Spain Vector Database Market
- 8.2.4.5.1 Spain Vector Database Market by Offering
- 8.2.4.5.2 Spain Vector Database Market by Technology
- 8.2.4.5.3 Spain Vector Database Market by Vertical
- 8.2.4.6 Italy Vector Database Market
- 8.2.4.6.1 Italy Vector Database Market by Offering
- 8.2.4.6.2 Italy Vector Database Market by Technology
- 8.2.4.6.3 Italy Vector Database Market by Vertical
- 8.2.4.7 Rest of Europe Vector Database Market
- 8.2.4.7.1 Rest of Europe Vector Database Market by Offering
- 8.2.4.7.2 Rest of Europe Vector Database Market by Technology
- 8.2.4.7.3 Rest of Europe Vector Database Market by Vertical
- 8.2.4.1 Germany Vector Database Market
- 8.2.1 Europe Vector Database Market by Offering
- 8.3 Asia Pacific Vector Database Market
- 8.3.1 Asia Pacific Vector Database Market by Offering
- 8.3.1.1 Asia Pacific Solutions Market by Country
- 8.3.1.2 Asia Pacific Services Market by Country
- 8.3.2 Asia Pacific Vector Database Market by Technology
- 8.3.2.1 Asia Pacific Natural Language Processing Market by Country
- 8.3.2.2 Asia Pacific Computer Vision Market by Country
- 8.3.2.3 Asia Pacific Recommendation Systems Market by Country
- 8.3.3 Asia Pacific Vector Database Market by Vertical
- 8.3.3.1 Asia Pacific IT & ITeS Market by Country
- 8.3.3.2 Asia Pacific Healthcare Market by Country
- 8.3.3.3 Asia Pacific BFSI Market by Country
- 8.3.3.4 Asia Pacific Retail & E-commerce Market by Country
- 8.3.3.5 Asia Pacific Media & Entertainment Market by Country
- 8.3.3.6 Asia Pacific Manufacturing Market by Country
- 8.3.3.7 Asia Pacific Others Market by Country
- 8.3.4 Asia Pacific Vector Database Market by Country
- 8.3.4.1 China Vector Database Market
- 8.3.4.1.1 China Vector Database Market by Offering
- 8.3.4.1.2 China Vector Database Market by Technology
- 8.3.4.1.3 China Vector Database Market by Vertical
- 8.3.4.2 Japan Vector Database Market
- 8.3.4.2.1 Japan Vector Database Market by Offering
- 8.3.4.2.2 Japan Vector Database Market by Technology
- 8.3.4.2.3 Japan Vector Database Market by Vertical
- 8.3.4.3 India Vector Database Market
- 8.3.4.3.1 India Vector Database Market by Offering
- 8.3.4.3.2 India Vector Database Market by Technology
- 8.3.4.3.3 India Vector Database Market by Vertical
- 8.3.4.4 South Korea Vector Database Market
- 8.3.4.4.1 South Korea Vector Database Market by Offering
- 8.3.4.4.2 South Korea Vector Database Market by Technology
- 8.3.4.4.3 South Korea Vector Database Market by Vertical
- 8.3.4.5 Singapore Vector Database Market
- 8.3.4.5.1 Singapore Vector Database Market by Offering
- 8.3.4.5.2 Singapore Vector Database Market by Technology
- 8.3.4.5.3 Singapore Vector Database Market by Vertical
- 8.3.4.6 Malaysia Vector Database Market
- 8.3.4.6.1 Malaysia Vector Database Market by Offering
- 8.3.4.6.2 Malaysia Vector Database Market by Technology
- 8.3.4.6.3 Malaysia Vector Database Market by Vertical
- 8.3.4.7 Rest of Asia Pacific Vector Database Market
- 8.3.4.7.1 Rest of Asia Pacific Vector Database Market by Offering
- 8.3.4.7.2 Rest of Asia Pacific Vector Database Market by Technology
- 8.3.4.7.3 Rest of Asia Pacific Vector Database Market by Vertical
- 8.3.4.1 China Vector Database Market
- 8.3.1 Asia Pacific Vector Database Market by Offering
- 8.4 LAMEA Vector Database Market
- 8.4.1 LAMEA Vector Database Market by Offering
- 8.4.1.1 LAMEA Solutions Market by Country
- 8.4.1.2 LAMEA Services Market by Country
- 8.4.2 LAMEA Vector Database Market by Technology
- 8.4.2.1 LAMEA Natural Language Processing Market by Country
- 8.4.2.2 LAMEA Computer Vision Market by Country
- 8.4.2.3 LAMEA Recommendation Systems Market by Country
- 8.4.3 LAMEA Vector Database Market by Vertical
- 8.4.3.1 LAMEA IT & ITeS Market by Country
- 8.4.3.2 LAMEA Healthcare Market by Country
- 8.4.3.3 LAMEA BFSI Market by Country
- 8.4.3.4 LAMEA Retail & E-commerce Market by Country
- 8.4.3.5 LAMEA Media & Entertainment Market by Country
- 8.4.3.6 LAMEA Manufacturing Market by Country
- 8.4.3.7 LAMEA Others Market by Country
- 8.4.4 LAMEA Vector Database Market by Country
- 8.4.4.1 Brazil Vector Database Market
- 8.4.4.1.1 Brazil Vector Database Market by Offering
- 8.4.4.1.2 Brazil Vector Database Market by Technology
- 8.4.4.1.3 Brazil Vector Database Market by Vertical
- 8.4.4.2 Argentina Vector Database Market
- 8.4.4.2.1 Argentina Vector Database Market by Offering
- 8.4.4.2.2 Argentina Vector Database Market by Technology
- 8.4.4.2.3 Argentina Vector Database Market by Vertical
- 8.4.4.3 UAE Vector Database Market
- 8.4.4.3.1 UAE Vector Database Market by Offering
- 8.4.4.3.2 UAE Vector Database Market by Technology
- 8.4.4.3.3 UAE Vector Database Market by Vertical
- 8.4.4.4 Saudi Arabia Vector Database Market
- 8.4.4.4.1 Saudi Arabia Vector Database Market by Offering
- 8.4.4.4.2 Saudi Arabia Vector Database Market by Technology
- 8.4.4.4.3 Saudi Arabia Vector Database Market by Vertical
- 8.4.4.5 South Africa Vector Database Market
- 8.4.4.5.1 South Africa Vector Database Market by Offering
- 8.4.4.5.2 South Africa Vector Database Market by Technology
- 8.4.4.5.3 South Africa Vector Database Market by Vertical
- 8.4.4.6 Nigeria Vector Database Market
- 8.4.4.6.1 Nigeria Vector Database Market by Offering
- 8.4.4.6.2 Nigeria Vector Database Market by Technology
- 8.4.4.6.3 Nigeria Vector Database Market by Vertical
- 8.4.4.7 Rest of LAMEA Vector Database Market
- 8.4.4.7.1 Rest of LAMEA Vector Database Market by Offering
- 8.4.4.7.2 Rest of LAMEA Vector Database Market by Technology
- 8.4.4.7.3 Rest of LAMEA Vector Database Market by Vertical
- 8.4.4.1 Brazil Vector Database Market
- 8.4.1 LAMEA Vector Database Market by Offering
Chapter 9. Company Profiles
- 9.1 Microsoft Corporation
- 9.1.1 Company Overview
- 9.1.2 Financial Analysis
- 9.1.3 Segmental and Regional Analysis
- 9.1.4 Research & Development Expenses
- 9.1.5 Recent strategies and developments:
- 9.1.5.1 Partnerships, Collaborations, and Agreements:
- 9.1.6 SWOT Analysis
- 9.2 Elastic N.V.
- 9.2.1 Company Overview
- 9.2.2 Financial Analysis
- 9.2.3 Regional Analysis
- 9.2.4 Research & Development Expenses
- 9.2.5 SWOT Analysis
- 9.3 Alibaba Cloud (Alibaba Group Holding Limited)
- 9.3.1 Company Overview
- 9.3.2 Financial Analysis
- 9.3.3 Segmental Analysis
- 9.3.4 SWOT Analysis
- 9.4 Amazon Web Services, Inc. (Amazon.com, Inc.)
- 9.4.1 Company Overview
- 9.4.2 Financial Analysis
- 9.4.3 Segmental Analysis
- 9.4.4 SWOT Analysis
- 9.5 Google LLC (Alphabet Inc.)
- 9.5.1 Company Overview
- 9.5.2 Financial Analysis
- 9.5.3 Segmental and Regional Analysis
- 9.5.4 Research & Development Expense
- 9.5.5 SWOT Analysis
- 9.6 DataStax, Inc.
- 9.6.1 Company Overview
- 9.6.2 SWOT Analysis
- 9.7 GSI Technology, Inc.
- 9.7.1 Company Overview
- 9.7.2 Financial Analysis
- 9.7.3 Regional Analysis
- 9.7.4 Research & Development Expenses
- 9.7.5 SWOT Analysis
- 9.8 Clarifai, Inc.
- 9.8.1 Company Overview
- 9.8.2 SWOT Analysis
- 9.9 Pinecone Systems, Inc.
- 9.9.1 Company Overview
- 9.9.2 Recent strategies and developments:
- 9.9.2.1 Partnerships, Collaborations, and Agreements:
- 9.9.3 SWOT Analysis
- 9.10. Rockset, Inc.
- 9.10.1 Company Overview
- 9.10.2 SWOT Analysis
Chapter 10. Winning Imperatives of Vector Database Market
