|
|
市場調査レポート
商品コード
1385042
スマートデマンドレスポンスの世界市場規模、シェア、産業動向分析レポート:タイプ別、用途別、地域別展望と予測、2023年~2030年Global Smart Demand Response Market Size, Share & Industry Trends Analysis Report By Type (Voluntary, and Contractual Mandatory), By Application (Residential, Commercial, and Industrial), By Regional Outlook and Forecast, 2023 - 2030 |
||||||
|
|
|||||||
|
|||||||


| スマートデマンドレスポンスの世界市場規模、シェア、産業動向分析レポート:タイプ別、用途別、地域別展望と予測、2023年~2030年 |
|
出版日: 2023年10月31日
発行: KBV Research
ページ情報: 英文 204 Pages
納期: 即納可能
|

- 全表示
- 概要
- 図表
- 目次
スマートデマンドレスポンス市場規模は、2030年までに796億米ドルに達すると予測され、予測期間中のCAGRは17.1%の市場成長率で上昇する見込みです。
KBV Cardinalマトリックスに掲載された分析によると、オラクル社が同市場におけるトップランナーです。ハネウェル・インターナショナル、シーメンスAG、シュナイダーエレクトリックSEなどの企業は、市場における主要なイノベーターです。例えば、2021年6月、シュナイダーエレクトリックSEは、フランコフォーン・アフリカにマイクログリッドを展開するため、ソーラーX社と提携しました。この提携により、シュナイダーエレクトリックはアフリカでの足跡を拡大することができます。
市場成長要因
産業・商業産業の成長
自動化、人工知能、モノのインターネット(IoT)は、産業部門の製造・生産プロセスを変革してきました。これらの進歩は効率を向上させ、製品開発とカスタマイズの新たな可能性を開くことで、成長を促進しています。世界経済の成長は、製品やサービスに対する消費者の需要の増加につながります。消費者支出の増加に伴い、消費財、自動車、エレクトロニクスなど、こうした需要に対応する産業部門は拡大を経験します。経済成長は産業部門成長の重要な原動力です。産業部門や商業部門の拡大に伴い、政府や規制機関は、DRプログラムへの参加を奨励する政策やインセンティブを導入することが多いです。この支援には、財政的インセンティブ、エネルギー効率目標、参加プロセスの簡素化などが含まれます。産業部門と商業部門の拡大は、市場に実質的かつプラスの影響を与えます。これらの部門が成長し続ければ、市場も成長すると思われます。
エネルギーコストの急上昇
エネルギー・コストが上昇するにつれ、消費者や企業は電気代を削減する方法を見つけることに意欲を燃やしています。電力料金のピーク時にエネルギー消費を調整できるようにすることで、このようなコスト上昇を緩和するソリューションを提供するのが、電力料金プログラムです。参加者は、価格高騰時にエネルギー使用を削減することで、大幅な節約を達成することができます。エネルギーコストの上昇は、消費者や企業がDRプログラムに積極的に参加する経済的インセンティブを生み出しています。多くの電力会社や送電網運営会社は、ピーク需要時間帯にエネルギー使用量を削減した場合、請求額の控除や料金の割引など、金銭的なインセンティブを提供しています。消費者や企業は、DRプログラムに参加することによる環境面や経済面でのメリットについてますます知るようになり、参加者が増えています。市場の拡大は、主に、エネルギーコストの上昇に対応する金銭的インセンティブとコスト削減の機会を提供することに起因しています。
市場抑制要因
分散型エネルギー資源(DERS)の普及拡大
ソーラーパネルや風力タービンのようなDERは、断続的で可変的なエネルギー源であることが多いです。そのため、効果的な需要応答計画やグリッド・バランシングに不可欠な、エネルギーの利用可能性を正確に予測することは困難です。蓄電システムや電気自動車を含むDERは、消費者と送電網の間で双方向のエネルギーの流れを可能にします。この双方向の流れは、需要応答戦略と調整を複雑にする可能性があります。エネルギー貯蔵はDERの柔軟性を高めることができる一方で、エネルギー使用を予測・管理する際に課題をもたらすこともあります。エネルギー貯蔵と需要応答の相互作用には、慎重な計画が必要です。この輻輳は、分散型エネルギー発電と蓄電の追加に対応するグリッドの能力を制限する可能性があります。業界におけるDERの増加に伴い、今後数年間は市場の成長が鈍化すると予想されます。
タイプ別展望
タイプ別に見ると、市場は任意型と契約義務型に細分化されます。2022年の市場では、契約義務型セグメントが顕著な収益シェアを記録しました。契約による強制的なDRは、電力需要の増加に対応するために化石燃料が使用されることが多いピーク時のエネルギー消費を削減するよう参加者に促すことで、環境への影響を低減することができます。契約による強制的なDRプログラムは、通常、送電網の信頼性と安定性が重要な部門や消費者を対象としています。こうしたプログラムは、送電網の課題に効果的に対処できる一方で、コンプライアンスを成功させるためには、プログラム管理者と参加者の間で綿密な計画、コミュニケーション、調整が必要となります。
用途の展望
用途別に見ると、市場は住宅用、商業用、産業用に区分されます。2022年には、住宅分野が最大の収益シェアを占めて市場を独占しました。住宅のエネルギー効率を改善し、二酸化炭素排出量を削減する必要性が高まっています。住宅顧客向けの需要応答(DR)プログラムでは、給湯器、プールポンプ、空調システムなど、家庭の大型電化製品の直接負荷制御が行われます。スマートビルは、エネルギー需要のピーク時に電力網を保護するため、DRプログラムに参加することが期待されています。高コストの時間帯に負荷を減らすことで、電気代が削減され、消費者に有利になると期待されています。
地域別展望
地域別に見ると、市場は北米、欧州、アジア太平洋、LAMEAで分析されます。2022年には、北米地域が市場で最も高い収益シェアを占めていました。電力需要を管理し、ピーク負荷の課題に対処する必要性が高まっています。エネルギー消費量の増加に伴い、電力会社は需要と供給のバランスをとり、送電網への負担を軽減し、潜在的な停電や混乱を回避するための革新的なソリューションを模索しています。カリフォルニア州では、建物が最も高いピーク負荷に寄与すると予測されています。デマンドレスポンス研究センター(DRRC)は、さまざまな応答時間を持つ動的ピーク負荷削減技術の商業用および住宅用用途に焦点を当てています。
目次
第1章 市場範囲と調査手法
- 市場の定義
- 目的
- 市場範囲
- セグメンテーション
- 調査手法
第2章 市場の概要
- 主なハイライト
第3章 市場概要
- イントロダクション
- 概要
- 市場構成とシナリオ
- 概要
- 市場に影響を与える主な要因
- 市場促進要因
- 市場抑制要因
第4章 競合分析- 世界
- KBV Cardinal Matrix
- 最近の業界全体の戦略的展開
- パートナーシップ、コラボレーション、および契約
- 製品の発売と製品の拡大
- 買収と合併
- 主要成功戦略
- 主な戦略
- 主要な戦略的動き
- ポーターファイブフォース分析
第5章 世界のスマートデマンドレスポンス市場:タイプ別
- 世界の任意市場:地域別
- 世界の契約義務市場:地域別
第6章 世界のスマートデマンドレスポンス市場:用途別
- 世界の住宅市場:地域別
- 世界の商業市場:地域別
- 世界の産業市場:地域別
第7章 世界のスマートデマンドレスポンス市場:地域別
- 北米のスマートデマンドレスポンス市場
- 欧州のスマートデマンドレスポンス市場
- アジア太平洋のスマートデマンドレスポンス市場
- ラテンアメリカ・中東・アフリカのスマートデマンドレスポンス市場
第8章 企業プロファイル
- ABB Group
- Eaton Corporation PLC
- Siemens AG
- Schneider Electric SE
- Enel Sp.A
- General Electric Company
- Honeywell International, Inc
- Johnson Controls International PLC
- Oracle Corporation
- Itron, Inc
第9章 市場の成功必須条件
LIST OF TABLES
- TABLE 1 Global Smart Demand Response Market, 2019 - 2022, USD Million
- TABLE 2 Global Smart Demand Response Market, 2023 - 2030, USD Million
- TABLE 3 Partnerships, Collaborations and Agreements- Smart Demand Response Market
- TABLE 4 Product Launches And Product Expansions- Smart Demand Response Market
- TABLE 5 Acquisition and Mergers- Smart Demand Response Market
- TABLE 6 Global Smart Demand Response Market, by Type, 2019 - 2022, USD Million
- TABLE 7 Global Smart Demand Response Market, by Type, 2023 - 2030, USD Million
- TABLE 8 Global Voluntary Market, by Region, 2019 - 2022, USD Million
- TABLE 9 Global Voluntary Market, by Region, 2023 - 2030, USD Million
- TABLE 10 Global Contractual Mandatory Market, by Region, 2019 - 2022, USD Million
- TABLE 11 Global Contractual Mandatory Market, by Region, 2023 - 2030, USD Million
- TABLE 12 Global Smart Demand Response Market, by Application, 2019 - 2022, USD Million
- TABLE 13 Global Smart Demand Response Market, by Application, 2023 - 2030, USD Million
- TABLE 14 Global Residential Market, by Region, 2019 - 2022, USD Million
- TABLE 15 Global Residential Market, by Region, 2023 - 2030, USD Million
- TABLE 16 Global Commercial Market, by Region, 2019 - 2022, USD Million
- TABLE 17 Global Commercial Market, by Region, 2023 - 2030, USD Million
- TABLE 18 Global Industrial Market, by Region, 2019 - 2022, USD Million
- TABLE 19 Global Industrial Market, by Region, 2023 - 2030, USD Million
- TABLE 20 Global Smart Demand Response Market, by Region, 2019 - 2022, USD Million
- TABLE 21 Global Smart Demand Response Market, by Region, 2023 - 2030, USD Million
- TABLE 22 North America Smart Demand Response Market, 2019 - 2022, USD Million
- TABLE 23 North America Smart Demand Response Market, 2023 - 2030, USD Million
- TABLE 24 North America Smart Demand Response Market, by Type, 2019 - 2022, USD Million
- TABLE 25 North America Smart Demand Response Market, by Type, 2023 - 2030, USD Million
- TABLE 26 North America Voluntary Market, by Country, 2019 - 2022, USD Million
- TABLE 27 North America Voluntary Market, by Country, 2023 - 2030, USD Million
- TABLE 28 North America Contractual Mandatory Market, by Country, 2019 - 2022, USD Million
- TABLE 29 North America Contractual Mandatory Market, by Country, 2023 - 2030, USD Million
- TABLE 30 North America Smart Demand Response Market, by Application, 2019 - 2022, USD Million
- TABLE 31 North America Smart Demand Response Market, by Application, 2023 - 2030, USD Million
- TABLE 32 North America Residential Market, by Country, 2019 - 2022, USD Million
- TABLE 33 North America Residential Market, by Country, 2023 - 2030, USD Million
- TABLE 34 North America Commercial Market, by Country, 2019 - 2022, USD Million
- TABLE 35 North America Commercial Market, by Country, 2023 - 2030, USD Million
- TABLE 36 North America Industrial Market, by Country, 2019 - 2022, USD Million
- TABLE 37 North America Industrial Market, by Country, 2023 - 2030, USD Million
- TABLE 38 North America Smart Demand Response Market, by Country, 2019 - 2022, USD Million
- TABLE 39 North America Smart Demand Response Market, by Country, 2023 - 2030, USD Million
- TABLE 40 US Smart Demand Response Market, 2019 - 2022, USD Million
- TABLE 41 US Smart Demand Response Market, 2023 - 2030, USD Million
- TABLE 42 US Smart Demand Response Market, by Type, 2019 - 2022, USD Million
- TABLE 43 US Smart Demand Response Market, by Type, 2023 - 2030, USD Million
- TABLE 44 US Smart Demand Response Market, by Application, 2019 - 2022, USD Million
- TABLE 45 US Smart Demand Response Market, by Application, 2023 - 2030, USD Million
- TABLE 46 Canada Smart Demand Response Market, 2019 - 2022, USD Million
- TABLE 47 Canada Smart Demand Response Market, 2023 - 2030, USD Million
- TABLE 48 Canada Smart Demand Response Market, by Type, 2019 - 2022, USD Million
- TABLE 49 Canada Smart Demand Response Market, by Type, 2023 - 2030, USD Million
- TABLE 50 Canada Smart Demand Response Market, by Application, 2019 - 2022, USD Million
- TABLE 51 Canada Smart Demand Response Market, by Application, 2023 - 2030, USD Million
- TABLE 52 Mexico Smart Demand Response Market, 2019 - 2022, USD Million
- TABLE 53 Mexico Smart Demand Response Market, 2023 - 2030, USD Million
- TABLE 54 Mexico Smart Demand Response Market, by Type, 2019 - 2022, USD Million
- TABLE 55 Mexico Smart Demand Response Market, by Type, 2023 - 2030, USD Million
- TABLE 56 Mexico Smart Demand Response Market, by Application, 2019 - 2022, USD Million
- TABLE 57 Mexico Smart Demand Response Market, by Application, 2023 - 2030, USD Million
- TABLE 58 Rest of North America Smart Demand Response Market, 2019 - 2022, USD Million
- TABLE 59 Rest of North America Smart Demand Response Market, 2023 - 2030, USD Million
- TABLE 60 Rest of North America Smart Demand Response Market, by Type, 2019 - 2022, USD Million
- TABLE 61 Rest of North America Smart Demand Response Market, by Type, 2023 - 2030, USD Million
- TABLE 62 Rest of North America Smart Demand Response Market, by Application, 2019 - 2022, USD Million
- TABLE 63 Rest of North America Smart Demand Response Market, by Application, 2023 - 2030, USD Million
- TABLE 64 Europe Smart Demand Response Market, 2019 - 2022, USD Million
- TABLE 65 Europe Smart Demand Response Market, 2023 - 2030, USD Million
- TABLE 66 Europe Smart Demand Response Market, by Type, 2019 - 2022, USD Million
- TABLE 67 Europe Smart Demand Response Market, by Type, 2023 - 2030, USD Million
- TABLE 68 Europe Voluntary Market, by Country, 2019 - 2022, USD Million
- TABLE 69 Europe Voluntary Market, by Country, 2023 - 2030, USD Million
- TABLE 70 Europe Contractual Mandatory Market, by Country, 2019 - 2022, USD Million
- TABLE 71 Europe Contractual Mandatory Market, by Country, 2023 - 2030, USD Million
- TABLE 72 Europe Smart Demand Response Market, by Application, 2019 - 2022, USD Million
- TABLE 73 Europe Smart Demand Response Market, by Application, 2023 - 2030, USD Million
- TABLE 74 Europe Residential Market, by Country, 2019 - 2022, USD Million
- TABLE 75 Europe Residential Market, by Country, 2023 - 2030, USD Million
- TABLE 76 Europe Commercial Market, by Country, 2019 - 2022, USD Million
- TABLE 77 Europe Commercial Market, by Country, 2023 - 2030, USD Million
- TABLE 78 Europe Industrial Market, by Country, 2019 - 2022, USD Million
- TABLE 79 Europe Industrial Market, by Country, 2023 - 2030, USD Million
- TABLE 80 Europe Smart Demand Response Market, by Country, 2019 - 2022, USD Million
- TABLE 81 Europe Smart Demand Response Market, by Country, 2023 - 2030, USD Million
- TABLE 82 Germany Smart Demand Response Market, 2019 - 2022, USD Million
- TABLE 83 Germany Smart Demand Response Market, 2023 - 2030, USD Million
- TABLE 84 Germany Smart Demand Response Market, by Type, 2019 - 2022, USD Million
- TABLE 85 Germany Smart Demand Response Market, by Type, 2023 - 2030, USD Million
- TABLE 86 Germany Smart Demand Response Market, by Application, 2019 - 2022, USD Million
- TABLE 87 Germany Smart Demand Response Market, by Application, 2023 - 2030, USD Million
- TABLE 88 UK Smart Demand Response Market, 2019 - 2022, USD Million
- TABLE 89 UK Smart Demand Response Market, 2023 - 2030, USD Million
- TABLE 90 UK Smart Demand Response Market, by Type, 2019 - 2022, USD Million
- TABLE 91 UK Smart Demand Response Market, by Type, 2023 - 2030, USD Million
- TABLE 92 UK Smart Demand Response Market, by Application, 2019 - 2022, USD Million
- TABLE 93 UK Smart Demand Response Market, by Application, 2023 - 2030, USD Million
- TABLE 94 France Smart Demand Response Market, 2019 - 2022, USD Million
- TABLE 95 France Smart Demand Response Market, 2023 - 2030, USD Million
- TABLE 96 France Smart Demand Response Market, by Type, 2019 - 2022, USD Million
- TABLE 97 France Smart Demand Response Market, by Type, 2023 - 2030, USD Million
- TABLE 98 France Smart Demand Response Market, by Application, 2019 - 2022, USD Million
- TABLE 99 France Smart Demand Response Market, by Application, 2023 - 2030, USD Million
- TABLE 100 Russia Smart Demand Response Market, 2019 - 2022, USD Million
- TABLE 101 Russia Smart Demand Response Market, 2023 - 2030, USD Million
- TABLE 102 Russia Smart Demand Response Market, by Type, 2019 - 2022, USD Million
- TABLE 103 Russia Smart Demand Response Market, by Type, 2023 - 2030, USD Million
- TABLE 104 Russia Smart Demand Response Market, by Application, 2019 - 2022, USD Million
- TABLE 105 Russia Smart Demand Response Market, by Application, 2023 - 2030, USD Million
- TABLE 106 Spain Smart Demand Response Market, 2019 - 2022, USD Million
- TABLE 107 Spain Smart Demand Response Market, 2023 - 2030, USD Million
- TABLE 108 Spain Smart Demand Response Market, by Type, 2019 - 2022, USD Million
- TABLE 109 Spain Smart Demand Response Market, by Type, 2023 - 2030, USD Million
- TABLE 110 Spain Smart Demand Response Market, by Application, 2019 - 2022, USD Million
- TABLE 111 Spain Smart Demand Response Market, by Application, 2023 - 2030, USD Million
- TABLE 112 Italy Smart Demand Response Market, 2019 - 2022, USD Million
- TABLE 113 Italy Smart Demand Response Market, 2023 - 2030, USD Million
- TABLE 114 Italy Smart Demand Response Market, by Type, 2019 - 2022, USD Million
- TABLE 115 Italy Smart Demand Response Market, by Type, 2023 - 2030, USD Million
- TABLE 116 Italy Smart Demand Response Market, by Application, 2019 - 2022, USD Million
- TABLE 117 Italy Smart Demand Response Market, by Application, 2023 - 2030, USD Million
- TABLE 118 Rest of Europe Smart Demand Response Market, 2019 - 2022, USD Million
- TABLE 119 Rest of Europe Smart Demand Response Market, 2023 - 2030, USD Million
- TABLE 120 Rest of Europe Smart Demand Response Market, by Type, 2019 - 2022, USD Million
- TABLE 121 Rest of Europe Smart Demand Response Market, by Type, 2023 - 2030, USD Million
- TABLE 122 Rest of Europe Smart Demand Response Market, by Application, 2019 - 2022, USD Million
- TABLE 123 Rest of Europe Smart Demand Response Market, by Application, 2023 - 2030, USD Million
- TABLE 124 Asia Pacific Smart Demand Response Market, 2019 - 2022, USD Million
- TABLE 125 Asia Pacific Smart Demand Response Market, 2023 - 2030, USD Million
- TABLE 126 Asia Pacific Smart Demand Response Market, by Type, 2019 - 2022, USD Million
- TABLE 127 Asia Pacific Smart Demand Response Market, by Type, 2023 - 2030, USD Million
- TABLE 128 Asia Pacific Voluntary Market, by Country, 2019 - 2022, USD Million
- TABLE 129 Asia Pacific Voluntary Market, by Country, 2023 - 2030, USD Million
- TABLE 130 Asia Pacific Contractual Mandatory Market, by Country, 2019 - 2022, USD Million
- TABLE 131 Asia Pacific Contractual Mandatory Market, by Country, 2023 - 2030, USD Million
- TABLE 132 Asia Pacific Smart Demand Response Market, by Application, 2019 - 2022, USD Million
- TABLE 133 Asia Pacific Smart Demand Response Market, by Application, 2023 - 2030, USD Million
- TABLE 134 Asia Pacific Residential Market, by Country, 2019 - 2022, USD Million
- TABLE 135 Asia Pacific Residential Market, by Country, 2023 - 2030, USD Million
- TABLE 136 Asia Pacific Commercial Market, by Country, 2019 - 2022, USD Million
- TABLE 137 Asia Pacific Commercial Market, by Country, 2023 - 2030, USD Million
- TABLE 138 Asia Pacific Industrial Market, by Country, 2019 - 2022, USD Million
- TABLE 139 Asia Pacific Industrial Market, by Country, 2023 - 2030, USD Million
- TABLE 140 Asia Pacific Smart Demand Response Market, by Country, 2019 - 2022, USD Million
- TABLE 141 Asia Pacific Smart Demand Response Market, by Country, 2023 - 2030, USD Million
- TABLE 142 China Smart Demand Response Market, 2019 - 2022, USD Million
- TABLE 143 China Smart Demand Response Market, 2023 - 2030, USD Million
- TABLE 144 China Smart Demand Response Market, by Type, 2019 - 2022, USD Million
- TABLE 145 China Smart Demand Response Market, by Type, 2023 - 2030, USD Million
- TABLE 146 China Smart Demand Response Market, by Application, 2019 - 2022, USD Million
- TABLE 147 China Smart Demand Response Market, by Application, 2023 - 2030, USD Million
- TABLE 148 Japan Smart Demand Response Market, 2019 - 2022, USD Million
- TABLE 149 Japan Smart Demand Response Market, 2023 - 2030, USD Million
- TABLE 150 Japan Smart Demand Response Market, by Type, 2019 - 2022, USD Million
- TABLE 151 Japan Smart Demand Response Market, by Type, 2023 - 2030, USD Million
- TABLE 152 Japan Smart Demand Response Market, by Application, 2019 - 2022, USD Million
- TABLE 153 Japan Smart Demand Response Market, by Application, 2023 - 2030, USD Million
- TABLE 154 India Smart Demand Response Market, 2019 - 2022, USD Million
- TABLE 155 India Smart Demand Response Market, 2023 - 2030, USD Million
- TABLE 156 India Smart Demand Response Market, by Type, 2019 - 2022, USD Million
- TABLE 157 India Smart Demand Response Market, by Type, 2023 - 2030, USD Million
- TABLE 158 India Smart Demand Response Market, by Application, 2019 - 2022, USD Million
- TABLE 159 India Smart Demand Response Market, by Application, 2023 - 2030, USD Million
- TABLE 160 South Korea Smart Demand Response Market, 2019 - 2022, USD Million
- TABLE 161 South Korea Smart Demand Response Market, 2023 - 2030, USD Million
- TABLE 162 South Korea Smart Demand Response Market, by Type, 2019 - 2022, USD Million
- TABLE 163 South Korea Smart Demand Response Market, by Type, 2023 - 2030, USD Million
- TABLE 164 South Korea Smart Demand Response Market, by Application, 2019 - 2022, USD Million
- TABLE 165 South Korea Smart Demand Response Market, by Application, 2023 - 2030, USD Million
- TABLE 166 Singapore Smart Demand Response Market, 2019 - 2022, USD Million
- TABLE 167 Singapore Smart Demand Response Market, 2023 - 2030, USD Million
- TABLE 168 Singapore Smart Demand Response Market, by Type, 2019 - 2022, USD Million
- TABLE 169 Singapore Smart Demand Response Market, by Type, 2023 - 2030, USD Million
- TABLE 170 Singapore Smart Demand Response Market, by Application, 2019 - 2022, USD Million
- TABLE 171 Singapore Smart Demand Response Market, by Application, 2023 - 2030, USD Million
- TABLE 172 Malaysia Smart Demand Response Market, 2019 - 2022, USD Million
- TABLE 173 Malaysia Smart Demand Response Market, 2023 - 2030, USD Million
- TABLE 174 Malaysia Smart Demand Response Market, by Type, 2019 - 2022, USD Million
- TABLE 175 Malaysia Smart Demand Response Market, by Type, 2023 - 2030, USD Million
- TABLE 176 Malaysia Smart Demand Response Market, by Application, 2019 - 2022, USD Million
- TABLE 177 Malaysia Smart Demand Response Market, by Application, 2023 - 2030, USD Million
- TABLE 178 Rest of Asia Pacific Smart Demand Response Market, 2019 - 2022, USD Million
- TABLE 179 Rest of Asia Pacific Smart Demand Response Market, 2023 - 2030, USD Million
- TABLE 180 Rest of Asia Pacific Smart Demand Response Market, by Type, 2019 - 2022, USD Million
- TABLE 181 Rest of Asia Pacific Smart Demand Response Market, by Type, 2023 - 2030, USD Million
- TABLE 182 Rest of Asia Pacific Smart Demand Response Market, by Application, 2019 - 2022, USD Million
- TABLE 183 Rest of Asia Pacific Smart Demand Response Market, by Application, 2023 - 2030, USD Million
- TABLE 184 LAMEA Smart Demand Response Market, 2019 - 2022, USD Million
- TABLE 185 LAMEA Smart Demand Response Market, 2023 - 2030, USD Million
- TABLE 186 LAMEA Smart Demand Response Market, by Type, 2019 - 2022, USD Million
- TABLE 187 LAMEA Smart Demand Response Market, by Type, 2023 - 2030, USD Million
- TABLE 188 LAMEA Voluntary Market, by Country, 2019 - 2022, USD Million
- TABLE 189 LAMEA Voluntary Market, by Country, 2023 - 2030, USD Million
- TABLE 190 LAMEA Contractual Mandatory Market, by Country, 2019 - 2022, USD Million
- TABLE 191 LAMEA Contractual Mandatory Market, by Country, 2023 - 2030, USD Million
- TABLE 192 LAMEA Smart Demand Response Market, by Application, 2019 - 2022, USD Million
- TABLE 193 LAMEA Smart Demand Response Market, by Application, 2023 - 2030, USD Million
- TABLE 194 LAMEA Residential Market, by Country, 2019 - 2022, USD Million
- TABLE 195 LAMEA Residential Market, by Country, 2023 - 2030, USD Million
- TABLE 196 LAMEA Commercial Market, by Country, 2019 - 2022, USD Million
- TABLE 197 LAMEA Commercial Market, by Country, 2023 - 2030, USD Million
- TABLE 198 LAMEA Industrial Market, by Country, 2019 - 2022, USD Million
- TABLE 199 LAMEA Industrial Market, by Country, 2023 - 2030, USD Million
- TABLE 200 LAMEA Smart Demand Response Market, by Country, 2019 - 2022, USD Million
- TABLE 201 LAMEA Smart Demand Response Market, by Country, 2023 - 2030, USD Million
- TABLE 202 Brazil Smart Demand Response Market, 2019 - 2022, USD Million
- TABLE 203 Brazil Smart Demand Response Market, 2023 - 2030, USD Million
- TABLE 204 Brazil Smart Demand Response Market, by Type, 2019 - 2022, USD Million
- TABLE 205 Brazil Smart Demand Response Market, by Type, 2023 - 2030, USD Million
- TABLE 206 Brazil Smart Demand Response Market, by Application, 2019 - 2022, USD Million
- TABLE 207 Brazil Smart Demand Response Market, by Application, 2023 - 2030, USD Million
- TABLE 208 Argentina Smart Demand Response Market, 2019 - 2022, USD Million
- TABLE 209 Argentina Smart Demand Response Market, 2023 - 2030, USD Million
- TABLE 210 Argentina Smart Demand Response Market, by Type, 2019 - 2022, USD Million
- TABLE 211 Argentina Smart Demand Response Market, by Type, 2023 - 2030, USD Million
- TABLE 212 Argentina Smart Demand Response Market, by Application, 2019 - 2022, USD Million
- TABLE 213 Argentina Smart Demand Response Market, by Application, 2023 - 2030, USD Million
- TABLE 214 UAE Smart Demand Response Market, 2019 - 2022, USD Million
- TABLE 215 UAE Smart Demand Response Market, 2023 - 2030, USD Million
- TABLE 216 UAE Smart Demand Response Market, by Type, 2019 - 2022, USD Million
- TABLE 217 UAE Smart Demand Response Market, by Type, 2023 - 2030, USD Million
- TABLE 218 UAE Smart Demand Response Market, by Application, 2019 - 2022, USD Million
- TABLE 219 UAE Smart Demand Response Market, by Application, 2023 - 2030, USD Million
- TABLE 220 Saudi Arabia Smart Demand Response Market, 2019 - 2022, USD Million
- TABLE 221 Saudi Arabia Smart Demand Response Market, 2023 - 2030, USD Million
- TABLE 222 Saudi Arabia Smart Demand Response Market, by Type, 2019 - 2022, USD Million
- TABLE 223 Saudi Arabia Smart Demand Response Market, by Type, 2023 - 2030, USD Million
- TABLE 224 Saudi Arabia Smart Demand Response Market, by Application, 2019 - 2022, USD Million
- TABLE 225 Saudi Arabia Smart Demand Response Market, by Application, 2023 - 2030, USD Million
- TABLE 226 South Africa Smart Demand Response Market, 2019 - 2022, USD Million
- TABLE 227 South Africa Smart Demand Response Market, 2023 - 2030, USD Million
- TABLE 228 South Africa Smart Demand Response Market, by Type, 2019 - 2022, USD Million
- TABLE 229 South Africa Smart Demand Response Market, by Type, 2023 - 2030, USD Million
- TABLE 230 South Africa Smart Demand Response Market, by Application, 2019 - 2022, USD Million
- TABLE 231 South Africa Smart Demand Response Market, by Application, 2023 - 2030, USD Million
- TABLE 232 Nigeria Smart Demand Response Market, 2019 - 2022, USD Million
- TABLE 233 Nigeria Smart Demand Response Market, 2023 - 2030, USD Million
- TABLE 234 Nigeria Smart Demand Response Market, by Type, 2019 - 2022, USD Million
- TABLE 235 Nigeria Smart Demand Response Market, by Type, 2023 - 2030, USD Million
- TABLE 236 Nigeria Smart Demand Response Market, by Application, 2019 - 2022, USD Million
- TABLE 237 Nigeria Smart Demand Response Market, by Application, 2023 - 2030, USD Million
- TABLE 238 Rest of LAMEA Smart Demand Response Market, 2019 - 2022, USD Million
- TABLE 239 Rest of LAMEA Smart Demand Response Market, 2023 - 2030, USD Million
- TABLE 240 Rest of LAMEA Smart Demand Response Market, by Type, 2019 - 2022, USD Million
- TABLE 241 Rest of LAMEA Smart Demand Response Market, by Type, 2023 - 2030, USD Million
- TABLE 242 Rest of LAMEA Smart Demand Response Market, by Application, 2019 - 2022, USD Million
- TABLE 243 Rest of LAMEA Smart Demand Response Market, by Application, 2023 - 2030, USD Million
- TABLE 244 Key Information - ABB Group
- TABLE 245 Key Information - Eaton Corporation PLC
- TABLE 246 Key Information - Siemens AG
- TABLE 247 Key Information - Schneider Electric SE
- TABLE 248 Key Information - Enel S.p.A
- TABLE 249 Key Information - General Electric Company
- TABLE 250 Key Information - Honeywell International, Inc.
- TABLE 251 Key Information - Johnson Controls International PLC
- TABLE 252 Key Information - Oracle Corporation
- TABLE 253 Key Information - Itron, Inc.
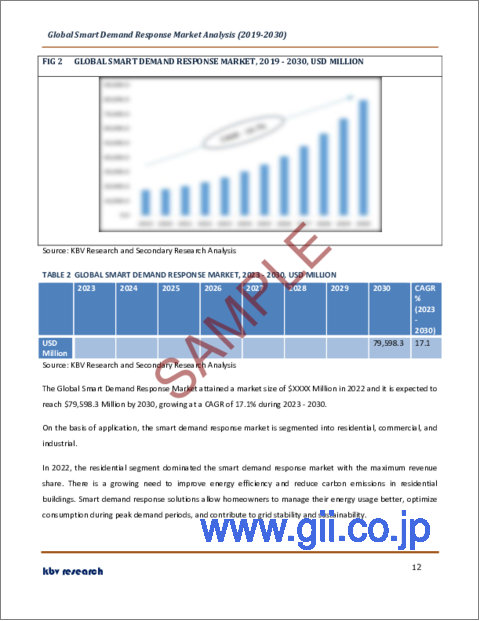
The Global Smart Demand Response Market size is expected to reach $79.6 billion by 2030, rising at a market growth of 17.1% CAGR during the forecast period.
A robust economy, characterized by rising GDP, increasing consumer spending, and low unemployment, creates favorable conditions for commercial expansion. Consequently, the commercial segment captured $5.2 Billion revenue in the market in 2020. As individuals and businesses experience improved financial stability, they are more willing to invest, expand, and consume goods and services. Adequate infrastructure, including transportation, energy, and communication networks, is essential for businesses to expand. Regions with well-developed infrastructure can attract commercial investment and growth. High-speed internet and digital connectivity are also crucial in the modern business environment.
The major strategies followed by the market participants are Partnerships as the key developmental strategy to keep pace with the changing demands of end users. For instance, In April, 2023, Enel S.p.A signed a partnership with Phoenix Energy Technologies. The partnership would allow Enel to serve its customers with complex energy systems. Moreover, In February, 2023, Siemens AG signed a partnership with EnergyHub, to provide utilities with next-generation DER management solutions. The two companies would achieve the aim by combining each other's network expertise and grid-edge capabilities.
Based on the Analysis presented in the KBV Cardinal matrix; Oracle Corporation is the forerunner in the Market. Companies such as Honeywell International, Inc., Siemens AG, Schneider Electric SE are some of the key innovators in Market. For Instance, In June, 2021, Schneider Electric SE came into partnership with SolarX, to deploy microgrids in Francophone Africa. The partnership would enable Schneider Electric to expand its footprint in Africa.
Market Growth Factors
Growing industrial and commercial industry
Automation, artificial intelligence, and the Internet of Things (IoT) have transformed manufacturing and production processes in the industrial sector. These advancements improve efficiency and open up new possibilities for product development and customization, thereby driving growth. A growing global economy leads to increased consumer demand for products and services. As consumer spending rises, industrial sectors catering to these demands, such as consumer goods, automotive, and electronics, experience expansion. Economic growth is a significant driver for industrial sector growth. As the industrial and commercial sectors expand, governments and regulatory bodies often introduce policies and incentives to encourage participation in DR programs. This support can include financial incentives, energy efficiency targets, and simplified participation processes. Expanding the industrial and commercial sectors substantially and positively impacts the market. As these sectors continue to grow, the market will witness growth.
Rapid increase in energy costs
As energy costs rise, consumers and businesses are motivated to find ways to reduce their electricity bills. Its programs offer a solution to mitigate these rising costs by enabling them to adjust their energy consumption during peak pricing periods. Participants can achieve significant savings by reducing energy use when prices are high. Rising energy costs have created a financial incentive for consumers and businesses to participate in DR programs actively. Many utilities and grid operators offer financial incentives, such as bill credits or reduced rates, to those who curtail their energy usage during peak demand hours. Consumers and businesses are increasingly informed about the environmental and economic benefits of participating in DR programs, leading to greater participation. The expansion of the market can be attributed mainly to the financial incentives and cost-saving opportunities it provides in response to rising energy costs.
Market Restraining Factors
Increasing Adoption of Distributed Energy Resources (DERS)
DERs, such as solar panels and wind turbines, are often intermittent and variable energy sources. This makes it challenging to predict energy availability accurately, which is critical for effective demand response planning and grid balancing. DERs, including energy storage systems and electric vehicles, allow two-way energy flow between consumers and the grid. This bi-directional flow can complicate demand response strategies and coordination. While energy storage can enhance the flexibility of DERs, it can also pose challenges when predicting and managing energy use. The interaction between energy storage and demand response needs careful planning. This congestion can limit the grid's ability to accommodate additional distributed energy generation and storage. With the growing DERs in the industry, it is expected to decline the market growth in the coming years.
Type Outlook
Based on type, the market is fragmented into voluntary and contractual mandatory. The contractual mandatory segment recorded a remarkable revenue share in the market in 2022. Contractual mandatory DR can reduce environmental impact by encouraging participants to reduce their energy consumption during peak periods when fossil fuels are often used to meet increased electricity demand. Contractual mandatory its programs typically target sectors or consumers where grid reliability and stability are critical. While these programs can effectively address grid challenges, they require careful planning, communication, and coordination between program administrators and participants to ensure successful compliance.
Application Outlook
On the basis of application, the market is segmented into residential, commercial, and industrial. In 2022, the residential segment dominated the market with the maximum revenue share. There is a growing need to improve energy efficiency and reduce carbon emissions in residential buildings. For residential customers, demand response (DR) programs entail direct load control of the larger appliances at home, which includes water heaters, pool pumps, and air conditioning systems. Smart buildings are expected to participate in DR programs to protect the electrical grid during high peak energy demand. Reducing loads during high-cost periods is expected to reduce electricity bills, proving advantageous to consumers.
Regional Outlook
Region-wise, the market is analysed across North America, Europe, Asia Pacific, and LAMEA. In 2022, the North America region held the highest revenue share in the market. There is a growing need to manage electricity demand and address peak load challenges. As energy consumption rises, utilities seek innovative solutions to balance supply and demand, reduce strain on the grid, and avoid potential blackouts or disruptions. In California, buildings are foreseen to contribute to the highest peak load. The Demand Response Research Center (DRRC) focuses on commercial and residential applications of technologies for dynamic peak load reduction with different response durations.
The market research report covers the analysis of key stake holders of the market. Key companies profiled in the report include ABB Group, Eaton Corporation PLC, Enel S.p.A, General Electric Company, Honeywell International, Inc., Johnson Controls International PLC, Oracle Corporation, Siemens AG, Schneider Electric SE and Itron, Inc.
Recent Strategies Deployed in Smart Demand Response Market
Partnerships, Collaborations & Agreements:
Apr-2023: Enel S.p.A signed a partnership with Phoenix Energy Technologies, an energy management systems provider, to provide revenue-generating demand response (DR) opportunities for different businesses. The partnership would allow Enel to serve its customers with complex energy systems.
Mar-2023: Enel S.p.A came into partnership with Tata Power Delhi Distribution Limited, a power distribution services provider based in India, to provide solutions for the digital transformation of power distribution grids. The partnership would support India's digitization plans.
Feb-2023: Siemens AG signed a partnership with EnergyHub, a distributed energy resources (DERs) management solutions provider, to provide utilities with next-generation DER management solutions. The two companies would achieve the aim by combining each other's network expertise and grid-edge capabilities.
Oct-2022: Honeywell International, Inc. came into partnership with Microsoft, an American technology company, to provide a complete unified solution for communication and collaboration. The partnership would provide mobile workers with solutions for effective operational coordination.
Sep-2022: Itron, Inc. came into partnership with SmartThings, a Samsung subsidiary, to integrate its industrial IoT (IIoT) network solution with SmartThings' services and solutions. As a result of the partnership, the customers of the two companies would be able to gain deeper insights about their energy use.
Jul-2022: ABB Group partnered with Red Hat, an American software company, to deliver cloud-based industrial operation solutions. The partnership aids the customers of ABB in their operational performance optimization.
Jun-2022: Eaton Corporation PLC partnered with Microsoft, an American technology company, to accelerate applications of its Energy Aware uninterruptible power system (UPS) technology. The partnership would enable the data centers to improve their environmental impact profile.
Mar-2022: Itron, Inc. signed a partnership with Emerson, a technology company, to offer reliable thermostats. The partnership expands Itron's customer base.
Dec-2021: ABB Group came into partnership with Indore Smart City Development Limited, a city development solutions provider, to establish digital Compact Secondary Substations (CSS). The partnership would ensure a regular supply of electricity throughout the city of Surat.
Oct-2021: General Electric Company came into partnership with Nest Renew from Google, a service used for compatible Nest thermostats. The partnership would enable the joint customers of the two companies to reduce their carbon footprint.
Jul-2021: Enel S.p.A announced a partnership with Virtual Peaker, an energy management services provider, to offer smart home energy solutions to utilities in the US. The partnership would fulfill the intelligent energy needs of the North American market.
Jun-2021: Schneider Electric SE came into partnership with SolarX, an Energy infrastructure solutions provider, to deploy microgrids in Francophone Africa. The partnership would enable Schneider Electric to expand its footprint in Africa.
Mergers & Acquisition:
Jul-2023: Johnson Controls International PLC took over FM: Systems, a workplace management and Internet of Things (IoT) solutions provider. The acquisition enables Johnson Controls to strengthen its OpenBlue, a building automation services platform by adding to it FM: Systems' predictive workplace management platform.
Jun-2023: ABB Group announced the acquisition of Eve Systems GmbH, a German smart home products provider. The acquisition aids ABB in providing its customers with smart and energy-efficient homes and buildings.
May-2022: Schneider Electric SE announced the acquisition of Autogrid, an AI-based optimization solutions provider for distributed energy resources (DER). The acquisition strengthens Schneider Electric's capability to offer its customers leading technologies for carbon footprint reduction.
Apr-2022: Johnson Controls International PLC acquired Security Enhancement Systems LLC, a keyless access control solutions provider. The acquisition would allow Johnson Controls to provide keyless access control and data analytics for specialized infrastructure.
Jan-2022: Oracle took over Federos, a leading provider of cloud-enabled, AI-optimized network assurance, analytics, and automation software. With this acquisition, Oracle focused on empowering service providers with AI-optimized service and network analytics, assurance, and automated orchestration.
May-2021: Siemens AG signed an agreement to acquire Padam Mobility, an AI-powered platform provider for paratransit services. The acquisition strengthens Siemens Mobility's intelligent infrastructure portfolio.
Mar-2021: Siemens AG took over C&S Electric, an electrical equipment manufacturer based in India. The acquisition strengthens Siemens' overall range of offerings.
Product Launches and Product Expansions:
Apr-2023: Enel S.p.A announced the launch of Enel Box, a solution that facilitates substation building with eco-friendly materials and fewer components. The solutions facilitate reduced carbon footprint and are easily integrated with urban, rural, and historic areas.
Jan-2023: ABB Group released SSC600 SW, a virtualized protection and control solution including Smart Substation Control. The SSC600 SW offers flexibility in hardware selection and provides protection and control functionality same as ABB's turnkey solution. The product can handle tasks of 30 protection relays.
Sep-2022: Honeywell International, Inc. unveiled Data Center Suite, a suite of outcome-based software solutions used to facilitate worker productivity. The products in the suite include Data Center Manager, Portfolio View, and Honeywell Forge Digitized Maintenance.
Scope of the Study
Market Segments covered in the Report:
By Type
- Voluntary
- Contractual Mandatory
By Application
- Residential
- Commercial
- Industrial
By Geography
- North America
- US
- Canada
- Mexico
- Rest of North America
- Europe
- Germany
- UK
- France
- Russia
- Spain
- Italy
- Rest of Europe
- Asia Pacific
- China
- Japan
- India
- South Korea
- Singapore
- Malaysia
- Rest of Asia Pacific
- LAMEA
- Brazil
- Argentina
- UAE
- Saudi Arabia
- South Africa
- Nigeria
- Rest of LAMEA
Companies Profiled
- ABB Group
- Eaton Corporation PLC
- Enel S.p.A
- General Electric Company
- Honeywell International, Inc.
- Johnson Controls International PLC
- Oracle Corporation
- Siemens AG
- Schneider Electric SE
- Itron, Inc.
Unique Offerings from KBV Research
- Exhaustive coverage
- Highest number of market tables and figures
- Subscription based model available
- Guaranteed best price
- Assured post sales research support with 10% customization free
Table of Contents
Chapter 1. Market Scope & Methodology
- 1.1 Market Definition
- 1.2 Objectives
- 1.3 Market Scope
- 1.4 Segmentation
- 1.4.1 Global Smart Demand Response Market, by Type
- 1.4.2 Global Smart Demand Response Market, by Application
- 1.4.3 Global Smart Demand Response Market, by Geography
- 1.5 Methodology for the research
Chapter 2. Market At a Glance
- 2.1 Key Highlights
Chapter 3. Market Overview
- 3.1 Introduction
- 3.1.1 Overview
- 3.1.1.1 Market Composition and Scenario
- 3.1.1 Overview
- 3.2 Key Factors Impacting the Market
- 3.2.1 Market Drivers
- 3.2.2 Market Restraints
Chapter 4. Competition Analysis - Global
- 4.1 KBV Cardinal Matrix
- 4.2 Recent Industry Wide Strategic Developments
- 4.2.1 Partnerships, Collaborations and Agreements
- 4.2.2 Product Launches and Product Expansions
- 4.2.3 Acquisition and Mergers
- 4.3 Top Winning Strategies
- 4.3.1 Key Leading Strategies: Percentage Distribution (2019-2023)
- 4.3.2 Key Strategic Move: (Partnerships, Collaborations & Agreements: 2019, Oct - 2023, Apr) Leading Players
- 4.4 Porter Five Forces Analysis
Chapter 5. Global Smart Demand Response Market, by Type
- 5.1 Global Voluntary Market, by Region
- 5.2 Global Contractual Mandatory Market, by Region
Chapter 6. Global Smart Demand Response Market, by Application
- 6.1 Global Residential Market, by Region
- 6.2 Global Commercial Market, by Region
- 6.3 Global Industrial Market, by Region
Chapter 7. Global Smart Demand Response Market, by Region
- 7.1 North America Smart Demand Response Market
- 7.1.1 North America Smart Demand Response Market, by Type
- 7.1.1.1 North America Voluntary Market, by Country
- 7.1.1.2 North America Contractual Mandatory Market, by Country
- 7.1.2 North America Smart Demand Response Market, by Application
- 7.1.2.1 North America Residential Market, by Country
- 7.1.2.2 North America Commercial Market, by Country
- 7.1.2.3 North America Industrial Market, by Country
- 7.1.3 North America Smart Demand Response Market, by Country
- 7.1.3.1 US Smart Demand Response Market
- 7.1.3.1.1 US Smart Demand Response Market, by Type
- 7.1.3.1.2 US Smart Demand Response Market, by Application
- 7.1.3.2 Canada Smart Demand Response Market
- 7.1.3.2.1 Canada Smart Demand Response Market, by Type
- 7.1.3.2.2 Canada Smart Demand Response Market, by Application
- 7.1.3.3 Mexico Smart Demand Response Market
- 7.1.3.3.1 Mexico Smart Demand Response Market, by Type
- 7.1.3.3.2 Mexico Smart Demand Response Market, by Application
- 7.1.3.4 Rest of North America Smart Demand Response Market
- 7.1.3.4.1 Rest of North America Smart Demand Response Market, by Type
- 7.1.3.4.2 Rest of North America Smart Demand Response Market, by Application
- 7.1.3.1 US Smart Demand Response Market
- 7.1.1 North America Smart Demand Response Market, by Type
- 7.2 Europe Smart Demand Response Market
- 7.2.1 Europe Smart Demand Response Market, by Type
- 7.2.1.1 Europe Voluntary Market, by Country
- 7.2.1.2 Europe Contractual Mandatory Market, by Country
- 7.2.2 Europe Smart Demand Response Market, by Application
- 7.2.2.1 Europe Residential Market, by Country
- 7.2.2.2 Europe Commercial Market, by Country
- 7.2.2.3 Europe Industrial Market, by Country
- 7.2.3 Europe Smart Demand Response Market, by Country
- 7.2.3.1 Germany Smart Demand Response Market
- 7.2.3.1.1 Germany Smart Demand Response Market, by Type
- 7.2.3.1.2 Germany Smart Demand Response Market, by Application
- 7.2.3.2 UK Smart Demand Response Market
- 7.2.3.2.1 UK Smart Demand Response Market, by Type
- 7.2.3.2.2 UK Smart Demand Response Market, by Application
- 7.2.3.3 France Smart Demand Response Market
- 7.2.3.3.1 France Smart Demand Response Market, by Type
- 7.2.3.3.2 France Smart Demand Response Market, by Application
- 7.2.3.4 Russia Smart Demand Response Market
- 7.2.3.4.1 Russia Smart Demand Response Market, by Type
- 7.2.3.4.2 Russia Smart Demand Response Market, by Application
- 7.2.3.5 Spain Smart Demand Response Market
- 7.2.3.5.1 Spain Smart Demand Response Market, by Type
- 7.2.3.5.2 Spain Smart Demand Response Market, by Application
- 7.2.3.6 Italy Smart Demand Response Market
- 7.2.3.6.1 Italy Smart Demand Response Market, by Type
- 7.2.3.6.2 Italy Smart Demand Response Market, by Application
- 7.2.3.7 Rest of Europe Smart Demand Response Market
- 7.2.3.7.1 Rest of Europe Smart Demand Response Market, by Type
- 7.2.3.7.2 Rest of Europe Smart Demand Response Market, by Application
- 7.2.3.1 Germany Smart Demand Response Market
- 7.2.1 Europe Smart Demand Response Market, by Type
- 7.3 Asia Pacific Smart Demand Response Market
- 7.3.1 Asia Pacific Smart Demand Response Market, by Type
- 7.3.1.1 Asia Pacific Voluntary Market, by Country
- 7.3.1.2 Asia Pacific Contractual Mandatory Market, by Country
- 7.3.2 Asia Pacific Smart Demand Response Market, by Application
- 7.3.2.1 Asia Pacific Residential Market, by Country
- 7.3.2.2 Asia Pacific Commercial Market, by Country
- 7.3.2.3 Asia Pacific Industrial Market, by Country
- 7.3.3 Asia Pacific Smart Demand Response Market, by Country
- 7.3.3.1 China Smart Demand Response Market
- 7.3.3.1.1 China Smart Demand Response Market, by Type
- 7.3.3.1.2 China Smart Demand Response Market, by Application
- 7.3.3.2 Japan Smart Demand Response Market
- 7.3.3.2.1 Japan Smart Demand Response Market, by Type
- 7.3.3.2.2 Japan Smart Demand Response Market, by Application
- 7.3.3.3 India Smart Demand Response Market
- 7.3.3.3.1 India Smart Demand Response Market, by Type
- 7.3.3.3.2 India Smart Demand Response Market, by Application
- 7.3.3.4 South Korea Smart Demand Response Market
- 7.3.3.4.1 South Korea Smart Demand Response Market, by Type
- 7.3.3.4.2 South Korea Smart Demand Response Market, by Application
- 7.3.3.5 Singapore Smart Demand Response Market
- 7.3.3.5.1 Singapore Smart Demand Response Market, by Type
- 7.3.3.5.2 Singapore Smart Demand Response Market, by Application
- 7.3.3.6 Malaysia Smart Demand Response Market
- 7.3.3.6.1 Malaysia Smart Demand Response Market, by Type
- 7.3.3.6.2 Malaysia Smart Demand Response Market, by Application
- 7.3.3.7 Rest of Asia Pacific Smart Demand Response Market
- 7.3.3.7.1 Rest of Asia Pacific Smart Demand Response Market, by Type
- 7.3.3.7.2 Rest of Asia Pacific Smart Demand Response Market, by Application
- 7.3.3.1 China Smart Demand Response Market
- 7.3.1 Asia Pacific Smart Demand Response Market, by Type
- 7.4 LAMEA Smart Demand Response Market
- 7.4.1 LAMEA Smart Demand Response Market, by Type
- 7.4.1.1 LAMEA Voluntary Market, by Country
- 7.4.1.2 LAMEA Contractual Mandatory Market, by Country
- 7.4.2 LAMEA Smart Demand Response Market, by Application
- 7.4.2.1 LAMEA Residential Market, by Country
- 7.4.2.2 LAMEA Commercial Market, by Country
- 7.4.2.3 LAMEA Industrial Market, by Country
- 7.4.3 LAMEA Smart Demand Response Market, by Country
- 7.4.3.1 Brazil Smart Demand Response Market
- 7.4.3.1.1 Brazil Smart Demand Response Market, by Type
- 7.4.3.1.2 Brazil Smart Demand Response Market, by Application
- 7.4.3.2 Argentina Smart Demand Response Market
- 7.4.3.2.1 Argentina Smart Demand Response Market, by Type
- 7.4.3.2.2 Argentina Smart Demand Response Market, by Application
- 7.4.3.3 UAE Smart Demand Response Market
- 7.4.3.3.1 UAE Smart Demand Response Market, by Type
- 7.4.3.3.2 UAE Smart Demand Response Market, by Application
- 7.4.3.4 Saudi Arabia Smart Demand Response Market
- 7.4.3.4.1 Saudi Arabia Smart Demand Response Market, by Type
- 7.4.3.4.2 Saudi Arabia Smart Demand Response Market, by Application
- 7.4.3.5 South Africa Smart Demand Response Market
- 7.4.3.5.1 South Africa Smart Demand Response Market, by Type
- 7.4.3.5.2 South Africa Smart Demand Response Market, by Application
- 7.4.3.6 Nigeria Smart Demand Response Market
- 7.4.3.6.1 Nigeria Smart Demand Response Market, by Type
- 7.4.3.6.2 Nigeria Smart Demand Response Market, by Application
- 7.4.3.7 Rest of LAMEA Smart Demand Response Market
- 7.4.3.7.1 Rest of LAMEA Smart Demand Response Market, by Type
- 7.4.3.7.2 Rest of LAMEA Smart Demand Response Market, by Application
- 7.4.3.1 Brazil Smart Demand Response Market
- 7.4.1 LAMEA Smart Demand Response Market, by Type
Chapter 8. Company Profiles
- 8.1 ABB Group
- 8.1.1 Company Overview
- 8.1.2 Financial Analysis
- 8.1.3 Segmental and Regional Analysis
- 8.1.4 Research & Development Expense
- 8.1.5 Recent strategies and developments:
- 8.1.5.1 Partnerships, Collaborations, and Agreements:
- 8.1.5.2 Product Launches and Product Expansions:
- 8.1.5.3 Acquisition and Mergers:
- 8.1.6 SWOT Analysis
- 8.2 Eaton Corporation PLC
- 8.2.1 Company Overview
- 8.2.2 Financial Analysis
- 8.2.3 Segmental and Regional Analysis
- 8.2.4 Research & Development Expense
- 8.2.5 Recent strategies and developments:
- 8.2.5.1 Partnerships, Collaborations, and Agreements:
- 8.2.6 SWOT Analysis
- 8.3 Siemens AG
- 8.3.1 Company Overview
- 8.3.2 Financial Analysis
- 8.3.3 Segmental and Regional Analysis
- 8.3.4 Research & Development Expense
- 8.3.5 Recent strategies and developments:
- 8.3.5.1 Partnerships, Collaborations, and Agreements:
- 8.3.5.2 Acquisition and Mergers:
- 8.3.6 SWOT Analysis
- 8.4 Schneider Electric SE
- 8.4.1 Company Overview
- 8.4.2 Financial Analysis
- 8.4.3 Segmental and Regional Analysis
- 8.4.4 Research & Development Expense
- 8.4.5 Recent strategies and developments:
- 8.4.5.1 Partnerships, Collaborations, and Agreements:
- 8.4.5.2 Acquisition and Mergers:
- 8.4.6 SWOT Analysis
- 8.5 Enel S.p.A
- 8.5.1 Company Overview
- 8.5.2 Financial Analysis
- 8.5.3 Segmental and Regional Analysis
- 8.5.4 Recent strategies and developments:
- 8.5.4.1 Partnerships, Collaborations, and Agreements:
- 8.5.4.2 Product Launches and Product Expansions:
- 8.5.5 SWOT Analysis
- 8.6 General Electric Company
- 8.6.1 Company Overview
- 8.6.2 Financial Analysis
- 8.6.3 Segmental and Regional Analysis
- 8.6.4 Research & Development Expense
- 8.6.5 Recent strategies and developments:
- 8.6.5.1 Partnerships, Collaborations, and Agreements:
- 8.6.6 SWOT Analysis
- 8.7 Honeywell International, Inc.
- 8.7.1 Company Overview
- 8.7.2 Financial Analysis
- 8.7.3 Segmental and Regional Analysis
- 8.7.4 Research & Development Expenses
- 8.7.5 Recent strategies and developments:
- 8.7.5.1 Partnerships, Collaborations, and Agreements:
- 8.7.5.2 Product Launches and Product Expansions:
- 8.7.6 SWOT Analysis
- 8.8 Johnson Controls International PLC
- 8.8.1 Company Overview
- 8.8.2 Financial Analysis
- 8.8.3 Segmental & Regional Analysis
- 8.8.4 Research & Development Expenses
- 8.8.5 Recent strategies and developments:
- 8.8.5.1 Acquisition and Mergers:
- 8.8.6 SWOT Analysis
- 8.9 Oracle Corporation
- 8.9.1 Company Overview
- 8.9.2 Financial Analysis
- 8.9.3 Segmental and Regional Analysis
- 8.9.4 Research & Development Expense
- 8.9.5 Recent strategies and developments:
- 8.9.5.1 Partnerships, Collaborations, and Agreements:
- 8.9.6 SWOT Analysis
- 8.10. Itron, Inc.
- 8.10.1 Company Overview
- 8.10.2 Financial Analysis
- 8.10.3 Segmental and Regional Analysis
- 8.10.4 Research & Development Expenses
- 8.10.5 Recent strategies and developments:
- 8.10.5.1 Partnerships, Collaborations, and Agreements:
- 8.10.6 SWOT Analysis