|
|
市場調査レポート
商品コード
1385022
セキュアロジスティクスの世界市場規模、シェア、産業動向分析レポート:タイプ別、輸送モード別、用途別、地域別展望と予測、2023年~2030年Global Secure Logistics Market Size, Share & Industry Trends Analysis Report By Type (Static, and Mobile), By Mode of Transport (Roadways, Railways, and Airways), By Application, By Regional Outlook and Forecast, 2023 - 2030 |
||||||
|
|
|||||||
|
|||||||


| セキュアロジスティクスの世界市場規模、シェア、産業動向分析レポート:タイプ別、輸送モード別、用途別、地域別展望と予測、2023年~2030年 |
|
出版日: 2023年10月31日
発行: KBV Research
ページ情報: 英文 232 Pages
納期: 即納可能
|

- 全表示
- 概要
- 図表
- 目次
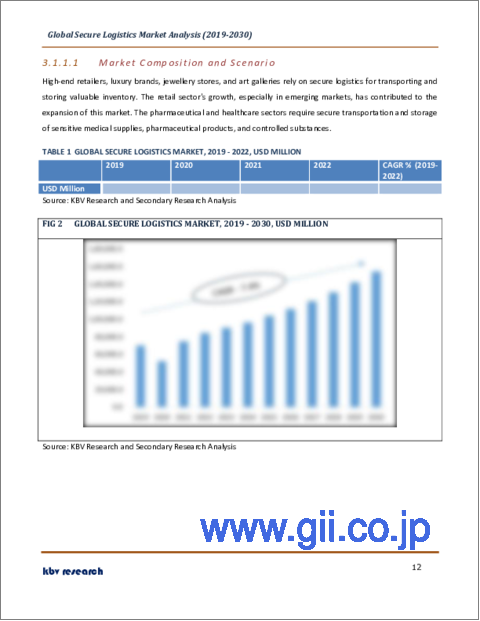
セキュアロジスティクス市場規模は2030年までに1,547億米ドルに達し、予測期間中にCAGR 8.0%の市場成長率で上昇すると予測されます。
しかし、現金取引の大幅な減少は、安全なロジスティクス業務の中核である現金輸送サービスの必要性の低下につながる可能性があります。現金利用が減少すると、市場の収益性と財務実績に影響を及ぼします。現金取引が減少すれば、現金の取り扱いと輸送の分野で、プロバイダーはより少ないビジネスプールを奪い合うことになり、価格が下がる可能性があります。電子決済のスピードと効率化に伴い、貴重な資産の輸送や保管を含むプロセスを、電子決済システムの効率に合わせて最適化するよう、プロバイダーに対する圧力が高まる可能性があります。電子決済の利用拡大が市場に影響を与える可能性があります。
用途の展望
用途別では、現金管理、ダイヤモンド・宝飾品・貴金属、製造、その他に分類されます。2022年には、現金管理分野が市場で最も高い収益シェアを占めました。セキュアロジスティクスの主要機能の1つは、ある場所から別の場所への現金の輸送です。銀行、金融機関、小売業、さらにはATMは、現金を安全に移動させるプロバイダーに依存しています。現金管理は、輸送中も現金が保護され、盗難リスクを最小限に抑え、資金が目的地に無傷で到着することを保証します。多くの安全なロジスティクスプロバイダーは、企業や金融機関のための安全な保管施設として現金保管庫を運営しています。キャッシュ・イン・トランジット(CIT)サービスは、市場の重要な側面です。
タイプ別展望
タイプ別に見ると、市場はスタティックとモバイルに分類されます。2022年には、スタティックセグメントが市場で最大の収益シェアを占める。安全な金庫や保管庫などのスタティックセキュリティ対策は、現金、宝飾品、貴金属などの貴重な資産を盗難、不正アクセス、その他のセキュリティ脅威から保護します。目に見えるスタティックセキュリティ対策の存在は、潜在的な犯罪者に対する抑止力として機能します。安全な金庫や設備が資産を保護していることを知ることで、窃盗の企てを阻止することができます。スタティックセキュリティシステムにより、組織は貴重な資産へのアクセスを管理・監視することができます。
輸送モードの展望
輸送モードによって、市場は道路、鉄道、空路に分けられます。鉄道セグメントは、2022年の市場で大きな収益シェアを獲得しました。鉄道は、大量の貨物を運ぶ能力があるため、貴重な資産の大規模輸送に適しています。このため、貴金属のような高額商品を長距離輸送するのに適しています。鉄道輸送は一般に、アクセスが管理され、進入ポイントが限られているため、安全な輸送手段と考えられています。貴重品は安全な鉄道車両に積み込まれ、輸送中も厳重に監視されるため、盗難や不正アクセスのリスクを減らすことができます。
地域別展望
地域別に見ると、市場は北米、欧州、アジア太平洋、LAMEAで分析されます。2022年には、北米地域が最も高い収益シェアを獲得して市場をリードしました。高額商品の安全な輸送と保管に対する需要の高まりが、北米市場の大幅な拡大をもたらしました。こうしたサービスに対するニーズが堅調に推移していることから、同市場は今後も成長を続けると予想されます。北米のセキュアロジスティクスプロバイダーは、装甲輸送、安全な保管、現金管理、資産追跡、リスク軽減サービスなど、さまざまなサービスを提供しています。銀行、小売、宝飾品、医薬品など、さまざまな業界に対応しています。
目次
第1章 市場範囲と調査手法
- 市場の定義
- 目的
- 市場範囲
- セグメンテーション
- 調査手法
第2章 市場の概要
- 主なハイライト
第3章 市場概要
- イントロダクション
- 概要
- 市場構成とシナリオ
- 概要
- 市場に影響を与える主な要因
- 市場促進要因
- 市場抑制要因
- ポーターのファイブフォース分析
第4章 セキュアロジスティクス市場で展開する戦略
第5章 世界のセキュアロジスティクス市場:タイプ別
- 世界のスタティック市場:地域別
- 世界のモバイル市場:地域別
第6章 世界のセキュアロジスティクス市場:輸送モード別
- 世界の道路市場:地域別
- 世界の鉄道市場:地域別
- 世界の空路市場:地域別
第7章 世界のセキュアロジスティクス市場:用途別
- 世界の現金管理市場:地域別
- 世界のダイヤモンド・宝飾品・貴金属市場:地域別
- 世界の製造業市場:地域別
- 世界のその他の市場:地域別
第8章 世界のセキュアロジスティクス市場:地域別
- 北米
- 北米の市場:国別
- 米国
- カナダ
- メキシコ
- その他北米地域
- 北米の市場:国別
- 欧州
- 欧州の市場:国別
- ドイツ
- 英国
- フランス
- ロシア
- スペイン
- イタリア
- その他欧州地域
- 欧州の市場:国別
- アジア太平洋
- アジア太平洋の市場:国別
- 中国
- 日本
- インド
- 韓国
- シンガポール
- マレーシア
- その他アジア太平洋地域
- アジア太平洋の市場:国別
- ラテンアメリカ・中東・アフリカ
- ラテンアメリカ・中東・アフリカの市場:国別
- ブラジル
- アルゼンチン
- アラブ首長国連邦
- サウジアラビア
- 南アフリカ
- ナイジェリア
- その他ラテンアメリカ・中東・アフリカ地域
- ラテンアメリカ・中東・アフリカの市場:国別
第9章 企業プロファイル
- Garda World Security Corporation(GardaWorld)(BC Partners)
- Lemuir Group
- Securitas AB
- Brink's Incorporated(Brink's)
- PlanITROI, Inc
- CargoGuard GmbH
- CMS Info Systems Private Limited(CMS)
- Prosegur
- Allied Universal
- Secure Logistics LLC
第10章 市場の成功必須条件
LIST OF TABLES
- TABLE 1 Global Secure Logistics Market, 2019 - 2022, USD Million
- TABLE 2 Global Secure Logistics Market, 2023 - 2030, USD Million
- TABLE 3 Global Secure Logistics Market by Type, 2019 - 2022, USD Million
- TABLE 4 Global Secure Logistics Market by Type, 2023 - 2030, USD Million
- TABLE 5 Global Static Market by Region, 2019 - 2022, USD Million
- TABLE 6 Global Static Market by Region, 2023 - 2030, USD Million
- TABLE 7 Global Mobile Market by Region, 2019 - 2022, USD Million
- TABLE 8 Global Mobile Market by Region, 2023 - 2030, USD Million
- TABLE 9 Global Secure Logistics Market by Mode of Transport, 2019 - 2022, USD Million
- TABLE 10 Global Secure Logistics Market by Mode of Transport, 2023 - 2030, USD Million
- TABLE 11 Global Roadways Market by Region, 2019 - 2022, USD Million
- TABLE 12 Global Roadways Market by Region, 2023 - 2030, USD Million
- TABLE 13 Global Railways Market by Region, 2019 - 2022, USD Million
- TABLE 14 Global Railways Market by Region, 2023 - 2030, USD Million
- TABLE 15 Global Airways Market by Region, 2019 - 2022, USD Million
- TABLE 16 Global Airways Market by Region, 2023 - 2030, USD Million
- TABLE 17 Global Secure Logistics Market by Application, 2019 - 2022, USD Million
- TABLE 18 Global Secure Logistics Market by Application, 2023 - 2030, USD Million
- TABLE 19 Global Cash Management Market by Region, 2019 - 2022, USD Million
- TABLE 20 Global Cash Management Market by Region, 2023 - 2030, USD Million
- TABLE 21 Global Diamonds, Jewellery & Precious Metal Market by Region, 2019 - 2022, USD Million
- TABLE 22 Global Diamonds, Jewellery & Precious Metal Market by Region, 2023 - 2030, USD Million
- TABLE 23 Global Manufacturing Market by Region, 2019 - 2022, USD Million
- TABLE 24 Global Manufacturing Market by Region, 2023 - 2030, USD Million
- TABLE 25 Global Others Market by Region, 2019 - 2022, USD Million
- TABLE 26 Global Others Market by Region, 2023 - 2030, USD Million
- TABLE 27 Global Secure Logistics Market by Region, 2019 - 2022, USD Million
- TABLE 28 Global Secure Logistics Market by Region, 2023 - 2030, USD Million
- TABLE 29 North America Secure Logistics Market, 2019 - 2022, USD Million
- TABLE 30 North America Secure Logistics Market, 2023 - 2030, USD Million
- TABLE 31 North America Secure Logistics Market by Type, 2019 - 2022, USD Million
- TABLE 32 North America Secure Logistics Market by Type, 2023 - 2030, USD Million
- TABLE 33 North America Static Market by Country, 2019 - 2022, USD Million
- TABLE 34 North America Static Market by Country, 2023 - 2030, USD Million
- TABLE 35 North America Mobile Market by Country, 2019 - 2022, USD Million
- TABLE 36 North America Mobile Market by Country, 2023 - 2030, USD Million
- TABLE 37 North America Secure Logistics Market by Mode of Transport, 2019 - 2022, USD Million
- TABLE 38 North America Secure Logistics Market by Mode of Transport, 2023 - 2030, USD Million
- TABLE 39 North America Roadways Market by Country, 2019 - 2022, USD Million
- TABLE 40 North America Roadways Market by Country, 2023 - 2030, USD Million
- TABLE 41 North America Railways Market by Country, 2019 - 2022, USD Million
- TABLE 42 North America Railways Market by Country, 2023 - 2030, USD Million
- TABLE 43 North America Airways Market by Country, 2019 - 2022, USD Million
- TABLE 44 North America Airways Market by Country, 2023 - 2030, USD Million
- TABLE 45 North America Secure Logistics Market by Application, 2019 - 2022, USD Million
- TABLE 46 North America Secure Logistics Market by Application, 2023 - 2030, USD Million
- TABLE 47 North America Cash Management Market by Country, 2019 - 2022, USD Million
- TABLE 48 North America Cash Management Market by Country, 2023 - 2030, USD Million
- TABLE 49 North America Diamonds, Jewellery & Precious Metal Market by Country, 2019 - 2022, USD Million
- TABLE 50 North America Diamonds, Jewellery & Precious Metal Market by Country, 2023 - 2030, USD Million
- TABLE 51 North America Manufacturing Market by Country, 2019 - 2022, USD Million
- TABLE 52 North America Manufacturing Market by Country, 2023 - 2030, USD Million
- TABLE 53 North America Others Market by Country, 2019 - 2022, USD Million
- TABLE 54 North America Others Market by Country, 2023 - 2030, USD Million
- TABLE 55 North America Secure Logistics Market by Country, 2019 - 2022, USD Million
- TABLE 56 North America Secure Logistics Market by Country, 2023 - 2030, USD Million
- TABLE 57 US Secure Logistics Market, 2019 - 2022, USD Million
- TABLE 58 US Secure Logistics Market, 2023 - 2030, USD Million
- TABLE 59 US Secure Logistics Market by Type, 2019 - 2022, USD Million
- TABLE 60 US Secure Logistics Market by Type, 2023 - 2030, USD Million
- TABLE 61 US Secure Logistics Market by Mode of Transport, 2019 - 2022, USD Million
- TABLE 62 US Secure Logistics Market by Mode of Transport, 2023 - 2030, USD Million
- TABLE 63 US Secure Logistics Market by Application, 2019 - 2022, USD Million
- TABLE 64 US Secure Logistics Market by Application, 2023 - 2030, USD Million
- TABLE 65 Canada Secure Logistics Market, 2019 - 2022, USD Million
- TABLE 66 Canada Secure Logistics Market, 2023 - 2030, USD Million
- TABLE 67 Canada Secure Logistics Market by Type, 2019 - 2022, USD Million
- TABLE 68 Canada Secure Logistics Market by Type, 2023 - 2030, USD Million
- TABLE 69 Canada Secure Logistics Market by Mode of Transport, 2019 - 2022, USD Million
- TABLE 70 Canada Secure Logistics Market by Mode of Transport, 2023 - 2030, USD Million
- TABLE 71 Canada Secure Logistics Market by Application, 2019 - 2022, USD Million
- TABLE 72 Canada Secure Logistics Market by Application, 2023 - 2030, USD Million
- TABLE 73 Mexico Secure Logistics Market, 2019 - 2022, USD Million
- TABLE 74 Mexico Secure Logistics Market, 2023 - 2030, USD Million
- TABLE 75 Mexico Secure Logistics Market by Type, 2019 - 2022, USD Million
- TABLE 76 Mexico Secure Logistics Market by Type, 2023 - 2030, USD Million
- TABLE 77 Mexico Secure Logistics Market by Mode of Transport, 2019 - 2022, USD Million
- TABLE 78 Mexico Secure Logistics Market by Mode of Transport, 2023 - 2030, USD Million
- TABLE 79 Mexico Secure Logistics Market by Application, 2019 - 2022, USD Million
- TABLE 80 Mexico Secure Logistics Market by Application, 2023 - 2030, USD Million
- TABLE 81 Rest of North America Secure Logistics Market, 2019 - 2022, USD Million
- TABLE 82 Rest of North America Secure Logistics Market, 2023 - 2030, USD Million
- TABLE 83 Rest of North America Secure Logistics Market by Type, 2019 - 2022, USD Million
- TABLE 84 Rest of North America Secure Logistics Market by Type, 2023 - 2030, USD Million
- TABLE 85 Rest of North America Secure Logistics Market by Mode of Transport, 2019 - 2022, USD Million
- TABLE 86 Rest of North America Secure Logistics Market by Mode of Transport, 2023 - 2030, USD Million
- TABLE 87 Rest of North America Secure Logistics Market by Application, 2019 - 2022, USD Million
- TABLE 88 Rest of North America Secure Logistics Market by Application, 2023 - 2030, USD Million
- TABLE 89 Europe Secure Logistics Market, 2019 - 2022, USD Million
- TABLE 90 Europe Secure Logistics Market, 2023 - 2030, USD Million
- TABLE 91 Europe Secure Logistics Market by Type, 2019 - 2022, USD Million
- TABLE 92 Europe Secure Logistics Market by Type, 2023 - 2030, USD Million
- TABLE 93 Europe Static Market by Country, 2019 - 2022, USD Million
- TABLE 94 Europe Static Market by Country, 2023 - 2030, USD Million
- TABLE 95 Europe Mobile Market by Country, 2019 - 2022, USD Million
- TABLE 96 Europe Mobile Market by Country, 2023 - 2030, USD Million
- TABLE 97 Europe Secure Logistics Market by Mode of Transport, 2019 - 2022, USD Million
- TABLE 98 Europe Secure Logistics Market by Mode of Transport, 2023 - 2030, USD Million
- TABLE 99 Europe Roadways Market by Country, 2019 - 2022, USD Million
- TABLE 100 Europe Roadways Market by Country, 2023 - 2030, USD Million
- TABLE 101 Europe Railways Market by Country, 2019 - 2022, USD Million
- TABLE 102 Europe Railways Market by Country, 2023 - 2030, USD Million
- TABLE 103 Europe Airways Market by Country, 2019 - 2022, USD Million
- TABLE 104 Europe Airways Market by Country, 2023 - 2030, USD Million
- TABLE 105 Europe Secure Logistics Market by Application, 2019 - 2022, USD Million
- TABLE 106 Europe Secure Logistics Market by Application, 2023 - 2030, USD Million
- TABLE 107 Europe Cash Management Market by Country, 2019 - 2022, USD Million
- TABLE 108 Europe Cash Management Market by Country, 2023 - 2030, USD Million
- TABLE 109 Europe Diamonds, Jewellery & Precious Metal Market by Country, 2019 - 2022, USD Million
- TABLE 110 Europe Diamonds, Jewellery & Precious Metal Market by Country, 2023 - 2030, USD Million
- TABLE 111 Europe Manufacturing Market by Country, 2019 - 2022, USD Million
- TABLE 112 Europe Manufacturing Market by Country, 2023 - 2030, USD Million
- TABLE 113 Europe Others Market by Country, 2019 - 2022, USD Million
- TABLE 114 Europe Others Market by Country, 2023 - 2030, USD Million
- TABLE 115 Europe Secure Logistics Market by Country, 2019 - 2022, USD Million
- TABLE 116 Europe Secure Logistics Market by Country, 2023 - 2030, USD Million
- TABLE 117 Germany Secure Logistics Market, 2019 - 2022, USD Million
- TABLE 118 Germany Secure Logistics Market, 2023 - 2030, USD Million
- TABLE 119 Germany Secure Logistics Market by Type, 2019 - 2022, USD Million
- TABLE 120 Germany Secure Logistics Market by Type, 2023 - 2030, USD Million
- TABLE 121 Germany Secure Logistics Market by Mode of Transport, 2019 - 2022, USD Million
- TABLE 122 Germany Secure Logistics Market by Mode of Transport, 2023 - 2030, USD Million
- TABLE 123 Germany Secure Logistics Market by Application, 2019 - 2022, USD Million
- TABLE 124 Germany Secure Logistics Market by Application, 2023 - 2030, USD Million
- TABLE 125 UK Secure Logistics Market, 2019 - 2022, USD Million
- TABLE 126 UK Secure Logistics Market, 2023 - 2030, USD Million
- TABLE 127 UK Secure Logistics Market by Type, 2019 - 2022, USD Million
- TABLE 128 UK Secure Logistics Market by Type, 2023 - 2030, USD Million
- TABLE 129 UK Secure Logistics Market by Mode of Transport, 2019 - 2022, USD Million
- TABLE 130 UK Secure Logistics Market by Mode of Transport, 2023 - 2030, USD Million
- TABLE 131 UK Secure Logistics Market by Application, 2019 - 2022, USD Million
- TABLE 132 UK Secure Logistics Market by Application, 2023 - 2030, USD Million
- TABLE 133 France Secure Logistics Market, 2019 - 2022, USD Million
- TABLE 134 France Secure Logistics Market, 2023 - 2030, USD Million
- TABLE 135 France Secure Logistics Market by Type, 2019 - 2022, USD Million
- TABLE 136 France Secure Logistics Market by Type, 2023 - 2030, USD Million
- TABLE 137 France Secure Logistics Market by Mode of Transport, 2019 - 2022, USD Million
- TABLE 138 France Secure Logistics Market by Mode of Transport, 2023 - 2030, USD Million
- TABLE 139 France Secure Logistics Market by Application, 2019 - 2022, USD Million
- TABLE 140 France Secure Logistics Market by Application, 2023 - 2030, USD Million
- TABLE 141 Russia Secure Logistics Market, 2019 - 2022, USD Million
- TABLE 142 Russia Secure Logistics Market, 2023 - 2030, USD Million
- TABLE 143 Russia Secure Logistics Market by Type, 2019 - 2022, USD Million
- TABLE 144 Russia Secure Logistics Market by Type, 2023 - 2030, USD Million
- TABLE 145 Russia Secure Logistics Market by Mode of Transport, 2019 - 2022, USD Million
- TABLE 146 Russia Secure Logistics Market by Mode of Transport, 2023 - 2030, USD Million
- TABLE 147 Russia Secure Logistics Market by Application, 2019 - 2022, USD Million
- TABLE 148 Russia Secure Logistics Market by Application, 2023 - 2030, USD Million
- TABLE 149 Spain Secure Logistics Market, 2019 - 2022, USD Million
- TABLE 150 Spain Secure Logistics Market, 2023 - 2030, USD Million
- TABLE 151 Spain Secure Logistics Market by Type, 2019 - 2022, USD Million
- TABLE 152 Spain Secure Logistics Market by Type, 2023 - 2030, USD Million
- TABLE 153 Spain Secure Logistics Market by Mode of Transport, 2019 - 2022, USD Million
- TABLE 154 Spain Secure Logistics Market by Mode of Transport, 2023 - 2030, USD Million
- TABLE 155 Spain Secure Logistics Market by Application, 2019 - 2022, USD Million
- TABLE 156 Spain Secure Logistics Market by Application, 2023 - 2030, USD Million
- TABLE 157 Italy Secure Logistics Market, 2019 - 2022, USD Million
- TABLE 158 Italy Secure Logistics Market, 2023 - 2030, USD Million
- TABLE 159 Italy Secure Logistics Market by Type, 2019 - 2022, USD Million
- TABLE 160 Italy Secure Logistics Market by Type, 2023 - 2030, USD Million
- TABLE 161 Italy Secure Logistics Market by Mode of Transport, 2019 - 2022, USD Million
- TABLE 162 Italy Secure Logistics Market by Mode of Transport, 2023 - 2030, USD Million
- TABLE 163 Italy Secure Logistics Market by Application, 2019 - 2022, USD Million
- TABLE 164 Italy Secure Logistics Market by Application, 2023 - 2030, USD Million
- TABLE 165 Rest of Europe Secure Logistics Market, 2019 - 2022, USD Million
- TABLE 166 Rest of Europe Secure Logistics Market, 2023 - 2030, USD Million
- TABLE 167 Rest of Europe Secure Logistics Market by Type, 2019 - 2022, USD Million
- TABLE 168 Rest of Europe Secure Logistics Market by Type, 2023 - 2030, USD Million
- TABLE 169 Rest of Europe Secure Logistics Market by Mode of Transport, 2019 - 2022, USD Million
- TABLE 170 Rest of Europe Secure Logistics Market by Mode of Transport, 2023 - 2030, USD Million
- TABLE 171 Rest of Europe Secure Logistics Market by Application, 2019 - 2022, USD Million
- TABLE 172 Rest of Europe Secure Logistics Market by Application, 2023 - 2030, USD Million
- TABLE 173 Asia Pacific Secure Logistics Market, 2019 - 2022, USD Million
- TABLE 174 Asia Pacific Secure Logistics Market, 2023 - 2030, USD Million
- TABLE 175 Asia Pacific Secure Logistics Market by Type, 2019 - 2022, USD Million
- TABLE 176 Asia Pacific Secure Logistics Market by Type, 2023 - 2030, USD Million
- TABLE 177 Asia Pacific Static Market by Country, 2019 - 2022, USD Million
- TABLE 178 Asia Pacific Static Market by Country, 2023 - 2030, USD Million
- TABLE 179 Asia Pacific Mobile Market by Country, 2019 - 2022, USD Million
- TABLE 180 Asia Pacific Mobile Market by Country, 2023 - 2030, USD Million
- TABLE 181 Asia Pacific Secure Logistics Market by Mode of Transport, 2019 - 2022, USD Million
- TABLE 182 Asia Pacific Secure Logistics Market by Mode of Transport, 2023 - 2030, USD Million
- TABLE 183 Asia Pacific Roadways Market by Country, 2019 - 2022, USD Million
- TABLE 184 Asia Pacific Roadways Market by Country, 2023 - 2030, USD Million
- TABLE 185 Asia Pacific Railways Market by Country, 2019 - 2022, USD Million
- TABLE 186 Asia Pacific Railways Market by Country, 2023 - 2030, USD Million
- TABLE 187 Asia Pacific Airways Market by Country, 2019 - 2022, USD Million
- TABLE 188 Asia Pacific Airways Market by Country, 2023 - 2030, USD Million
- TABLE 189 Asia Pacific Secure Logistics Market by Application, 2019 - 2022, USD Million
- TABLE 190 Asia Pacific Secure Logistics Market by Application, 2023 - 2030, USD Million
- TABLE 191 Asia Pacific Cash Management Market by Country, 2019 - 2022, USD Million
- TABLE 192 Asia Pacific Cash Management Market by Country, 2023 - 2030, USD Million
- TABLE 193 Asia Pacific Diamonds, Jewellery & Precious Metal Market by Country, 2019 - 2022, USD Million
- TABLE 194 Asia Pacific Diamonds, Jewellery & Precious Metal Market by Country, 2023 - 2030, USD Million
- TABLE 195 Asia Pacific Manufacturing Market by Country, 2019 - 2022, USD Million
- TABLE 196 Asia Pacific Manufacturing Market by Country, 2023 - 2030, USD Million
- TABLE 197 Asia Pacific Others Market by Country, 2019 - 2022, USD Million
- TABLE 198 Asia Pacific Others Market by Country, 2023 - 2030, USD Million
- TABLE 199 Asia Pacific Secure Logistics Market by Country, 2019 - 2022, USD Million
- TABLE 200 Asia Pacific Secure Logistics Market by Country, 2023 - 2030, USD Million
- TABLE 201 China Secure Logistics Market, 2019 - 2022, USD Million
- TABLE 202 China Secure Logistics Market, 2023 - 2030, USD Million
- TABLE 203 China Secure Logistics Market by Type, 2019 - 2022, USD Million
- TABLE 204 China Secure Logistics Market by Type, 2023 - 2030, USD Million
- TABLE 205 China Secure Logistics Market by Mode of Transport, 2019 - 2022, USD Million
- TABLE 206 China Secure Logistics Market by Mode of Transport, 2023 - 2030, USD Million
- TABLE 207 China Secure Logistics Market by Application, 2019 - 2022, USD Million
- TABLE 208 China Secure Logistics Market by Application, 2023 - 2030, USD Million
- TABLE 209 Japan Secure Logistics Market, 2019 - 2022, USD Million
- TABLE 210 Japan Secure Logistics Market, 2023 - 2030, USD Million
- TABLE 211 Japan Secure Logistics Market by Type, 2019 - 2022, USD Million
- TABLE 212 Japan Secure Logistics Market by Type, 2023 - 2030, USD Million
- TABLE 213 Japan Secure Logistics Market by Mode of Transport, 2019 - 2022, USD Million
- TABLE 214 Japan Secure Logistics Market by Mode of Transport, 2023 - 2030, USD Million
- TABLE 215 Japan Secure Logistics Market by Application, 2019 - 2022, USD Million
- TABLE 216 Japan Secure Logistics Market by Application, 2023 - 2030, USD Million
- TABLE 217 India Secure Logistics Market, 2019 - 2022, USD Million
- TABLE 218 India Secure Logistics Market, 2023 - 2030, USD Million
- TABLE 219 India Secure Logistics Market by Type, 2019 - 2022, USD Million
- TABLE 220 India Secure Logistics Market by Type, 2023 - 2030, USD Million
- TABLE 221 India Secure Logistics Market by Mode of Transport, 2019 - 2022, USD Million
- TABLE 222 India Secure Logistics Market by Mode of Transport, 2023 - 2030, USD Million
- TABLE 223 India Secure Logistics Market by Application, 2019 - 2022, USD Million
- TABLE 224 India Secure Logistics Market by Application, 2023 - 2030, USD Million
- TABLE 225 South Korea Secure Logistics Market, 2019 - 2022, USD Million
- TABLE 226 South Korea Secure Logistics Market, 2023 - 2030, USD Million
- TABLE 227 South Korea Secure Logistics Market by Type, 2019 - 2022, USD Million
- TABLE 228 South Korea Secure Logistics Market by Type, 2023 - 2030, USD Million
- TABLE 229 South Korea Secure Logistics Market by Mode of Transport, 2019 - 2022, USD Million
- TABLE 230 South Korea Secure Logistics Market by Mode of Transport, 2023 - 2030, USD Million
- TABLE 231 South Korea Secure Logistics Market by Application, 2019 - 2022, USD Million
- TABLE 232 South Korea Secure Logistics Market by Application, 2023 - 2030, USD Million
- TABLE 233 Singapore Secure Logistics Market, 2019 - 2022, USD Million
- TABLE 234 Singapore Secure Logistics Market, 2023 - 2030, USD Million
- TABLE 235 Singapore Secure Logistics Market by Type, 2019 - 2022, USD Million
- TABLE 236 Singapore Secure Logistics Market by Type, 2023 - 2030, USD Million
- TABLE 237 Singapore Secure Logistics Market by Mode of Transport, 2019 - 2022, USD Million
- TABLE 238 Singapore Secure Logistics Market by Mode of Transport, 2023 - 2030, USD Million
- TABLE 239 Singapore Secure Logistics Market by Application, 2019 - 2022, USD Million
- TABLE 240 Singapore Secure Logistics Market by Application, 2023 - 2030, USD Million
- TABLE 241 Malaysia Secure Logistics Market, 2019 - 2022, USD Million
- TABLE 242 Malaysia Secure Logistics Market, 2023 - 2030, USD Million
- TABLE 243 Malaysia Secure Logistics Market by Type, 2019 - 2022, USD Million
- TABLE 244 Malaysia Secure Logistics Market by Type, 2023 - 2030, USD Million
- TABLE 245 Malaysia Secure Logistics Market by Mode of Transport, 2019 - 2022, USD Million
- TABLE 246 Malaysia Secure Logistics Market by Mode of Transport, 2023 - 2030, USD Million
- TABLE 247 Malaysia Secure Logistics Market by Application, 2019 - 2022, USD Million
- TABLE 248 Malaysia Secure Logistics Market by Application, 2023 - 2030, USD Million
- TABLE 249 Rest of Asia Pacific Secure Logistics Market, 2019 - 2022, USD Million
- TABLE 250 Rest of Asia Pacific Secure Logistics Market, 2023 - 2030, USD Million
- TABLE 251 Rest of Asia Pacific Secure Logistics Market by Type, 2019 - 2022, USD Million
- TABLE 252 Rest of Asia Pacific Secure Logistics Market by Type, 2023 - 2030, USD Million
- TABLE 253 Rest of Asia Pacific Secure Logistics Market by Mode of Transport, 2019 - 2022, USD Million
- TABLE 254 Rest of Asia Pacific Secure Logistics Market by Mode of Transport, 2023 - 2030, USD Million
- TABLE 255 Rest of Asia Pacific Secure Logistics Market by Application, 2019 - 2022, USD Million
- TABLE 256 Rest of Asia Pacific Secure Logistics Market by Application, 2023 - 2030, USD Million
- TABLE 257 LAMEA Secure Logistics Market, 2019 - 2022, USD Million
- TABLE 258 LAMEA Secure Logistics Market, 2023 - 2030, USD Million
- TABLE 259 LAMEA Secure Logistics Market by Type, 2019 - 2022, USD Million
- TABLE 260 LAMEA Secure Logistics Market by Type, 2023 - 2030, USD Million
- TABLE 261 LAMEA Static Market by Country, 2019 - 2022, USD Million
- TABLE 262 LAMEA Static Market by Country, 2023 - 2030, USD Million
- TABLE 263 LAMEA Mobile Market by Country, 2019 - 2022, USD Million
- TABLE 264 LAMEA Mobile Market by Country, 2023 - 2030, USD Million
- TABLE 265 LAMEA Secure Logistics Market by Mode of Transport, 2019 - 2022, USD Million
- TABLE 266 LAMEA Secure Logistics Market by Mode of Transport, 2023 - 2030, USD Million
- TABLE 267 LAMEA Roadways Market by Country, 2019 - 2022, USD Million
- TABLE 268 LAMEA Roadways Market by Country, 2023 - 2030, USD Million
- TABLE 269 LAMEA Railways Market by Country, 2019 - 2022, USD Million
- TABLE 270 LAMEA Railways Market by Country, 2023 - 2030, USD Million
- TABLE 271 LAMEA Airways Market by Country, 2019 - 2022, USD Million
- TABLE 272 LAMEA Airways Market by Country, 2023 - 2030, USD Million
- TABLE 273 LAMEA Secure Logistics Market by Application, 2019 - 2022, USD Million
- TABLE 274 LAMEA Secure Logistics Market by Application, 2023 - 2030, USD Million
- TABLE 275 LAMEA Cash Management Market by Country, 2019 - 2022, USD Million
- TABLE 276 LAMEA Cash Management Market by Country, 2023 - 2030, USD Million
- TABLE 277 LAMEA Diamonds, Jewellery & Precious Metal Market by Country, 2019 - 2022, USD Million
- TABLE 278 LAMEA Diamonds, Jewellery & Precious Metal Market by Country, 2023 - 2030, USD Million
- TABLE 279 LAMEA Manufacturing Market by Country, 2019 - 2022, USD Million
- TABLE 280 LAMEA Manufacturing Market by Country, 2023 - 2030, USD Million
- TABLE 281 LAMEA Others Market by Country, 2019 - 2022, USD Million
- TABLE 282 LAMEA Others Market by Country, 2023 - 2030, USD Million
- TABLE 283 LAMEA Secure Logistics Market by Country, 2019 - 2022, USD Million
- TABLE 284 LAMEA Secure Logistics Market by Country, 2023 - 2030, USD Million
- TABLE 285 Brazil Secure Logistics Market, 2019 - 2022, USD Million
- TABLE 286 Brazil Secure Logistics Market, 2023 - 2030, USD Million
- TABLE 287 Brazil Secure Logistics Market by Type, 2019 - 2022, USD Million
- TABLE 288 Brazil Secure Logistics Market by Type, 2023 - 2030, USD Million
- TABLE 289 Brazil Secure Logistics Market by Mode of Transport, 2019 - 2022, USD Million
- TABLE 290 Brazil Secure Logistics Market by Mode of Transport, 2023 - 2030, USD Million
- TABLE 291 Brazil Secure Logistics Market by Application, 2019 - 2022, USD Million
- TABLE 292 Brazil Secure Logistics Market by Application, 2023 - 2030, USD Million
- TABLE 293 Argentina Secure Logistics Market, 2019 - 2022, USD Million
- TABLE 294 Argentina Secure Logistics Market, 2023 - 2030, USD Million
- TABLE 295 Argentina Secure Logistics Market by Type, 2019 - 2022, USD Million
- TABLE 296 Argentina Secure Logistics Market by Type, 2023 - 2030, USD Million
- TABLE 297 Argentina Secure Logistics Market by Mode of Transport, 2019 - 2022, USD Million
- TABLE 298 Argentina Secure Logistics Market by Mode of Transport, 2023 - 2030, USD Million
- TABLE 299 Argentina Secure Logistics Market by Application, 2019 - 2022, USD Million
- TABLE 300 Argentina Secure Logistics Market by Application, 2023 - 2030, USD Million
- TABLE 301 UAE Secure Logistics Market, 2019 - 2022, USD Million
- TABLE 302 UAE Secure Logistics Market, 2023 - 2030, USD Million
- TABLE 303 UAE Secure Logistics Market by Type, 2019 - 2022, USD Million
- TABLE 304 UAE Secure Logistics Market by Type, 2023 - 2030, USD Million
- TABLE 305 UAE Secure Logistics Market by Mode of Transport, 2019 - 2022, USD Million
- TABLE 306 UAE Secure Logistics Market by Mode of Transport, 2023 - 2030, USD Million
- TABLE 307 UAE Secure Logistics Market by Application, 2019 - 2022, USD Million
- TABLE 308 UAE Secure Logistics Market by Application, 2023 - 2030, USD Million
- TABLE 309 Saudi Arabia Secure Logistics Market, 2019 - 2022, USD Million
- TABLE 310 Saudi Arabia Secure Logistics Market, 2023 - 2030, USD Million
- TABLE 311 Saudi Arabia Secure Logistics Market by Type, 2019 - 2022, USD Million
- TABLE 312 Saudi Arabia Secure Logistics Market by Type, 2023 - 2030, USD Million
- TABLE 313 Saudi Arabia Secure Logistics Market by Mode of Transport, 2019 - 2022, USD Million
- TABLE 314 Saudi Arabia Secure Logistics Market by Mode of Transport, 2023 - 2030, USD Million
- TABLE 315 Saudi Arabia Secure Logistics Market by Application, 2019 - 2022, USD Million
- TABLE 316 Saudi Arabia Secure Logistics Market by Application, 2023 - 2030, USD Million
- TABLE 317 South Africa Secure Logistics Market, 2019 - 2022, USD Million
- TABLE 318 South Africa Secure Logistics Market, 2023 - 2030, USD Million
- TABLE 319 South Africa Secure Logistics Market by Type, 2019 - 2022, USD Million
- TABLE 320 South Africa Secure Logistics Market by Type, 2023 - 2030, USD Million
- TABLE 321 South Africa Secure Logistics Market by Mode of Transport, 2019 - 2022, USD Million
- TABLE 322 South Africa Secure Logistics Market by Mode of Transport, 2023 - 2030, USD Million
- TABLE 323 South Africa Secure Logistics Market by Application, 2019 - 2022, USD Million
- TABLE 324 South Africa Secure Logistics Market by Application, 2023 - 2030, USD Million
- TABLE 325 Nigeria Secure Logistics Market, 2019 - 2022, USD Million
- TABLE 326 Nigeria Secure Logistics Market, 2023 - 2030, USD Million
- TABLE 327 Nigeria Secure Logistics Market by Type, 2019 - 2022, USD Million
- TABLE 328 Nigeria Secure Logistics Market by Type, 2023 - 2030, USD Million
- TABLE 329 Nigeria Secure Logistics Market by Mode of Transport, 2019 - 2022, USD Million
- TABLE 330 Nigeria Secure Logistics Market by Mode of Transport, 2023 - 2030, USD Million
- TABLE 331 Nigeria Secure Logistics Market by Application, 2019 - 2022, USD Million
- TABLE 332 Nigeria Secure Logistics Market by Application, 2023 - 2030, USD Million
- TABLE 333 Rest of LAMEA Secure Logistics Market, 2019 - 2022, USD Million
- TABLE 334 Rest of LAMEA Secure Logistics Market, 2023 - 2030, USD Million
- TABLE 335 Rest of LAMEA Secure Logistics Market by Type, 2019 - 2022, USD Million
- TABLE 336 Rest of LAMEA Secure Logistics Market by Type, 2023 - 2030, USD Million
- TABLE 337 Rest of LAMEA Secure Logistics Market by Mode of Transport, 2019 - 2022, USD Million
- TABLE 338 Rest of LAMEA Secure Logistics Market by Mode of Transport, 2023 - 2030, USD Million
- TABLE 339 Rest of LAMEA Secure Logistics Market by Application, 2019 - 2022, USD Million
- TABLE 340 Rest of LAMEA Secure Logistics Market by Application, 2023 - 2030, USD Million
- TABLE 341 Key Information - Garda World Security Corporation
- TABLE 342 Key Information - Lemuir Group
- TABLE 343 Key Information - Securitas AB
- TABLE 344 Key Information - Brink's Incorporated
- TABLE 345 Key Information - PlanITROI, Inc.
- TABLE 346 Key Information - CargoGuard GmbH
- TABLE 347 Key Information - CMS Info Systems Private Limited
- TABLE 348 Key Information - Prosegur
- TABLE 349 Key Information - Allied Universal
- TABLE 350 Key Information - Secure Logistics LLC
The Global Secure Logistics Market size is expected to reach $154.7 billion by 2030, rising at a market growth of 8.0% CAGR during the forecast period.
Effective cash management in CIT ensures that cash is collected and transported securely, following strict security protocols. Therefore, the cash management segment would generate more than 45% share of the market by 2030. Cash-in-transit (CIT) providers are responsible for collecting cash from businesses, such as retail stores, banks, and casinos, and transporting it to secure locations, such as banks or cash processing centers. Effective cash management practices ensure the safety, accuracy, and compliance of cash-related processes, contributing to the overall security and efficiency of the market. Some of the factors impacting the market are a rise in the demand for outsourcing branch and atm service, increase in the demand for product integrity, and increase in the usage of electronic payment.
Outsourcing branch and ATM services can be cost-effective for financial institutions and businesses. It allows them to focus on their core activities while leaving the secure logistics of cash replenishment, maintenance, and servicing to specialized providers. Secure logistics companies specialize in secure transportation and management of cash. Secure logistics companies often employ advanced technologies for tracking, monitoring, and managing cash assets, enhancing overall security and efficiency. The trend drives companies to adopt and develop innovative technologies for better cash management, including cash forecasting, monitoring, and real-time reporting. Additionally, the rise of counterfeit products in various industries, such as pharmaceuticals, electronics, and luxury goods, has increased the need for these services to prevent tampering and counterfeiting. The pharmaceutical industry requires stringent measures to ensure medication authenticity, safety, and integrity. These services are essential for maintaining the integrity of pharmaceutical products. It is critical to ensure the safety and authenticity of food and beverage products, particularly high-value items, and premium brands. Secure logistics companies aid in preserving the integrity of these products. Secure logistics providers play a role in protecting the integrity of these products. As product counterfeiting and safety concerns continue to grow, secure logistics providers play a pivotal role in protecting the integrity and authenticity of products throughout the supply chain. This trend has contributed to expanding the market and developing innovative solutions for securing product integrity.
However, a significant reduction in cash transactions can lead to a decrease in the need for cash transportation services, which are a core part of secure logistics operations. As cash usage declines, it affects the market's profitability and financial performance. Reducing cash transactions lead providers to compete for a smaller business pool in the cash handling and transportation segment, potentially driving down prices. With the speed and efficiency of electronic payments, there may be increased pressure on providers to optimize their processes, including the transportation and storage of valuable assets, to match the efficiency of electronic payment systems. The increasing usage of electronic payments can affect the market.
Application Outlook
By application, the market is categorized into cash management, diamonds, jewellery & precious metal, manufacturing, and others. In 2022, the cash management segment held the highest revenue share in the market. One of the primary functions of secure logistics is the transportation of cash from one location to another. Banks, financial institutions, retail businesses, and even ATMs rely on providers to move cash securely. Cash management practices ensure that cash is protected throughout the transit, minimizing theft risk, and ensuring that funds arrive at their destination intact. Many secure logistics providers operate cash vaults, which serve as secure storage facilities for businesses and financial institutions. Cash-in-transit (CIT) services are a critical aspect of the market.
Type Outlook
Based on type, the market is classified into static and mobile. In 2022, the static segment witnessed the largest revenue share in the market. Static security measures, such as secure vaults and safes, protect valuable assets, such as cash, jewellery, and precious metals, from theft, unauthorized access, and other security threats. The presence of visible static security measures can act as a deterrent to potential criminals. Knowing that secure vaults and facilities protect assets can discourage theft attempts. Static security systems enable organizations to control and monitor access to valuable assets.
Mode of Transport Outlook
On the basis of mode of transport, the market is divided into roadways, railways, and airways. The railways segment garnered a significant revenue share in the market in 2022. Railways are well-suited for large-scale transportation of valuable assets due to their capacity to carry substantial cargo loads. This makes them attractive for moving high-value goods, such as precious metals, over long distances. Rail transport is generally considered a secure mode of transportation because of its controlled access and limited entry points. Valuables can be loaded into secure railcars and monitored closely throughout the journey, reducing the risk of theft or unauthorized access.
Regional Outlook
Region-wise, the market is analyzed across North America, Europe, Asia Pacific, and LAMEA. In 2022, the North America region led the market by generating the highest revenue share. Rising demand for the secure transportation and storage of high-value items has resulted in a substantial expansion of the market in North America. The market is expected to continue growing as the need for these services remains robust. Secure logistics providers in North America offer various services, including armored transportation, secure storage, cash management, asset tracking, and risk mitigation services. They cater to various industries, including banking, retail, jewellery, pharmaceuticals, etc.
The market research report covers the analysis of key stake holders of the market. Key companies profiled in the report include Garda World Security Corporation (GardaWorld) (BC Partners), Lemuir Group, Securitas AB, Brink's Incorporated (Brink's), PlanITROI, Inc., CargoGuard GmbH, CMS Info Systems Private Limited (CMS), Prosegur, Allied Universal, and Secure Logistics LLC.
Strategies Deployed in Secure Logistics Market
Aug-2023: Prosegur collaborated with WeSuite, a manufacturer of sales management software tailored for security technology sales and service providers. This collaboration aimed to redefine Prosegur's market approach across a multitude of industries which includes energy and utilities, healthcare, industrial domains, and logistics.
Apr-2023: Garda World Security Corporation released force multiplier, a Hybrid Security Solution. The launched product would be created to support organizations in protecting their critical assets.
Apr-2023: Allied Universal took over MSA Security, a global provider of high-consequence threat solutions. This acquisition aimed to expand its services in the Las Vegas region.
Jan-2023: Prosegur introduced the Next Generation Suite of RFID Solutions, with the highest accuracy available. This launch aimed to enhance inventory accuracy, reinvent loss prevention, and give retailers a new approach to offset costs and grow revenue.
Dec-2022: Crisis24, a subsidiary of GardaWorld company partnered with Palantir Technologies Inc., a public American company that specializes in big data analytics. Under this partnership, both companies aimed to transform security and risk management with the power of AI.
Aug-2022: Garda World Security Corporation took over ARCA, a manufacturer of teller cash recyclers for financial institutions. This acquisition aimed to grow GardaWorld as a security and cybersecurity player.
Jul-2022: Securitas AB took over Stanley Security, a provider of integrated security solutions. This acquisition aimed to offer complementary portfolios across the security services value chain that seamlessly could help Securitas clients' businesses.
May-2022: Brink's Incorporated partnered with Metaco SA, a provider of security-critical software and infrastructure to the digital asset ecosystem. Under this acquisition, both companies aimed to bring together the only custody platform that would ensure no single point of failure in the software and infrastructure stack, with a physical backup solution that would be end-to-end secure and fully distributed to equally verify no physical and operational single point of failure for key recovery storage and logistics.
Feb-2022: Allied Universal partnered with Knightscope, Inc., a developer of advanced physical security technologies. Under this partnership, both companies aimed to broaden the delivery of smart cutting-edge technologies to enhance public safety, enabling customers to focus on their core businesses.
Jan-2022: Prosegur unveiled Global Logistics and Supply Chain Security service, which includes GPS devices designed specifically for logistics and supply chains. This launch aimed to provide a one-stop solution for 24/7 asset protection anywhere across the globe.
May-2021: Brink's Incorporated came into partnership with iZi Cash, a leading provider of cash logistics and cash management services. This partnership aimed to provide secure cash logistics services.
Apr-2021: Brink's Incorporated acquired PAI, Inc., the largest privately held provider of ATM services in the U.S. This acquisition aimed to provide total cash management solutions across the cash ecosystem.
Scope of the Study
Market Segments covered in the Report:
By Type
- Static
- Mobile
By Mode of Transport
- Roadways
- Railways
- Airways
By Application
- Cash Management
- Diamonds, Jewellery & Precious Metal
- Manufacturing
- Others
By Geography
- North America
- US
- Canada
- Mexico
- Rest of North America
- Europe
- Germany
- UK
- France
- Russia
- Spain
- Italy
- Rest of Europe
- Asia Pacific
- China
- Japan
- India
- South Korea
- Singapore
- Malaysia
- Rest of Asia Pacific
- LAMEA
- Brazil
- Argentina
- UAE
- Saudi Arabia
- South Africa
- Nigeria
- Rest of LAMEA
Companies Profiled
- Garda World Security Corporation (GardaWorld) (BC Partners)
- Lemuir Group
- Securitas AB
- Brink's Incorporated (Brink's)
- PlanITROI, Inc.
- CargoGuard GmbH
- CMS Info Systems Private Limited (CMS)
- Prosegur
- Allied Universal
- Secure Logistics LLC
Unique Offerings from KBV Research
- Exhaustive coverage
- Highest number of market tables and figures
- Subscription based model available
- Guaranteed best price
- Assured post sales research support with 10% customization free
Table of Contents
Chapter 1. Market Scope & Methodology
- 1.1 Market Definition
- 1.2 Objectives
- 1.3 Market Scope
- 1.4 Segmentation
- 1.4.1 Global Secure Logistics Market, by Type
- 1.4.2 Global Secure Logistics Market, by Mode of Transport
- 1.4.3 Global Secure Logistics Market, by Application
- 1.4.4 Global Secure Logistics Market, by Geography
- 1.5 Methodology for the research
Chapter 2. Market at a Glance
- 2.1 Key Highlights
Chapter 3. Market Overview
- 3.1 Introduction
- 3.1.1 Overview
- 3.1.1.1 Market Composition and Scenario
- 3.1.1 Overview
- 3.2 Key Factors Impacting the Market
- 3.2.1 Market Drivers
- 3.2.2 Market Restraints
- 3.3 Porter's Five Force Analysis
Chapter 4. Strategies Deployed in Secure Logistics Market
Chapter 5. Global Secure Logistics Market by Type
- 5.1 Global Static Market by Region
- 5.2 Global Mobile Market by Region
Chapter 6. Global Secure Logistics Market by Mode of Transport
- 6.1 Global Roadways Market by Region
- 6.2 Global Railways Market by Region
- 6.3 Global Airways Market by Region
Chapter 7. Global Secure Logistics Market by Application
- 7.1 Global Cash Management Market by Region
- 7.2 Global Diamonds, Jewellery & Precious Metal Market by Region
- 7.3 Global Manufacturing Market by Region
- 7.4 Global Others Market by Region
Chapter 8. Global Secure Logistics Market by Region
- 8.1 North America Secure Logistics Market
- 8.1.1 North America Secure Logistics Market by Type
- 8.1.1.1 North America Static Market by Country
- 8.1.1.2 North America Mobile Market by Country
- 8.1.2 North America Secure Logistics Market by Mode of Transport
- 8.1.2.1 North America Roadways Market by Country
- 8.1.2.2 North America Railways Market by Country
- 8.1.2.3 North America Airways Market by Country
- 8.1.3 North America Secure Logistics Market by Application
- 8.1.3.1 North America Cash Management Market by Country
- 8.1.3.2 North America Diamonds, Jewellery & Precious Metal Market by Country
- 8.1.3.3 North America Manufacturing Market by Country
- 8.1.3.4 North America Others Market by Country
- 8.1.4 North America Secure Logistics Market by Country
- 8.1.4.1 US Secure Logistics Market
- 8.1.4.1.1 US Secure Logistics Market by Type
- 8.1.4.1.2 US Secure Logistics Market by Mode of Transport
- 8.1.4.1.3 US Secure Logistics Market by Application
- 8.1.4.2 Canada Secure Logistics Market
- 8.1.4.2.1 Canada Secure Logistics Market by Type
- 8.1.4.2.2 Canada Secure Logistics Market by Mode of Transport
- 8.1.4.2.3 Canada Secure Logistics Market by Application
- 8.1.4.3 Mexico Secure Logistics Market
- 8.1.4.3.1 Mexico Secure Logistics Market by Type
- 8.1.4.3.2 Mexico Secure Logistics Market by Mode of Transport
- 8.1.4.3.3 Mexico Secure Logistics Market by Application
- 8.1.4.4 Rest of North America Secure Logistics Market
- 8.1.4.4.1 Rest of North America Secure Logistics Market by Type
- 8.1.4.4.2 Rest of North America Secure Logistics Market by Mode of Transport
- 8.1.4.4.3 Rest of North America Secure Logistics Market by Application
- 8.1.4.1 US Secure Logistics Market
- 8.1.1 North America Secure Logistics Market by Type
- 8.2 Europe Secure Logistics Market
- 8.2.1 Europe Secure Logistics Market by Type
- 8.2.1.1 Europe Static Market by Country
- 8.2.1.2 Europe Mobile Market by Country
- 8.2.2 Europe Secure Logistics Market by Mode of Transport
- 8.2.2.1 Europe Roadways Market by Country
- 8.2.2.2 Europe Railways Market by Country
- 8.2.2.3 Europe Airways Market by Country
- 8.2.3 Europe Secure Logistics Market by Application
- 8.2.3.1 Europe Cash Management Market by Country
- 8.2.3.2 Europe Diamonds, Jewellery & Precious Metal Market by Country
- 8.2.3.3 Europe Manufacturing Market by Country
- 8.2.3.4 Europe Others Market by Country
- 8.2.4 Europe Secure Logistics Market by Country
- 8.2.4.1 Germany Secure Logistics Market
- 8.2.4.1.1 Germany Secure Logistics Market by Type
- 8.2.4.1.2 Germany Secure Logistics Market by Mode of Transport
- 8.2.4.1.3 Germany Secure Logistics Market by Application
- 8.2.4.2 UK Secure Logistics Market
- 8.2.4.2.1 UK Secure Logistics Market by Type
- 8.2.4.2.2 UK Secure Logistics Market by Mode of Transport
- 8.2.4.2.3 UK Secure Logistics Market by Application
- 8.2.4.3 France Secure Logistics Market
- 8.2.4.3.1 France Secure Logistics Market by Type
- 8.2.4.3.2 France Secure Logistics Market by Mode of Transport
- 8.2.4.3.3 France Secure Logistics Market by Application
- 8.2.4.4 Russia Secure Logistics Market
- 8.2.4.4.1 Russia Secure Logistics Market by Type
- 8.2.4.4.2 Russia Secure Logistics Market by Mode of Transport
- 8.2.4.4.3 Russia Secure Logistics Market by Application
- 8.2.4.5 Spain Secure Logistics Market
- 8.2.4.5.1 Spain Secure Logistics Market by Type
- 8.2.4.5.2 Spain Secure Logistics Market by Mode of Transport
- 8.2.4.5.3 Spain Secure Logistics Market by Application
- 8.2.4.6 Italy Secure Logistics Market
- 8.2.4.6.1 Italy Secure Logistics Market by Type
- 8.2.4.6.2 Italy Secure Logistics Market by Mode of Transport
- 8.2.4.6.3 Italy Secure Logistics Market by Application
- 8.2.4.7 Rest of Europe Secure Logistics Market
- 8.2.4.7.1 Rest of Europe Secure Logistics Market by Type
- 8.2.4.7.2 Rest of Europe Secure Logistics Market by Mode of Transport
- 8.2.4.7.3 Rest of Europe Secure Logistics Market by Application
- 8.2.4.1 Germany Secure Logistics Market
- 8.2.1 Europe Secure Logistics Market by Type
- 8.3 Asia Pacific Secure Logistics Market
- 8.3.1 Asia Pacific Secure Logistics Market by Type
- 8.3.1.1 Asia Pacific Static Market by Country
- 8.3.1.2 Asia Pacific Mobile Market by Country
- 8.3.2 Asia Pacific Secure Logistics Market by Mode of Transport
- 8.3.2.1 Asia Pacific Roadways Market by Country
- 8.3.2.2 Asia Pacific Railways Market by Country
- 8.3.2.3 Asia Pacific Airways Market by Country
- 8.3.3 Asia Pacific Secure Logistics Market by Application
- 8.3.3.1 Asia Pacific Cash Management Market by Country
- 8.3.3.2 Asia Pacific Diamonds, Jewellery & Precious Metal Market by Country
- 8.3.3.3 Asia Pacific Manufacturing Market by Country
- 8.3.3.4 Asia Pacific Others Market by Country
- 8.3.4 Asia Pacific Secure Logistics Market by Country
- 8.3.4.1 China Secure Logistics Market
- 8.3.4.1.1 China Secure Logistics Market by Type
- 8.3.4.1.2 China Secure Logistics Market by Mode of Transport
- 8.3.4.1.3 China Secure Logistics Market by Application
- 8.3.4.2 Japan Secure Logistics Market
- 8.3.4.2.1 Japan Secure Logistics Market by Type
- 8.3.4.2.2 Japan Secure Logistics Market by Mode of Transport
- 8.3.4.2.3 Japan Secure Logistics Market by Application
- 8.3.4.3 India Secure Logistics Market
- 8.3.4.3.1 India Secure Logistics Market by Type
- 8.3.4.3.2 India Secure Logistics Market by Mode of Transport
- 8.3.4.3.3 India Secure Logistics Market by Application
- 8.3.4.4 South Korea Secure Logistics Market
- 8.3.4.4.1 South Korea Secure Logistics Market by Type
- 8.3.4.4.2 South Korea Secure Logistics Market by Mode of Transport
- 8.3.4.4.3 South Korea Secure Logistics Market by Application
- 8.3.4.5 Singapore Secure Logistics Market
- 8.3.4.5.1 Singapore Secure Logistics Market by Type
- 8.3.4.5.2 Singapore Secure Logistics Market by Mode of Transport
- 8.3.4.5.3 Singapore Secure Logistics Market by Application
- 8.3.4.6 Malaysia Secure Logistics Market
- 8.3.4.6.1 Malaysia Secure Logistics Market by Type
- 8.3.4.6.2 Malaysia Secure Logistics Market by Mode of Transport
- 8.3.4.6.3 Malaysia Secure Logistics Market by Application
- 8.3.4.7 Rest of Asia Pacific Secure Logistics Market
- 8.3.4.7.1 Rest of Asia Pacific Secure Logistics Market by Type
- 8.3.4.7.2 Rest of Asia Pacific Secure Logistics Market by Mode of Transport
- 8.3.4.7.3 Rest of Asia Pacific Secure Logistics Market by Application
- 8.3.4.1 China Secure Logistics Market
- 8.3.1 Asia Pacific Secure Logistics Market by Type
- 8.4 LAMEA Secure Logistics Market
- 8.4.1 LAMEA Secure Logistics Market by Type
- 8.4.1.1 LAMEA Static Market by Country
- 8.4.1.2 LAMEA Mobile Market by Country
- 8.4.2 LAMEA Secure Logistics Market by Mode of Transport
- 8.4.2.1 LAMEA Roadways Market by Country
- 8.4.2.2 LAMEA Railways Market by Country
- 8.4.2.3 LAMEA Airways Market by Country
- 8.4.3 LAMEA Secure Logistics Market by Application
- 8.4.3.1 LAMEA Cash Management Market by Country
- 8.4.3.2 LAMEA Diamonds, Jewellery & Precious Metal Market by Country
- 8.4.3.3 LAMEA Manufacturing Market by Country
- 8.4.3.4 LAMEA Others Market by Country
- 8.4.4 LAMEA Secure Logistics Market by Country
- 8.4.4.1 Brazil Secure Logistics Market
- 8.4.4.1.1 Brazil Secure Logistics Market by Type
- 8.4.4.1.2 Brazil Secure Logistics Market by Mode of Transport
- 8.4.4.1.3 Brazil Secure Logistics Market by Application
- 8.4.4.2 Argentina Secure Logistics Market
- 8.4.4.2.1 Argentina Secure Logistics Market by Type
- 8.4.4.2.2 Argentina Secure Logistics Market by Mode of Transport
- 8.4.4.2.3 Argentina Secure Logistics Market by Application
- 8.4.4.3 UAE Secure Logistics Market
- 8.4.4.3.1 UAE Secure Logistics Market by Type
- 8.4.4.3.2 UAE Secure Logistics Market by Mode of Transport
- 8.4.4.3.3 UAE Secure Logistics Market by Application
- 8.4.4.4 Saudi Arabia Secure Logistics Market
- 8.4.4.4.1 Saudi Arabia Secure Logistics Market by Type
- 8.4.4.4.2 Saudi Arabia Secure Logistics Market by Mode of Transport
- 8.4.4.4.3 Saudi Arabia Secure Logistics Market by Application
- 8.4.4.5 South Africa Secure Logistics Market
- 8.4.4.5.1 South Africa Secure Logistics Market by Type
- 8.4.4.5.2 South Africa Secure Logistics Market by Mode of Transport
- 8.4.4.5.3 South Africa Secure Logistics Market by Application
- 8.4.4.6 Nigeria Secure Logistics Market
- 8.4.4.6.1 Nigeria Secure Logistics Market by Type
- 8.4.4.6.2 Nigeria Secure Logistics Market by Mode of Transport
- 8.4.4.6.3 Nigeria Secure Logistics Market by Application
- 8.4.4.7 Rest of LAMEA Secure Logistics Market
- 8.4.4.7.1 Rest of LAMEA Secure Logistics Market by Type
- 8.4.4.7.2 Rest of LAMEA Secure Logistics Market by Mode of Transport
- 8.4.4.7.3 Rest of LAMEA Secure Logistics Market by Application
- 8.4.4.1 Brazil Secure Logistics Market
- 8.4.1 LAMEA Secure Logistics Market by Type
Chapter 9. Company Profiles
- 9.1 Garda World Security Corporation (GardaWorld) (BC Partners)
- 9.1.1 Company Overview
- 9.1.2 Recent strategies and developments:
- 9.1.2.1 Partnerships, Collaborations, and Agreements:
- 9.1.2.2 Product Launches and Product Expansions:
- 9.1.2.3 Acquisition and Mergers:
- 9.1.3 SWOT Analysis
- 9.2 Lemuir Group
- 9.2.1 Company Overview
- 9.3 Securitas AB
- 9.3.1 Company Overview
- 9.3.2 Financial Analysis
- 9.3.3 Segmental and Regional Analysis
- 9.3.4 Recent strategies and developments:
- 9.3.4.1 Acquisition and Mergers:
- 9.3.5 SWOT Analysis
- 9.4 Brink's Incorporated (Brink's)
- 9.4.1 Company Overview
- 9.4.2 Financial Analysis
- 9.4.3 Regional Analysis
- 9.4.4 Recent strategies and developments:
- 9.4.4.1 Partnerships, Collaborations, and Agreements:
- 9.4.4.2 Acquisition and Mergers:
- 9.4.5 SWOT Analysis
- 9.5 PlanITROI, Inc.
- 9.5.1 Company Overview
- 9.5.2 SWOT Analysis
- 9.6 CargoGuard GmbH
- 9.6.1 Company Overview
- 9.7 CMS Info Systems Private Limited (CMS)
- 9.7.1 Company Overview
- 9.7.2 Financial Analysis
- 9.7.3 Segmental Analysis
- 9.7.4 SWOT Analysis
- 9.8 Prosegur
- 9.8.1 Company Overview
- 9.8.2 Financial Analysis
- 9.8.3 Segmental and Regional Analysis
- 9.8.4 Recent strategies and developments:
- 9.8.4.1 Partnerships, Collaborations, and Agreements:
- 9.8.4.2 Product Launches and Product Expansions:
- 9.8.5 SWOT Analysis
- 9.9 Allied Universal
- 9.9.1 Company Overview
- 9.9.2 Recent strategies and developments:
- 9.9.2.1 Partnerships, Collaborations, and Agreements:
- 9.9.2.2 Acquisition and Mergers:
- 9.9.3 SWOT Analysis
- 9.10. Secure Logistics LLC
- 9.10.1 Company Overview
- 9.10.2 SWOT Analysis
