|
|
市場調査レポート
商品コード
1374262
リン酸の世界市場規模、シェア、産業動向分析レポート:供給源タイプ別、用途別、地域別展望と予測、2023年~2030年Global Phosphoric Acid Market Size, Share & Industry Trends Analysis Report By Source Type (Wet Process, and Thermal Process), By Application, By Regional Outlook and Forecast, 2023 - 2030 |
||||||
|
|
|||||||
|
|||||||


| リン酸の世界市場規模、シェア、産業動向分析レポート:供給源タイプ別、用途別、地域別展望と予測、2023年~2030年 |
|
出版日: 2023年09月30日
発行: KBV Research
ページ情報: 英文 305 Pages
納期: 即納可能
|

- 全表示
- 概要
- 図表
- 目次
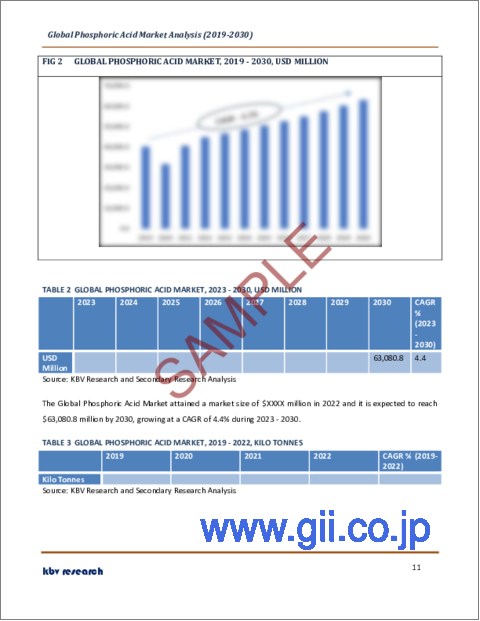
リン酸市場規模は、予測期間中にCAGR 4.4%で成長し、2030年には631億米ドルに達すると予測されます。2022年の市場規模は44,485.6キロトンに達し、3.8%の成長を遂げる(2019-2022年)。
しかし、リン酸製造、特に湿式プロセスによるリン酸化石膏廃棄物の発生は、重大な環境問題です。リン石膏は、重金属やラジウム、ウランなどの放射性元素を含む有害な不純物を含む可能性のある製品別です。リン鉱石の処分と管理には、厳しい環境規制と排出基準が適用されます。これらの規制を満たすには、環境汚染を防ぐためにコストのかかる処理・処分方法が必要になることが多いです。持続可能性と責任ある生産がますます重視される時代には、リン酸化石膏廃棄物への対処が市場の評判と長期的な存続にとって不可欠になります。従って、これらの要因はリン酸生産の成長に悪影響を及ぼすと予想されます。
用途別展望
市場は用途別に、肥料、飼料・食品添加物、水処理薬品、洗剤、金属処理、工業用、その他に区分されます。肥料セグメントは2022年の市場で最大の収益シェアを占めました。リン酸はリン酸塩(P2O5)の形で植物に必須栄養素を提供します。リンは窒素、カリウムとともに植物が必要とする三大栄養素の一つです。エネルギー伝達、光合成、根の発育など、植物の様々なプロセスにおいて重要な役割を果たしています。リン酸は、他の肥料と併用することで、植物による養分の取り込み効率を全体的に向上させることができます。それは適用された栄養素の多くが植物に利用できることを保障する浸出か流出による栄養損失を減らすのを助けることができます。
源のタイプの展望
ソースタイプ別に見ると、市場はウェットプロセスとサーマルプロセスに二分されます。サーマルプロセス・セグメンテーションは、2022年の市場でかなりの成長率を獲得しました。熱プロセスによって作り出されるリン酸は普通高い純度です。このため、エレクトロニクスや半導体産業など、不純物や汚染物質の存在を最小限に抑えなければならない用途に適しています。熱プロセスは製品別として石膏を生成しないです。その結果、廃棄物の発生や石膏処分の必要性が減るため、環境に優しいと言えます。熱プロセスは大量の水を消費しないため、水資源が限られている地域では重要な考慮事項となります。
地域別展望
地域別に見ると、市場は北米、欧州、アジア太平洋、LAMEAに区分されます。アジア太平洋セグメントは、2022年の市場で最も高い収益シェアを獲得しました。アジア太平洋地域には、中国やインドなど世界で最も人口の多い国々があります。これらの国々では、リン酸肥料を生産するためにリン酸を必要とする農業部門が急速に拡大しています。成長する人口に与えるために穀物の収穫を高める必要性は農業のリン酸の消費を運転しました。これらの要因はアジア太平洋区分のリン酸のための要求を後押しします。
目次
第1章 市場範囲と調査手法
- 市場の定義
- 目的
- 市場範囲
- セグメンテーション
- 調査手法
第2章 市場の概要
- 主なハイライト
第3章 市場概要
- イントロダクション
- 概要
- 市場構成とシナリオ
- 概要
- 市場に影響を与える主な要因
- 市場促進要因
- 市場抑制要因
- ポーターのファイブフォース分析
第4章 世界のリン酸市場:ソースタイプ別
- 世界の湿式プロセス市場:地域別
- 世界の熱プロセス市場:地域別
第5章 世界のリン酸市場:用途別
- 世界の肥料市場:地域別
- 世界の飼料および食品添加物市場:地域別
- 世界の水処理薬品市場:地域別
- 世界の洗剤市場:地域別
- 世界の金属処理市場:地域別
- 世界の産業用市場:地域別
- 世界のその他の市場:地域別
第6章 世界のリン酸市場:地域別
- 北米
- 北米の市場:国別
- 米国
- メキシコ
- カナダ
- その他北米地域
- 北米の市場:国別
- 欧州
- 欧州の市場:国別
- ロシア
- フランス
- ドイツ
- 英国
- スペイン
- イタリア
- その他欧州地域
- 欧州の市場:国別
- アジア太平洋
- アジア太平洋の市場:国別
- 中国
- インド
- タイ
- 日本
- 韓国
- オーストラリア
- その他アジア太平洋地域
- アジア太平洋の市場:国別
- ラテンアメリカ・中東・アフリカ
- ラテンアメリカ・中東・アフリカの市場:国別
- ブラジル
- アルゼンチン
- 南アフリカ
- ナイジェリア
- モロッコ
- チリ
- その他ラテンアメリカ・中東・アフリカ地域
- ラテンアメリカ・中東・アフリカの市場:国別
第7章 企業プロファイル
- PJSC"PhosAgro"
- IFFCO(Cooperative Societies of India)
- EuroChem Group AG(AIM Capital Ltd)
- OCP SA
- ICL Group Ltd(Israel Corp.)
- Innophos Holdings, Inc(One Rock Capital Partners, LLC)
- Gujarat State Fertilizers & Chemicals Limited
- Yara International ASA
- The Mosaic Company
- Nutrien Limited
第8章 リン酸市場の勝利の必須条件
LIST OF TABLES
- TABLE 1 Global Phosphoric Acid Market, 2019 - 2022, USD Million
- TABLE 2 Global Phosphoric Acid Market, 2023 - 2030, USD Million
- TABLE 3 Global Phosphoric Acid Market, 2019 - 2022, Kilo Tonnes
- TABLE 4 Global Phosphoric Acid Market, 2023 - 2030, Kilo Tonnes
- TABLE 5 Global Phosphoric Acid Market by Source Type, 2019 - 2022, USD Million
- TABLE 6 Global Phosphoric Acid Market by Source Type, 2023 - 2030, USD Million
- TABLE 7 Global Phosphoric Acid Market by Source Type, 2019 - 2022, Kilo Tonnes
- TABLE 8 Global Phosphoric Acid Market by Source Type, 2023 - 2030, Kilo Tonnes
- TABLE 9 Global Wet Process Market by Region, 2019 - 2022, USD Million
- TABLE 10 Global Wet Process Market by Region, 2023 - 2030, USD Million
- TABLE 11 Global Wet Process Market by Region, 2019 - 2022, Kilo Tonnes
- TABLE 12 Global Wet Process Market by Region, 2023 - 2030, Kilo Tonnes
- TABLE 13 Global Thermal Process Market by Region, 2019 - 2022, USD Million
- TABLE 14 Global Thermal Process Market by Region, 2023 - 2030, USD Million
- TABLE 15 Global Thermal Process Market by Region, 2019 - 2022, Kilo Tonnes
- TABLE 16 Global Thermal Process Market by Region, 2023 - 2030, Kilo Tonnes
- TABLE 17 Global Phosphoric Acid Market by Application, 2019 - 2022, USD Million
- TABLE 18 Global Phosphoric Acid Market by Application, 2023 - 2030, USD Million
- TABLE 19 Global Phosphoric Acid Market by Application, 2019 - 2022, Kilo Tonnes
- TABLE 20 Global Phosphoric Acid Market by Application, 2023 - 2030, Kilo Tonnes
- TABLE 21 Global Fertilizers Market by Region, 2019 - 2022, USD Million
- TABLE 22 Global Fertilizers Market by Region, 2023 - 2030, USD Million
- TABLE 23 Global Fertilizers Market by Region, 2019 - 2022, Kilo Tonnes
- TABLE 24 Global Fertilizers Market by Region, 2023 - 2030, Kilo Tonnes
- TABLE 25 Global Feed & Food Additives Market by Region, 2019 - 2022, USD Million
- TABLE 26 Global Feed & Food Additives Market by Region, 2023 - 2030, USD Million
- TABLE 27 Global Feed & Food Additives Market by Region, 2019 - 2022, Kilo Tonnes
- TABLE 28 Global Feed & Food Additives Market by Region, 2023 - 2030, Kilo Tonnes
- TABLE 29 Global Water Treatment Chemicals Market by Region, 2019 - 2022, USD Million
- TABLE 30 Global Water Treatment Chemicals Market by Region, 2023 - 2030, USD Million
- TABLE 31 Global Water Treatment Chemicals Market by Region, 2019 - 2022, Kilo Tonnes
- TABLE 32 Global Water Treatment Chemicals Market by Region, 2023 - 2030, Kilo Tonnes
- TABLE 33 Global Detergents Market by Region, 2019 - 2022, USD Million
- TABLE 34 Global Detergents Market by Region, 2023 - 2030, USD Million
- TABLE 35 Global Detergents Market by Region, 2019 - 2022, Kilo Tonnes
- TABLE 36 Global Detergents Market by Region, 2023 - 2030, Kilo Tonnes
- TABLE 37 Global Metal Treatment Market by Region, 2019 - 2022, USD Million
- TABLE 38 Global Metal Treatment Market by Region, 2023 - 2030, USD Million
- TABLE 39 Global Metal Treatment Market by Region, 2019 - 2022, Kilo Tonnes
- TABLE 40 Global Metal Treatment Market by Region, 2023 - 2030, Kilo Tonnes
- TABLE 41 Global Industrial Use Market by Region, 2019 - 2022, USD Million
- TABLE 42 Global Industrial Use Market by Region, 2023 - 2030, USD Million
- TABLE 43 Global Industrial Use Market by Region, 2019 - 2022, Kilo Tonnes
- TABLE 44 Global Industrial Use Market by Region, 2023 - 2030, Kilo Tonnes
- TABLE 45 Global Others Market by Region, 2019 - 2022, USD Million
- TABLE 46 Global Others Market by Region, 2023 - 2030, USD Million
- TABLE 47 Global Others Market by Region, 2019 - 2022, Kilo Tonnes
- TABLE 48 Global Others Market by Region, 2023 - 2030, Kilo Tonnes
- TABLE 49 Global Phosphoric Acid Market by Region, 2019 - 2022, USD Million
- TABLE 50 Global Phosphoric Acid Market by Region, 2023 - 2030, USD Million
- TABLE 51 Global Phosphoric Acid Market by Region, 2019 - 2022, Kilo Tonnes
- TABLE 52 Global Phosphoric Acid Market by Region, 2023 - 2030, Kilo Tonnes
- TABLE 53 North America Phosphoric Acid Market, 2019 - 2022, USD Million
- TABLE 54 North America Phosphoric Acid Market, 2023 - 2030, USD Million
- TABLE 55 North America Phosphoric Acid Market, 2019 - 2022, Kilo Tonnes
- TABLE 56 North America Phosphoric Acid Market, 2023 - 2030, Kilo Tonnes
- TABLE 57 North America Phosphoric Acid Market by Source Type, 2019 - 2022, USD Million
- TABLE 58 North America Phosphoric Acid Market by Source Type, 2023 - 2030, USD Million
- TABLE 59 North America Phosphoric Acid Market by Source Type, 2019 - 2022, Kilo Tonnes
- TABLE 60 North America Phosphoric Acid Market by Source Type, 2023 - 2030, Kilo Tonnes
- TABLE 61 North America Wet Process Market by Country, 2019 - 2022, USD Million
- TABLE 62 North America Wet Process Market by Country, 2023 - 2030, USD Million
- TABLE 63 North America Wet Process Market by Country, 2019 - 2022, Kilo Tonnes
- TABLE 64 North America Wet Process Market by Country, 2023 - 2030, Kilo Tonnes
- TABLE 65 North America Thermal Process Market by Country, 2019 - 2022, USD Million
- TABLE 66 North America Thermal Process Market by Country, 2023 - 2030, USD Million
- TABLE 67 North America Thermal Process Market by Country, 2019 - 2022, Kilo Tonnes
- TABLE 68 North America Thermal Process Market by Country, 2023 - 2030, Kilo Tonnes
- TABLE 69 North America Phosphoric Acid Market by Application, 2019 - 2022, USD Million
- TABLE 70 North America Phosphoric Acid Market by Application, 2023 - 2030, USD Million
- TABLE 71 North America Phosphoric Acid Market by Application, 2019 - 2022, Kilo Tonnes
- TABLE 72 North America Phosphoric Acid Market by Application, 2023 - 2030, Kilo Tonnes
- TABLE 73 North America Fertilizers Market by Country, 2019 - 2022, USD Million
- TABLE 74 North America Fertilizers Market by Country, 2023 - 2030, USD Million
- TABLE 75 North America Fertilizers Market by Country, 2019 - 2022, Kilo Tonnes
- TABLE 76 North America Fertilizers Market by Country, 2023 - 2030, Kilo Tonnes
- TABLE 77 North America Feed & Food Additives Market by Country, 2019 - 2022, USD Million
- TABLE 78 North America Feed & Food Additives Market by Country, 2023 - 2030, USD Million
- TABLE 79 North America Feed & Food Additives Market by Country, 2019 - 2022, Kilo Tonnes
- TABLE 80 North America Feed & Food Additives Market by Country, 2023 - 2030, Kilo Tonnes
- TABLE 81 North America Water Treatment Chemicals Market by Country, 2019 - 2022, USD Million
- TABLE 82 North America Water Treatment Chemicals Market by Country, 2023 - 2030, USD Million
- TABLE 83 North America Water Treatment Chemicals Market by Country, 2019 - 2022, Kilo Tonnes
- TABLE 84 North America Water Treatment Chemicals Market by Country, 2023 - 2030, Kilo Tonnes
- TABLE 85 North America Detergents Market by Country, 2019 - 2022, USD Million
- TABLE 86 North America Detergents Market by Country, 2023 - 2030, USD Million
- TABLE 87 North America Detergents Market by Country, 2019 - 2022, Kilo Tonnes
- TABLE 88 North America Detergents Market by Country, 2023 - 2030, Kilo Tonnes
- TABLE 89 North America Metal Treatment Market by Country, 2019 - 2022, USD Million
- TABLE 90 North America Metal Treatment Market by Country, 2023 - 2030, USD Million
- TABLE 91 North America Metal Treatment Market by Country, 2019 - 2022, Kilo Tonnes
- TABLE 92 North America Metal Treatment Market by Country, 2023 - 2030, Kilo Tonnes
- TABLE 93 North America Industrial Use Market by Country, 2019 - 2022, USD Million
- TABLE 94 North America Industrial Use Market by Country, 2023 - 2030, USD Million
- TABLE 95 North America Industrial Use Market by Country, 2019 - 2022, Kilo Tonnes
- TABLE 96 North America Industrial Use Market by Country, 2023 - 2030, Kilo Tonnes
- TABLE 97 North America Others Market by Country, 2019 - 2022, USD Million
- TABLE 98 North America Others Market by Country, 2023 - 2030, USD Million
- TABLE 99 North America Others Market by Country, 2019 - 2022, Kilo Tonnes
- TABLE 100 North America Others Market by Country, 2023 - 2030, Kilo Tonnes
- TABLE 101 North America Phosphoric Acid Market by Country, 2019 - 2022, USD Million
- TABLE 102 North America Phosphoric Acid Market by Country, 2023 - 2030, USD Million
- TABLE 103 North America Phosphoric Acid Market by Country, 2019 - 2022, Kilo Tonnes
- TABLE 104 North America Phosphoric Acid Market by Country, 2023 - 2030, Kilo Tonnes
- TABLE 105 US Phosphoric Acid Market, 2019 - 2022, USD Million
- TABLE 106 US Phosphoric Acid Market, 2023 - 2030, USD Million
- TABLE 107 US Phosphoric Acid Market, 2019 - 2022, Kilo Tonnes
- TABLE 108 US Phosphoric Acid Market, 2023 - 2030, Kilo Tonnes
- TABLE 109 US Phosphoric Acid Market by Source Type, 2019 - 2022, USD Million
- TABLE 110 US Phosphoric Acid Market by Source Type, 2023 - 2030, USD Million
- TABLE 111 US Phosphoric Acid Market by Source Type, 2019 - 2022, Kilo Tonnes
- TABLE 112 US Phosphoric Acid Market by Source Type, 2023 - 2030, Kilo Tonnes
- TABLE 113 US Phosphoric Acid Market by Application, 2019 - 2022, USD Million
- TABLE 114 US Phosphoric Acid Market by Application, 2023 - 2030, USD Million
- TABLE 115 US Phosphoric Acid Market by Application, 2019 - 2022, Kilo Tonnes
- TABLE 116 US Phosphoric Acid Market by Application, 2023 - 2030, Kilo Tonnes
- TABLE 117 Mexico Phosphoric Acid Market, 2019 - 2022, USD Million
- TABLE 118 Mexico Phosphoric Acid Market, 2023 - 2030, USD Million
- TABLE 119 Mexico Phosphoric Acid Market, 2019 - 2022, Kilo Tonnes
- TABLE 120 Mexico Phosphoric Acid Market, 2023 - 2030, Kilo Tonnes
- TABLE 121 Mexico Phosphoric Acid Market by Source Type, 2019 - 2022, USD Million
- TABLE 122 Mexico Phosphoric Acid Market by Source Type, 2023 - 2030, USD Million
- TABLE 123 Mexico Phosphoric Acid Market by Source Type, 2019 - 2022, Kilo Tonnes
- TABLE 124 Mexico Phosphoric Acid Market by Source Type, 2023 - 2030, Kilo Tonnes
- TABLE 125 Mexico Phosphoric Acid Market by Application, 2019 - 2022, USD Million
- TABLE 126 Mexico Phosphoric Acid Market by Application, 2023 - 2030, USD Million
- TABLE 127 Mexico Phosphoric Acid Market by Application, 2019 - 2022, Kilo Tonnes
- TABLE 128 Mexico Phosphoric Acid Market by Application, 2023 - 2030, Kilo Tonnes
- TABLE 129 Canada Phosphoric Acid Market, 2019 - 2022, USD Million
- TABLE 130 Canada Phosphoric Acid Market, 2023 - 2030, USD Million
- TABLE 131 Canada Phosphoric Acid Market, 2019 - 2022, Kilo Tonnes
- TABLE 132 Canada Phosphoric Acid Market, 2023 - 2030, Kilo Tonnes
- TABLE 133 Canada Phosphoric Acid Market by Source Type, 2019 - 2022, USD Million
- TABLE 134 Canada Phosphoric Acid Market by Source Type, 2023 - 2030, USD Million
- TABLE 135 Canada Phosphoric Acid Market by Source Type, 2019 - 2022, Kilo Tonnes
- TABLE 136 Canada Phosphoric Acid Market by Source Type, 2023 - 2030, Kilo Tonnes
- TABLE 137 Canada Phosphoric Acid Market by Application, 2019 - 2022, USD Million
- TABLE 138 Canada Phosphoric Acid Market by Application, 2023 - 2030, USD Million
- TABLE 139 Canada Phosphoric Acid Market by Application, 2019 - 2022, Kilo Tonnes
- TABLE 140 Canada Phosphoric Acid Market by Application, 2023 - 2030, Kilo Tonnes
- TABLE 141 Rest of North America Phosphoric Acid Market, 2019 - 2022, USD Million
- TABLE 142 Rest of North America Phosphoric Acid Market, 2023 - 2030, USD Million
- TABLE 143 Rest of North America Phosphoric Acid Market, 2019 - 2022, Kilo Tonnes
- TABLE 144 Rest of North America Phosphoric Acid Market, 2023 - 2030, Kilo Tonnes
- TABLE 145 Rest of North America Phosphoric Acid Market by Source Type, 2019 - 2022, USD Million
- TABLE 146 Rest of North America Phosphoric Acid Market by Source Type, 2023 - 2030, USD Million
- TABLE 147 Rest of North America Phosphoric Acid Market by Source Type, 2019 - 2022, Kilo Tonnes
- TABLE 148 Rest of North America Phosphoric Acid Market by Source Type, 2023 - 2030, Kilo Tonnes
- TABLE 149 Rest of North America Phosphoric Acid Market by Application, 2019 - 2022, USD Million
- TABLE 150 Rest of North America Phosphoric Acid Market by Application, 2023 - 2030, USD Million
- TABLE 151 Rest of North America Phosphoric Acid Market by Application, 2019 - 2022, Kilo Tonnes
- TABLE 152 Rest of North America Phosphoric Acid Market by Application, 2023 - 2030, Kilo Tonnes
- TABLE 153 Europe Phosphoric Acid Market, 2019 - 2022, USD Million
- TABLE 154 Europe Phosphoric Acid Market, 2023 - 2030, USD Million
- TABLE 155 Europe Phosphoric Acid Market, 2019 - 2022, Kilo Tonnes
- TABLE 156 Europe Phosphoric Acid Market, 2023 - 2030, Kilo Tonnes
- TABLE 157 Europe Phosphoric Acid Market by Source Type, 2019 - 2022, USD Million
- TABLE 158 Europe Phosphoric Acid Market by Source Type, 2023 - 2030, USD Million
- TABLE 159 Europe Phosphoric Acid Market by Source Type, 2019 - 2022, Kilo Tonnes
- TABLE 160 Europe Phosphoric Acid Market by Source Type, 2023 - 2030, Kilo Tonnes
- TABLE 161 Europe Wet Process Market by Country, 2019 - 2022, USD Million
- TABLE 162 Europe Wet Process Market by Country, 2023 - 2030, USD Million
- TABLE 163 Europe Wet Process Market by Country, 2019 - 2022, Kilo Tonnes
- TABLE 164 Europe Wet Process Market by Country, 2023 - 2030, Kilo Tonnes
- TABLE 165 Europe Thermal Process Market by Country, 2019 - 2022, USD Million
- TABLE 166 Europe Thermal Process Market by Country, 2023 - 2030, USD Million
- TABLE 167 Europe Thermal Process Market by Country, 2019 - 2022, Kilo Tonnes
- TABLE 168 Europe Thermal Process Market by Country, 2023 - 2030, Kilo Tonnes
- TABLE 169 Europe Phosphoric Acid Market by Application, 2019 - 2022, USD Million
- TABLE 170 Europe Phosphoric Acid Market by Application, 2023 - 2030, USD Million
- TABLE 171 Europe Phosphoric Acid Market by Application, 2019 - 2022, Kilo Tonnes
- TABLE 172 Europe Phosphoric Acid Market by Application, 2023 - 2030, Kilo Tonnes
- TABLE 173 Europe Fertilizers Market by Country, 2019 - 2022, USD Million
- TABLE 174 Europe Fertilizers Market by Country, 2023 - 2030, USD Million
- TABLE 175 Europe Fertilizers Market by Country, 2019 - 2022, Kilo Tonnes
- TABLE 176 Europe Fertilizers Market by Country, 2023 - 2030, Kilo Tonnes
- TABLE 177 Europe Feed & Food Additives Market by Country, 2019 - 2022, USD Million
- TABLE 178 Europe Feed & Food Additives Market by Country, 2023 - 2030, USD Million
- TABLE 179 Europe Feed & Food Additives Market by Country, 2019 - 2022, Kilo Tonnes
- TABLE 180 Europe Feed & Food Additives Market by Country, 2023 - 2030, Kilo Tonnes
- TABLE 181 Europe Water Treatment Chemicals Market by Country, 2019 - 2022, USD Million
- TABLE 182 Europe Water Treatment Chemicals Market by Country, 2023 - 2030, USD Million
- TABLE 183 Europe Water Treatment Chemicals Market by Country, 2019 - 2022, Kilo Tonnes
- TABLE 184 Europe Water Treatment Chemicals Market by Country, 2023 - 2030, Kilo Tonnes
- TABLE 185 Europe Detergents Market by Country, 2019 - 2022, USD Million
- TABLE 186 Europe Detergents Market by Country, 2023 - 2030, USD Million
- TABLE 187 Europe Detergents Market by Country, 2019 - 2022, Kilo Tonnes
- TABLE 188 Europe Detergents Market by Country, 2023 - 2030, Kilo Tonnes
- TABLE 189 Europe Metal Treatment Market by Country, 2019 - 2022, USD Million
- TABLE 190 Europe Metal Treatment Market by Country, 2023 - 2030, USD Million
- TABLE 191 Europe Metal Treatment Market by Country, 2019 - 2022, Kilo Tonnes
- TABLE 192 Europe Metal Treatment Market by Country, 2023 - 2030, Kilo Tonnes
- TABLE 193 Europe Industrial Use Market by Country, 2019 - 2022, USD Million
- TABLE 194 Europe Industrial Use Market by Country, 2023 - 2030, USD Million
- TABLE 195 Europe Industrial Use Market by Country, 2019 - 2022, Kilo Tonnes
- TABLE 196 Europe Industrial Use Market by Country, 2023 - 2030, Kilo Tonnes
- TABLE 197 Europe Others Market by Country, 2019 - 2022, USD Million
- TABLE 198 Europe Others Market by Country, 2023 - 2030, USD Million
- TABLE 199 Europe Others Market by Country, 2019 - 2022, Kilo Tonnes
- TABLE 200 Europe Others Market by Country, 2023 - 2030, Kilo Tonnes
- TABLE 201 Europe Phosphoric Acid Market by Country, 2019 - 2022, USD Million
- TABLE 202 Europe Phosphoric Acid Market by Country, 2023 - 2030, USD Million
- TABLE 203 Europe Phosphoric Acid Market by Country, 2019 - 2022, Kilo Tonnes
- TABLE 204 Europe Phosphoric Acid Market by Country, 2023 - 2030, Kilo Tonnes
- TABLE 205 Russia Phosphoric Acid Market, 2019 - 2022, USD Million
- TABLE 206 Russia Phosphoric Acid Market, 2023 - 2030, USD Million
- TABLE 207 Russia Phosphoric Acid Market, 2019 - 2022, Kilo Tonnes
- TABLE 208 Russia Phosphoric Acid Market, 2023 - 2030, Kilo Tonnes
- TABLE 209 Russia Phosphoric Acid Market by Source Type, 2019 - 2022, USD Million
- TABLE 210 Russia Phosphoric Acid Market by Source Type, 2023 - 2030, USD Million
- TABLE 211 Russia Phosphoric Acid Market by Source Type, 2019 - 2022, Kilo Tonnes
- TABLE 212 Russia Phosphoric Acid Market by Source Type, 2023 - 2030, Kilo Tonnes
- TABLE 213 Russia Phosphoric Acid Market by Application, 2019 - 2022, USD Million
- TABLE 214 Russia Phosphoric Acid Market by Application, 2023 - 2030, USD Million
- TABLE 215 Russia Phosphoric Acid Market by Application, 2019 - 2022, Kilo Tonnes
- TABLE 216 Russia Phosphoric Acid Market by Application, 2023 - 2030, Kilo Tonnes
- TABLE 217 France Phosphoric Acid Market, 2019 - 2022, USD Million
- TABLE 218 France Phosphoric Acid Market, 2023 - 2030, USD Million
- TABLE 219 France Phosphoric Acid Market, 2019 - 2022, Kilo Tonnes
- TABLE 220 France Phosphoric Acid Market, 2023 - 2030, Kilo Tonnes
- TABLE 221 France Phosphoric Acid Market by Source Type, 2019 - 2022, USD Million
- TABLE 222 France Phosphoric Acid Market by Source Type, 2023 - 2030, USD Million
- TABLE 223 France Phosphoric Acid Market by Source Type, 2019 - 2022, Kilo Tonnes
- TABLE 224 France Phosphoric Acid Market by Source Type, 2023 - 2030, Kilo Tonnes
- TABLE 225 France Phosphoric Acid Market by Application, 2019 - 2022, USD Million
- TABLE 226 France Phosphoric Acid Market by Application, 2023 - 2030, USD Million
- TABLE 227 France Phosphoric Acid Market by Application, 2019 - 2022, Kilo Tonnes
- TABLE 228 France Phosphoric Acid Market by Application, 2023 - 2030, Kilo Tonnes
- TABLE 229 Germany Phosphoric Acid Market, 2019 - 2022, USD Million
- TABLE 230 Germany Phosphoric Acid Market, 2023 - 2030, USD Million
- TABLE 231 Germany Phosphoric Acid Market, 2019 - 2022, Kilo Tonnes
- TABLE 232 Germany Phosphoric Acid Market, 2023 - 2030, Kilo Tonnes
- TABLE 233 Germany Phosphoric Acid Market by Source Type, 2019 - 2022, USD Million
- TABLE 234 Germany Phosphoric Acid Market by Source Type, 2023 - 2030, USD Million
- TABLE 235 Germany Phosphoric Acid Market by Source Type, 2019 - 2022, Kilo Tonnes
- TABLE 236 Germany Phosphoric Acid Market by Source Type, 2023 - 2030, Kilo Tonnes
- TABLE 237 Germany Phosphoric Acid Market by Application, 2019 - 2022, USD Million
- TABLE 238 Germany Phosphoric Acid Market by Application, 2023 - 2030, USD Million
- TABLE 239 Germany Phosphoric Acid Market by Application, 2019 - 2022, Kilo Tonnes
- TABLE 240 Germany Phosphoric Acid Market by Application, 2023 - 2030, Kilo Tonnes
The Global Phosphoric Acid Market size is expected to reach $63.1 billion by 2030, rising at a market growth of 4.4% CAGR during the forecast period. In the year 2022, the market attained a volume of 44,485.6 Kilo Tonnes, experiencing a growth of 3.8% (2019-2022).
Phosphoric acid is a strong acid, and its use in detergents provides effective cleaning power for the removal of mineral deposits, rust, and scale. It is especially useful for descaling and deliming in dishwashing machines and industrial equipment. Hence, the detergents segment acquired $3,159.3 million revenue in the market in 2022. In industrial cleaning applications, phosphoric acid can be used to decontaminate surfaces by neutralizing and dissolving hazardous substances. In detergents that contain both acidic and alkaline ingredients, it can be used to adjust the pH level to the desired range. This ensures that the detergent is effective for specific cleaning tasks. Some of the factors impacting the market are growing awareness of sustainable agricultural practices, rising applications of phosphoric acid in the food & beverage industry, and waste generation during the production of phosphoric acid.
Phosphoric acid-based fertilizers provide a precise and efficient way to deliver phosphorus (P) to plants. Precision agriculture techniques, like variable rate application, allow farmers to apply phosphorus fertilizers only where and when needed, reducing waste and environmental runoff. Sustainable farming practices emphasize reducing the environmental impact of agriculture, including minimizing nutrient runoff into water bodies. Phosphoric acid-based fertilizers can be formulated to release nutrients slowly, reducing the risk of phosphorus pollution in waterways. Phosphorus is crucial for plant growth, and its availability is essential for crop yields. Additionally, Phosphoric acid can enhance the overall flavor of particular food and beverage products. It is often combined with other acids to create complex and appealing taste profiles. This flavor enhancement is particularly important in products like sauces, condiments, and processed meats. Phosphoric acid's acidic nature contributes to its preservative properties. By generating an acidic environment that prevents the growth of germs and bacteria that cause spoiling, it can aid in extending the shelf life of various foods and beverages. As a result, the market will grow in the coming years.
However, the generation of phosphogypsum waste during phosphoric acid production, especially through the wet process, is a significant environmental concern. Phosphogypsum is a byproduct that contains potentially harmful impurities, including heavy metals and radioactive elements like radium and uranium. Stringent environmental regulations and emissions standards govern the disposal and management of phosphogypsum. Meeting these regulations often requires costly treatment and disposal methods to prevent environmental contamination. In an era of increasing emphasis on sustainability and responsible production, addressing phosphogypsum waste becomes essential for the market's reputation and long-term viability. Therefore, these factors are expected to have a negative impact on the growth of phosphoric acid production.
Application Outlook
Based on application, the market is segmented into fertilizers, feed & food additives, water treatment chemicals, detergents, metal treatment, industrial use, and others. The fertilizers segment held the largest revenue share in the market in 2022. Phosphoric acid provides an essential nutrient to plants in the form of phosphate (P2O5). Phosphorus is one of the three primary macronutrients that plants require, along with nitrogen and potassium. It plays a crucial role in various plant processes, such as energy transfer, photosynthesis, and root development. When used in combination with other fertilizers, phosphoric acid can improve the overall efficiency of nutrient uptake by plants. It can help reduce nutrient losses through leaching or runoff, ensuring that more of the applied nutrients are available to the plants.
Source Type Outlook
By source type, the market is bifurcated into wet process and thermal process. The thermal process segment acquired a considerable growth rate in the market in 2022. Phosphoric acid produced by the thermal process is typically of high purity. This makes it suitable for applications where the presence of impurities or contaminants must be minimized, such as in the electronics and semiconductor industries. The thermal process does not produce gypsum as a byproduct. As a result, it can be seen as environmentally friendly, as it reduces the generation of waste materials and the need for gypsum disposal. The thermal process does not consume large volumes of water, which can be a significant consideration in regions with limited water resources.
Regional Outlook
By region, the market is segmented into North America, Europe, Asia Pacific, and LAMEA. The Asia Pacific segment procured the highest revenue share in the market in 2022. The Asia-Pacific region is home to some of the world's most populous countries, including China and India. These countries have rapidly expanded agricultural sectors that demand phosphoric acid to produce phosphate fertilizers. The need to increase crop yields to feed growing populations has driven the consumption of phosphoric acid in agriculture. These factors will boost the demand for phosphoric acid in the Asia Pacific segment.
The market research report covers the analysis of key stake holders of the market. Key companies profiled in the report include The Mosaic Company, PJSC "PhosAgro", Nutrien Limited, IFFCO, EuroChem Group AG (AIM Capital Ltd.), OCP SA, ICL Group Ltd. (Israel Corp.), Yara International ASA, Innophos Holdings, Inc. (One Rock Capital Partners, LLC), and Gujarat State Fertilizers & Chemicals Limited.
Scope of the Study
Market Segments covered in the Report:
By Source Type (Volume, Kilo Tonnes, USD Million, 2019-2030)
- Wet Process
- Thermal Process
By Application (Volume, Kilo Tonnes, USD Million, 2019-2030)
- Fertilizers
- Feed & Food Additives
- Water Treatment Chemicals
- Detergents
- Metal Treatment
- Industrial Use
- Others
By Geography (Volume, Kilo Tonnes, USD Million, 2019-2030)
- North America
- US
- Mexico
- Canada
- Rest of North America
- Europe
- Russia
- France
- Germany
- UK
- Spain
- Italy
- Rest of Europe
- Asia Pacific
- China
- India
- Thailand
- Japan
- South Korea
- Australia
- Rest of Asia Pacific
- LAMEA
- Brazil
- Argentina
- South Africa
- Nigeria
- Morocco
- Chile
- Rest of LAMEA
Companies Profiled
- The Mosaic Company
- PJSC "PhosAgro"
- Nutrien Limited
- IFFCO
- EuroChem Group AG (AIM Capital Ltd.)
- OCP SA
- ICL Group Ltd. (Israel Corp.)
- Yara International ASA
- Innophos Holdings, Inc. (One Rock Capital Partners, LLC)
- Gujarat State Fertilizers & Chemicals Limited
Unique Offerings from KBV Research
- Exhaustive coverage
- Highest number of market tables and figures
- Subscription based model available
- Guaranteed best price
- Assured post sales research support with 10% customization free
Table of Contents
Chapter 1. Market Scope & Methodology
- 1.1 Market Definition
- 1.2 Objectives
- 1.3 Market Scope
- 1.4 Segmentation
- 1.4.1 Global Phosphoric Acid Market, by Source Type
- 1.4.2 Global Phosphoric Acid Market, by Application
- 1.4.3 Global Phosphoric Acid Market, by Geography
- 1.5 Methodology for the research
Chapter 2. Market at a Glance
- 2.1 Key Highlights
Chapter 3. Market Overview
- 3.1 Introduction
- 3.1.1 Overview
- 3.1.1.1 Market Composition and Scenario
- 3.1.1 Overview
- 3.2 Key Factors Impacting the Market
- 3.2.1 Market Drivers
- 3.2.2 Market Restraints
- 3.3 Porter's Five Forces Analysis
Chapter 4. Global Phosphoric Acid Market by Source Type
- 4.1 Global Wet Process Market by Region
- 4.2 Global Thermal Process Market by Region
Chapter 5. Global Phosphoric Acid Market by Application
- 5.1 Global Fertilizers Market by Region
- 5.2 Global Feed & Food Additives Market by Region
- 5.3 Global Water Treatment Chemicals Market by Region
- 5.4 Global Detergents Market by Region
- 5.5 Global Metal Treatment Market by Region
- 5.6 Global Industrial Use Market by Region
- 5.7 Global Others Market by Region
Chapter 6. Global Phosphoric Acid Market by Region
- 6.1 North America Phosphoric Acid Market
- 6.1.1 North America Phosphoric Acid Market by Source Type
- 6.1.1.1 North America Wet Process Market by Country
- 6.1.1.2 North America Thermal Process Market by Country
- 6.1.2 North America Phosphoric Acid Market by Application
- 6.1.2.1 North America Fertilizers Market by Country
- 6.1.2.2 North America Feed & Food Additives Market by Country
- 6.1.2.3 North America Water Treatment Chemicals Market by Country
- 6.1.2.4 North America Detergents Market by Country
- 6.1.2.5 North America Metal Treatment Market by Country
- 6.1.2.6 North America Industrial Use Market by Country
- 6.1.2.7 North America Others Market by Country
- 6.1.3 North America Phosphoric Acid Market by Country
- 6.1.3.1 US Phosphoric Acid Market
- 6.1.3.1.1 US Phosphoric Acid Market by Source Type
- 6.1.3.1.2 US Phosphoric Acid Market by Application
- 6.1.3.2 Mexico Phosphoric Acid Market
- 6.1.3.2.1 Mexico Phosphoric Acid Market by Source Type
- 6.1.3.2.2 Mexico Phosphoric Acid Market by Application
- 6.1.3.3 Canada Phosphoric Acid Market
- 6.1.3.3.1 Canada Phosphoric Acid Market by Source Type
- 6.1.3.3.2 Canada Phosphoric Acid Market by Application
- 6.1.3.4 Rest of North America Phosphoric Acid Market
- 6.1.3.4.1 Rest of North America Phosphoric Acid Market by Source Type
- 6.1.3.4.2 Rest of North America Phosphoric Acid Market by Application
- 6.1.3.1 US Phosphoric Acid Market
- 6.1.1 North America Phosphoric Acid Market by Source Type
- 6.2 Europe Phosphoric Acid Market
- 6.2.1 Europe Phosphoric Acid Market by Source Type
- 6.2.1.1 Europe Wet Process Market by Country
- 6.2.1.2 Europe Thermal Process Market by Country
- 6.2.2 Europe Phosphoric Acid Market by Application
- 6.2.2.1 Europe Fertilizers Market by Country
- 6.2.2.2 Europe Feed & Food Additives Market by Country
- 6.2.2.3 Europe Water Treatment Chemicals Market by Country
- 6.2.2.4 Europe Detergents Market by Country
- 6.2.2.5 Europe Metal Treatment Market by Country
- 6.2.2.6 Europe Industrial Use Market by Country
- 6.2.2.7 Europe Others Market by Country
- 6.2.3 Europe Phosphoric Acid Market by Country
- 6.2.3.1 Russia Phosphoric Acid Market
- 6.2.3.1.1 Russia Phosphoric Acid Market by Source Type
- 6.2.3.1.2 Russia Phosphoric Acid Market by Application
- 6.2.3.2 France Phosphoric Acid Market
- 6.2.3.2.1 France Phosphoric Acid Market by Source Type
- 6.2.3.2.2 France Phosphoric Acid Market by Application
- 6.2.3.3 Germany Phosphoric Acid Market
- 6.2.3.3.1 Germany Phosphoric Acid Market by Source Type
- 6.2.3.3.2 Germany Phosphoric Acid Market by Application
- 6.2.3.4 UK Phosphoric Acid Market
- 6.2.3.4.1 UK Phosphoric Acid Market by Source Type
- 6.2.3.4.2 UK Phosphoric Acid Market by Application
- 6.2.3.5 Spain Phosphoric Acid Market
- 6.2.3.5.1 Spain Phosphoric Acid Market by Source Type
- 6.2.3.5.2 Spain Phosphoric Acid Market by Application
- 6.2.3.6 Italy Phosphoric Acid Market
- 6.2.3.6.1 Italy Phosphoric Acid Market by Source Type
- 6.2.3.6.2 Italy Phosphoric Acid Market by Application
- 6.2.3.7 Rest of Europe Phosphoric Acid Market
- 6.2.3.7.1 Rest of Europe Phosphoric Acid Market by Source Type
- 6.2.3.7.2 Rest of Europe Phosphoric Acid Market by Application
- 6.2.3.1 Russia Phosphoric Acid Market
- 6.2.1 Europe Phosphoric Acid Market by Source Type
- 6.3 Asia Pacific Phosphoric Acid Market
- 6.3.1 Asia Pacific Phosphoric Acid Market by Source Type
- 6.3.1.1 Asia Pacific Wet Process Market by Country
- 6.3.1.2 Asia Pacific Thermal Process Market by Country
- 6.3.2 Asia Pacific Phosphoric Acid Market by Application
- 6.3.2.1 Asia Pacific Fertilizers Market by Country
- 6.3.2.2 Asia Pacific Feed & Food Additives Market by Country
- 6.3.2.3 Asia Pacific Water Treatment Chemicals Market by Country
- 6.3.2.4 Asia Pacific Detergents Market by Country
- 6.3.2.5 Asia Pacific Metal Treatment Market by Country
- 6.3.2.6 Asia Pacific Industrial Use Market by Country
- 6.3.2.7 Asia Pacific Others Market by Country
- 6.3.3 Asia Pacific Phosphoric Acid Market by Country
- 6.3.3.1 China Phosphoric Acid Market
- 6.3.3.1.1 China Phosphoric Acid Market by Source Type
- 6.3.3.1.2 China Phosphoric Acid Market by Application
- 6.3.3.2 India Phosphoric Acid Market
- 6.3.3.2.1 India Phosphoric Acid Market by Source Type
- 6.3.3.2.2 India Phosphoric Acid Market by Application
- 6.3.3.3 Thailand Phosphoric Acid Market
- 6.3.3.3.1 Thailand Phosphoric Acid Market by Source Type
- 6.3.3.3.2 Thailand Phosphoric Acid Market by Application
- 6.3.3.4 Japan Phosphoric Acid Market
- 6.3.3.4.1 Japan Phosphoric Acid Market by Source Type
- 6.3.3.4.2 Japan Phosphoric Acid Market by Application
- 6.3.3.5 South Korea Phosphoric Acid Market
- 6.3.3.5.1 South Korea Phosphoric Acid Market by Source Type
- 6.3.3.5.2 South Korea Phosphoric Acid Market by Application
- 6.3.3.6 Australia Phosphoric Acid Market
- 6.3.3.6.1 Australia Phosphoric Acid Market by Source Type
- 6.3.3.6.2 Australia Phosphoric Acid Market by Application
- 6.3.3.7 Rest of Asia Pacific Phosphoric Acid Market
- 6.3.3.7.1 Rest of Asia Pacific Phosphoric Acid Market by Source Type
- 6.3.3.7.2 Rest of Asia Pacific Phosphoric Acid Market by Application
- 6.3.3.1 China Phosphoric Acid Market
- 6.3.1 Asia Pacific Phosphoric Acid Market by Source Type
- 6.4 LAMEA Phosphoric Acid Market
- 6.4.1 LAMEA Phosphoric Acid Market by Source Type
- 6.4.1.1 LAMEA Wet Process Market by Country
- 6.4.1.2 LAMEA Thermal Process Market by Country
- 6.4.2 LAMEA Phosphoric Acid Market by Application
- 6.4.2.1 LAMEA Fertilizers Market by Country
- 6.4.2.2 LAMEA Feed & Food Additives Market by Country
- 6.4.2.3 LAMEA Water Treatment Chemicals Market by Country
- 6.4.2.4 LAMEA Detergents Market by Country
- 6.4.2.5 LAMEA Metal Treatment Market by Country
- 6.4.2.6 LAMEA Industrial Use Market by Country
- 6.4.2.7 LAMEA Others Market by Country
- 6.4.3 LAMEA Phosphoric Acid Market by Country
- 6.4.3.1 Brazil Phosphoric Acid Market
- 6.4.3.1.1 Brazil Phosphoric Acid Market by Source Type
- 6.4.3.1.2 Brazil Phosphoric Acid Market by Application
- 6.4.3.2 Argentina Phosphoric Acid Market
- 6.4.3.2.1 Argentina Phosphoric Acid Market by Source Type
- 6.4.3.2.2 Argentina Phosphoric Acid Market by Application
- 6.4.3.3 South Africa Phosphoric Acid Market
- 6.4.3.3.1 South Africa Phosphoric Acid Market by Source Type
- 6.4.3.3.2 South Africa Phosphoric Acid Market by Application
- 6.4.3.4 Nigeria Phosphoric Acid Market
- 6.4.3.4.1 Nigeria Phosphoric Acid Market by Source Type
- 6.4.3.4.2 Nigeria Phosphoric Acid Market by Application
- 6.4.3.5 Morocco Phosphoric Acid Market
- 6.4.3.5.1 Morocco Phosphoric Acid Market by Source Type
- 6.4.3.5.2 Morocco Phosphoric Acid Market by Application
- 6.4.3.6 Chile Phosphoric Acid Market
- 6.4.3.6.1 Chile Phosphoric Acid Market by Source Type
- 6.4.3.6.2 Chile Phosphoric Acid Market by Application
- 6.4.3.7 Rest of LAMEA Phosphoric Acid Market
- 6.4.3.7.1 Rest of LAMEA Phosphoric Acid Market by Source Type
- 6.4.3.7.2 Rest of LAMEA Phosphoric Acid Market by Application
- 6.4.3.1 Brazil Phosphoric Acid Market
- 6.4.1 LAMEA Phosphoric Acid Market by Source Type
Chapter 7. Company Profiles
- 7.1 PJSC "PhosAgro"
- 7.1.1 Company Overview
- 7.1.2 Financial Analysis
- 7.2 IFFCO (Cooperative Societies of India)
- 7.2.1 Company Overview
- 7.2.2 Financial Analysis
- 7.2.3 Segmental and Regional Analysis
- 7.2.4 Research & Development Expenses
- 7.3 EuroChem Group AG (AIM Capital Ltd.)
- 7.3.1 Company Overview
- 7.3.2 Recent strategies and developments:
- 7.3.2.1 Acquisition and Mergers:
- 7.3.3 SWOT Analysis
- 7.4 OCP SA
- 7.4.1 Company Overview
- 7.4.2 Financial Analysis
- 7.4.3 Segmental and Regional Analysis
- 7.4.4 Recent strategies and developments:
- 7.4.4.1 Acquisition and Mergers:
- 7.4.5 SWOT Analysis
- 7.5 ICL Group Ltd. (Israel Corp.)
- 7.5.1 Company Overview
- 7.5.2 Financial Analysis
- 7.5.3 Segmental and Regional Analysis
- 7.5.4 Research & Development Expenses
- 7.5.5 SWOT Analysis
- 7.6 Innophos Holdings, Inc. (One Rock Capital Partners, LLC)
- 7.6.1 Company Overview
- 7.7 Gujarat State Fertilizers & Chemicals Limited
- 7.7.1 Company Overview
- 7.7.2 Financial Analysis
- 7.7.3 Segmental and Regional Analysis
- 7.7.4 Research & Development Expenses
- 7.8 Yara International ASA
- 7.8.1 Company Overview
- 7.8.2 Financial Analysis
- 7.8.3 Segmental and Regional Analysis
- 7.8.4 Research & Development Expenses
- 7.9 The Mosaic Company
- 7.9.1 Company Overview
- 7.9.2 Financial Analysis
- 7.9.3 Segmental and Regional Analysis
- 7.9.4 Recent strategies and developments:
- 7.9.4.1 Partnerships, Collaborations, and Agreements:
- 7.9.5 SWOT Analysis
- 7.10. Nutrien Limited
- 7.10.1 Company Overview
- 7.10.2 Financial Analysis
- 7.10.3 Segmental and Regional Analysis
- 7.10.4 SWOT Analysis
