|
|
市場調査レポート
商品コード
1335884
電気自動車用充電コネクタの世界市場規模・シェア・産業動向分析レポート:エンドユーザー別、タイプ別、充電速度別(低速・高速)、充電レベル別(レベル3、レベル2、レベル1)、地域別展望・予測、2023年~2030年Global Electric Vehicle Charging Connector Market Size, Share & Industry Trends Analysis Report By End User, By Type, By Charging Speed (Slow and Fast), By Charging Level (Level 3, Level 2 and Level 1), By Regional Outlook and Forecast, 2023 - 2030 |
||||||
|
|
|||||||
|
|||||||


| 電気自動車用充電コネクタの世界市場規模・シェア・産業動向分析レポート:エンドユーザー別、タイプ別、充電速度別(低速・高速)、充電レベル別(レベル3、レベル2、レベル1)、地域別展望・予測、2023年~2030年 |
|
出版日: 2023年07月31日
発行: KBV Research
ページ情報: 英文 316 Pages
納期: 即納可能
|

- 全表示
- 概要
- 図表
- 目次
電気自動車用充電コネクタの市場規模は2030年までに1億8,120万米ドルに達すると予測され、予測期間中のCAGRは18.6%の市場成長率で上昇する見込みです。
カーディナル・マトリックスで示された分析によると、Tesla, Inc.がこの市場における主要な先駆者です。2023年6月、TeslaはGeneral Motors Co.と手を組み、2025年から北米充電標準(NACS)コネクタ設計を同社のEVに組み合わせ、GMのEV 促進要因に北米全域で12,000以上のTesla Superchargersでの充電アクセスを提供します。シュナイダーエレクトリックSE、シーメンスAG、ロバート・ボッシュGmbHなどの企業は、この市場における主要なイノベーターです。
市場成長要因
ガソリンとディーゼルのコスト上昇
電気自動車の運転コストは、同等のガソリン車やディーゼル車よりも大幅に低いです。電気自動車は、ガソリンやディーゼルのような化石燃料とは対照的に、電気を使ってバッテリーを充電します。電気自動車は、ガソリン車やディーゼル車よりも効率が高く、電気代が安いため、充電コストが安いです。バスターミナルに設置されたソーラーパネルなど、再生可能エネルギーで充電すれば、電気代はさらに安くなります。その結果、世界各国で従来型自動車から電気自動車への切り替えが進み、市場が拡大しています。
温室効果ガス排出量の増加による低公害車需要の増加
従来の燃料を燃焼させると、CO2、NOx、HC、COといった温室効果ガスが排出されます。これらのガスや粒子は、地球温暖化や気候変動の原因となっています。水素エネルギーを輸送だけでなく、ビジネスや産業にも利用することで、GHG排出量は大幅に削減されます。多くの政府は、温室効果ガス(GHG)排出を削減するため、電気自動車を導入しています。GHG排出削減目標が設定されたことで、フリートメーカーは電気自動車を利用することが求められるようになっています。これが市場の成長につながると予測されます。
市場抑制要因
コネクターの標準化不足
共通の充電コネクター規格がないことも、充電の選択肢を狭め、価格を上昇させる効果があります。完全で効果的な充電ネットワークの構築には多額の費用がかかり、官民双方からの多額の資金拠出が必要となります。充電インフラの整備は、高額なコストによって遅々として進まない可能性があります。EV所有者にとっては、特定のコネクター・タイプをサポートする充電ステーションへのアクセスが制限される可能性があり、多数のコネクター・タイプをサポートする必要性は、メーカーや事業者にとってより高いコストとなります。したがって、標準化の欠如が今後数年間の市場の成長を妨げる可能性があります。
エンドユーザーの展望
エンドユーザーに基づき、市場は住宅用と商業用に分類されます。2022年の市場では、商業セグメントがかなりの収益シェアを獲得しました。商業用充電器の設置は、従業員の仕事と充電済み車両の維持を容易にします。このセグメントの優れた成長可能性により、オフィスビル内の電気自動車充電ステーションは増加し続けています。商業用コネクターは、EV所有者が外出先で車を充電するために不可欠であり、より長距離を移動したり、実用的な充電の代替手段として公共の充電インフラに頼ることができます。
充電速度の見通し
充電速度によって、市場は低速と高速に二分されます。2022年の市場シェアは、低速セグメントが最大でした。低速充電は家庭での使用に最適で、一般的にオフィスで見られるタイプの充電ポイントです。IEAによると、2022年に世界中に設置された公共低速充電ステーションの数は600,000を超えました。そのうち36万基が中国に設置され、低速充電ポイントの総数はほぼ1,000基となります。2022年の時点で、世界の公共低速充電器の半数以上が中国に設置されています。
タイプ別展望
タイプ別では、CCS、CHAdeMO、GB/T、その他に分けられます。CHAdeMOセグメントは2022年の市場でかなりの成長率を確保しました。これは日本が開発した充電方式で、現在では日産、三菱、トヨタなど多くのOEMが採用しています。最新のプロトコルでは、この充電器タイプを600Aで500kWの充電に対応しています。CHAdeMOコネクタは、車両のバッテリーに電力を供給するために、充電ポイントの交流(AC)を直流(DC)に変換します。英国の送電網は交流であるため、EVの充電にはこの変換が必要です。
充電レベルの見通し
充電レベルにより、市場はレベル1、レベル2、レベル3に区分されます。2022年の市場シェアは、レベル3が最も大きいです。充電レベルは、充電ステーションの出力と、それに応じてEVを充電するのに必要な時間によって決定されます。EV充電コネクター市場では、レベル3のEVコネクターが主流です。この充電器は、完全にフラットな状態から10分以内に80%まで充電することができます。レベル3のEVコネクターは、通常の45kWの車載外充電器と連動し、200~600ボルトの間に位置し、急速充電に適しています。
地域別展望
地域別に見ると、市場は北米、欧州、アジア太平洋、LAMEAで分析されます。アジア太平洋地域は、2022年の市場において最大の収益シェアを記録しました。この地域には、中国やインドなど、世界で最も急速に経済成長している国があります。この地域は、発展途上国における充電インフラの継続的な改善と、補助金、助成金、減税などによる政府からの支援により、EVに対する大きな需要があります。その結果、この地域のEV充電インフラとともに市場も拡大すると思われます。
目次
第1章 市場範囲と調査手法
- 市場の定義
- 目的
- 市場範囲
- セグメンテーション
- 調査手法
第2章 市場の概要
- 主なハイライト
第3章 市場概要
- イントロダクション
- 概要
- 市場構成とシナリオ
- 概要
- 市場に影響を与える主な要因
- 市場促進要因
- 市場抑制要因
第4章 競合分析- 世界
- KBVカーディナルマトリックス
- 最近の業界全体の戦略的展開
- パートナーシップ、コラボレーション、および契約
- 製品の発売と製品の拡大
- 買収と合併
- 主要成功戦略
- 主な戦略
- 主要な戦略的動き
- ポーターのファイブフォース分析
第5章 世界の電気自動車充電コネクタ市場:エンドユーザー別
- 世界の住宅市場:地域別
- 世界の商業市場:地域別
第6章 世界の電気自動車充電コネクタ市場:タイプ別
- 世界のCCS市場:地域別
- 世界のチャデモ市場:地域別
- 世界のGB/T市場:地域別
- 世界のその他の市場:地域別
第7章 世界の電気自動車充電コネクタ市場:充電速度別
- 世界スローマーケット:地域別
- 世界ファストマーケット:地域別
第8章 世界の電気自動車充電コネクタ市場:充電レベル別
- 世界レベル3市場:地域別
- 世界レベル2市場:地域別
- 世界レベル1市場:地域別
第9章 世界の電気自動車充電コネクタ市場:地域別
- 北米
- 北米の市場:国別
- 米国
- カナダ
- メキシコ
- その他北米地域
- 北米の市場:国別
- 欧州
- 欧州の市場:国別
- ドイツ
- 英国
- フランス
- ロシア
- ノルウェー
- オランダ
- その他欧州地域
- 欧州の市場:国別
- アジア太平洋
- アジア太平洋の市場:国別
- 中国
- 日本
- 台湾
- インド
- 韓国
- シンガポール
- その他アジア太平洋地域
- アジア太平洋の市場:国別
- ラテンアメリカ・中東・アフリカ
- ラテンアメリカ・中東・アフリカの市場:国別
- ブラジル
- アルゼンチン
- アラブ首長国連邦
- サウジアラビア
- 南アフリカ
- ナイジェリア
- その他ラテンアメリカ・中東・アフリカ地域
- ラテンアメリカ・中東・アフリカの市場:国別
第10章 企業プロファイル
- Sumitomo Electric Industries, Ltd
- Siemens AG
- Schneider Electric SE
- Robert Bosch GmbH
- TE Connectivity Ltd
- Yazaki Corporation
- HUBER+SUHNER AG
- ITT, Inc
- Amphenol Corporation
- Tesla, Inc
第11章 電気自動車充電コネクタ市場での勝利は必須条件
LIST OF TABLES
- TABLE 1 Global Electric Vehicle Charging Connector Market, 2019 - 2022, USD Thousands
- TABLE 2 Global Electric Vehicle Charging Connector Market, 2023 - 2030, USD Thousands
- TABLE 3 Partnerships, Collaborations and Agreements- Electric Vehicle Charging Connector Market
- TABLE 4 Product Launches And Product Expansions- Electric Vehicle Charging Connector Market
- TABLE 5 Acquisition and Mergers- Electric Vehicle Charging Connector Market
- TABLE 6 Global Electric Vehicle Charging Connector Market by End User, 2019 - 2022, USD Thousands
- TABLE 7 Global Electric Vehicle Charging Connector Market by End User, 2023 - 2030, USD Thousands
- TABLE 8 Global Residential Market by Region, 2019 - 2022, USD Thousands
- TABLE 9 Global Residential Market by Region, 2023 - 2030, USD Thousands
- TABLE 10 Global Commercial Market by Region, 2019 - 2022, USD Thousands
- TABLE 11 Global Commercial Market by Region, 2023 - 2030, USD Thousands
- TABLE 12 Global Electric Vehicle Charging Connector Market by Type, 2019 - 2022, USD Thousands
- TABLE 13 Global Electric Vehicle Charging Connector Market by Type, 2023 - 2030, USD Thousands
- TABLE 14 Global CCS Market by Region, 2019 - 2022, USD Thousands
- TABLE 15 Global CCS Market by Region, 2023 - 2030, USD Thousands
- TABLE 16 Global Chademo Market by Region, 2019 - 2022, USD Thousands
- TABLE 17 Global Chademo Market by Region, 2023 - 2030, USD Thousands
- TABLE 18 Global GB/T Market by Region, 2019 - 2022, USD Thousands
- TABLE 19 Global GB/T Market by Region, 2023 - 2030, USD Thousands
- TABLE 20 Global Others Market by Region, 2019 - 2022, USD Thousands
- TABLE 21 Global Others Market by Region, 2023 - 2030, USD Thousands
- TABLE 22 Global Electric Vehicle Charging Connector Market by Charging Speed, 2019 - 2022, USD Thousands
- TABLE 23 Global Electric Vehicle Charging Connector Market by Charging Speed, 2023 - 2030, USD Thousands
- TABLE 24 Global Slow Market by Region, 2019 - 2022, USD Thousands
- TABLE 25 Global Slow Market by Region, 2023 - 2030, USD Thousands
- TABLE 26 Global Fast Market by Region, 2019 - 2022, USD Thousands
- TABLE 27 Global Fast Market by Region, 2023 - 2030, USD Thousands
- TABLE 28 Global Electric Vehicle Charging Connector Market by Charging Level, 2019 - 2022, USD Thousands
- TABLE 29 Global Electric Vehicle Charging Connector Market by Charging Level, 2023 - 2030, USD Thousands
- TABLE 30 Global Level 3 Market by Region, 2019 - 2022, USD Thousands
- TABLE 31 Global Level 3 Market by Region, 2023 - 2030, USD Thousands
- TABLE 32 Global Level 2 Market by Region, 2019 - 2022, USD Thousands
- TABLE 33 Global Level 2 Market by Region, 2023 - 2030, USD Thousands
- TABLE 34 Global Level 1 Market by Region, 2019 - 2022, USD Thousands
- TABLE 35 Global Level 1 Market by Region, 2023 - 2030, USD Thousands
- TABLE 36 Global Electric Vehicle Charging Connector Market by Region, 2019 - 2022, USD Thousands
- TABLE 37 Global Electric Vehicle Charging Connector Market by Region, 2023 - 2030, USD Thousands
- TABLE 38 North America Electric Vehicle Charging Connector Market, 2019 - 2022, USD Thousands
- TABLE 39 North America Electric Vehicle Charging Connector Market, 2023 - 2030, USD Thousands
- TABLE 40 North America Electric Vehicle Charging Connector Market by End User, 2019 - 2022, USD Thousands
- TABLE 41 North America Electric Vehicle Charging Connector Market by End User, 2023 - 2030, USD Thousands
- TABLE 42 North America Residential Market by Country, 2019 - 2022, USD Thousands
- TABLE 43 North America Residential Market by Country, 2023 - 2030, USD Thousands
- TABLE 44 North America Commercial Market by Country, 2019 - 2022, USD Thousands
- TABLE 45 North America Commercial Market by Country, 2023 - 2030, USD Thousands
- TABLE 46 North America Electric Vehicle Charging Connector Market by Type, 2019 - 2022, USD Thousands
- TABLE 47 North America Electric Vehicle Charging Connector Market by Type, 2023 - 2030, USD Thousands
- TABLE 48 North America CCS Market by Country, 2019 - 2022, USD Thousands
- TABLE 49 North America CCS Market by Country, 2023 - 2030, USD Thousands
- TABLE 50 North America Chademo Market by Country, 2019 - 2022, USD Thousands
- TABLE 51 North America Chademo Market by Country, 2023 - 2030, USD Thousands
- TABLE 52 North America GB/T Market by Country, 2019 - 2022, USD Thousands
- TABLE 53 North America GB/T Market by Country, 2023 - 2030, USD Thousands
- TABLE 54 North America Others Market by Country, 2019 - 2022, USD Thousands
- TABLE 55 North America Others Market by Country, 2023 - 2030, USD Thousands
- TABLE 56 North America Electric Vehicle Charging Connector Market by Charging Speed, 2019 - 2022, USD Thousands
- TABLE 57 North America Electric Vehicle Charging Connector Market by Charging Speed, 2023 - 2030, USD Thousands
- TABLE 58 North America Slow Market by Country, 2019 - 2022, USD Thousands
- TABLE 59 North America Slow Market by Country, 2023 - 2030, USD Thousands
- TABLE 60 North America Fast Market by Country, 2019 - 2022, USD Thousands
- TABLE 61 North America Fast Market by Country, 2023 - 2030, USD Thousands
- TABLE 62 North America Electric Vehicle Charging Connector Market by Charging Level, 2019 - 2022, USD Thousands
- TABLE 63 North America Electric Vehicle Charging Connector Market by Charging Level, 2023 - 2030, USD Thousands
- TABLE 64 North America Level 3 Market by Country, 2019 - 2022, USD Thousands
- TABLE 65 North America Level 3 Market by Country, 2023 - 2030, USD Thousands
- TABLE 66 North America Level 2 Market by Country, 2019 - 2022, USD Thousands
- TABLE 67 North America Level 2 Market by Country, 2023 - 2030, USD Thousands
- TABLE 68 North America Level 1 Market by Country, 2019 - 2022, USD Thousands
- TABLE 69 North America Level 1 Market by Country, 2023 - 2030, USD Thousands
- TABLE 70 North America Electric Vehicle Charging Connector Market by Country, 2019 - 2022, USD Thousands
- TABLE 71 North America Electric Vehicle Charging Connector Market by Country, 2023 - 2030, USD Thousands
- TABLE 72 US Electric Vehicle Charging Connector Market, 2019 - 2022, USD Thousands
- TABLE 73 US Electric Vehicle Charging Connector Market, 2023 - 2030, USD Thousands
- TABLE 74 US Electric Vehicle Charging Connector Market by End User, 2019 - 2022, USD Thousands
- TABLE 75 US Electric Vehicle Charging Connector Market by End User, 2023 - 2030, USD Thousands
- TABLE 76 US Electric Vehicle Charging Connector Market by Type, 2019 - 2022, USD Thousands
- TABLE 77 US Electric Vehicle Charging Connector Market by Type, 2023 - 2030, USD Thousands
- TABLE 78 US Electric Vehicle Charging Connector Market by Charging Speed, 2019 - 2022, USD Thousands
- TABLE 79 US Electric Vehicle Charging Connector Market by Charging Speed, 2023 - 2030, USD Thousands
- TABLE 80 US Electric Vehicle Charging Connector Market by Charging Level, 2019 - 2022, USD Thousands
- TABLE 81 US Electric Vehicle Charging Connector Market by Charging Level, 2023 - 2030, USD Thousands
- TABLE 82 Canada Electric Vehicle Charging Connector Market, 2019 - 2022, USD Thousands
- TABLE 83 Canada Electric Vehicle Charging Connector Market, 2023 - 2030, USD Thousands
- TABLE 84 Canada Electric Vehicle Charging Connector Market by End User, 2019 - 2022, USD Thousands
- TABLE 85 Canada Electric Vehicle Charging Connector Market by End User, 2023 - 2030, USD Thousands
- TABLE 86 Canada Electric Vehicle Charging Connector Market by Type, 2019 - 2022, USD Thousands
- TABLE 87 Canada Electric Vehicle Charging Connector Market by Type, 2023 - 2030, USD Thousands
- TABLE 88 Canada Electric Vehicle Charging Connector Market by Charging Speed, 2019 - 2022, USD Thousands
- TABLE 89 Canada Electric Vehicle Charging Connector Market by Charging Speed, 2023 - 2030, USD Thousands
- TABLE 90 Canada Electric Vehicle Charging Connector Market by Charging Level, 2019 - 2022, USD Thousands
- TABLE 91 Canada Electric Vehicle Charging Connector Market by Charging Level, 2023 - 2030, USD Thousands
- TABLE 92 Mexico Electric Vehicle Charging Connector Market, 2019 - 2022, USD Thousands
- TABLE 93 Mexico Electric Vehicle Charging Connector Market, 2023 - 2030, USD Thousands
- TABLE 94 Mexico Electric Vehicle Charging Connector Market by End User, 2019 - 2022, USD Thousands
- TABLE 95 Mexico Electric Vehicle Charging Connector Market by End User, 2023 - 2030, USD Thousands
- TABLE 96 Mexico Electric Vehicle Charging Connector Market by Type, 2019 - 2022, USD Thousands
- TABLE 97 Mexico Electric Vehicle Charging Connector Market by Type, 2023 - 2030, USD Thousands
- TABLE 98 Mexico Electric Vehicle Charging Connector Market by Charging Speed, 2019 - 2022, USD Thousands
- TABLE 99 Mexico Electric Vehicle Charging Connector Market by Charging Speed, 2023 - 2030, USD Thousands
- TABLE 100 Mexico Electric Vehicle Charging Connector Market by Charging Level, 2019 - 2022, USD Thousands
- TABLE 101 Mexico Electric Vehicle Charging Connector Market by Charging Level, 2023 - 2030, USD Thousands
- TABLE 102 Rest of North America Electric Vehicle Charging Connector Market, 2019 - 2022, USD Thousands
- TABLE 103 Rest of North America Electric Vehicle Charging Connector Market, 2023 - 2030, USD Thousands
- TABLE 104 Rest of North America Electric Vehicle Charging Connector Market by End User, 2019 - 2022, USD Thousands
- TABLE 105 Rest of North America Electric Vehicle Charging Connector Market by End User, 2023 - 2030, USD Thousands
- TABLE 106 Rest of North America Electric Vehicle Charging Connector Market by Type, 2019 - 2022, USD Thousands
- TABLE 107 Rest of North America Electric Vehicle Charging Connector Market by Type, 2023 - 2030, USD Thousands
- TABLE 108 Rest of North America Electric Vehicle Charging Connector Market by Charging Speed, 2019 - 2022, USD Thousands
- TABLE 109 Rest of North America Electric Vehicle Charging Connector Market by Charging Speed, 2023 - 2030, USD Thousands
- TABLE 110 Rest of North America Electric Vehicle Charging Connector Market by Charging Level, 2019 - 2022, USD Thousands
- TABLE 111 Rest of North America Electric Vehicle Charging Connector Market by Charging Level, 2023 - 2030, USD Thousands
- TABLE 112 Europe Electric Vehicle Charging Connector Market, 2019 - 2022, USD Thousands
- TABLE 113 Europe Electric Vehicle Charging Connector Market, 2023 - 2030, USD Thousands
- TABLE 114 Europe Electric Vehicle Charging Connector Market by End User, 2019 - 2022, USD Thousands
- TABLE 115 Europe Electric Vehicle Charging Connector Market by End User, 2023 - 2030, USD Thousands
- TABLE 116 Europe Residential Market by Country, 2019 - 2022, USD Thousands
- TABLE 117 Europe Residential Market by Country, 2023 - 2030, USD Thousands
- TABLE 118 Europe Commercial Market by Country, 2019 - 2022, USD Thousands
- TABLE 119 Europe Commercial Market by Country, 2023 - 2030, USD Thousands
- TABLE 120 Europe Electric Vehicle Charging Connector Market by Type, 2019 - 2022, USD Thousands
- TABLE 121 Europe Electric Vehicle Charging Connector Market by Type, 2023 - 2030, USD Thousands
- TABLE 122 Europe CCS Market by Country, 2019 - 2022, USD Thousands
- TABLE 123 Europe CCS Market by Country, 2023 - 2030, USD Thousands
- TABLE 124 Europe Chademo Market by Country, 2019 - 2022, USD Thousands
- TABLE 125 Europe Chademo Market by Country, 2023 - 2030, USD Thousands
- TABLE 126 Europe GB/T Market by Country, 2019 - 2022, USD Thousands
- TABLE 127 Europe GB/T Market by Country, 2023 - 2030, USD Thousands
- TABLE 128 Europe Others Market by Country, 2019 - 2022, USD Thousands
- TABLE 129 Europe Others Market by Country, 2023 - 2030, USD Thousands
- TABLE 130 Europe Electric Vehicle Charging Connector Market by Charging Speed, 2019 - 2022, USD Thousands
- TABLE 131 Europe Electric Vehicle Charging Connector Market by Charging Speed, 2023 - 2030, USD Thousands
- TABLE 132 Europe Slow Market by Country, 2019 - 2022, USD Thousands
- TABLE 133 Europe Slow Market by Country, 2023 - 2030, USD Thousands
- TABLE 134 Europe Fast Market by Country, 2019 - 2022, USD Thousands
- TABLE 135 Europe Fast Market by Country, 2023 - 2030, USD Thousands
- TABLE 136 Europe Electric Vehicle Charging Connector Market by Charging Level, 2019 - 2022, USD Thousands
- TABLE 137 Europe Electric Vehicle Charging Connector Market by Charging Level, 2023 - 2030, USD Thousands
- TABLE 138 Europe Level 3 Market by Country, 2019 - 2022, USD Thousands
- TABLE 139 Europe Level 3 Market by Country, 2023 - 2030, USD Thousands
- TABLE 140 Europe Level 2 Market by Country, 2019 - 2022, USD Thousands
- TABLE 141 Europe Level 2 Market by Country, 2023 - 2030, USD Thousands
- TABLE 142 Europe Level 1 Market by Country, 2019 - 2022, USD Thousands
- TABLE 143 Europe Level 1 Market by Country, 2023 - 2030, USD Thousands
- TABLE 144 Europe Electric Vehicle Charging Connector Market by Country, 2019 - 2022, USD Thousands
- TABLE 145 Europe Electric Vehicle Charging Connector Market by Country, 2023 - 2030, USD Thousands
- TABLE 146 Germany Electric Vehicle Charging Connector Market, 2019 - 2022, USD Thousands
- TABLE 147 Germany Electric Vehicle Charging Connector Market, 2023 - 2030, USD Thousands
- TABLE 148 Germany Electric Vehicle Charging Connector Market by End User, 2019 - 2022, USD Thousands
- TABLE 149 Germany Electric Vehicle Charging Connector Market by End User, 2023 - 2030, USD Thousands
- TABLE 150 Germany Electric Vehicle Charging Connector Market by Type, 2019 - 2022, USD Thousands
- TABLE 151 Germany Electric Vehicle Charging Connector Market by Type, 2023 - 2030, USD Thousands
- TABLE 152 Germany Electric Vehicle Charging Connector Market by Charging Speed, 2019 - 2022, USD Thousands
- TABLE 153 Germany Electric Vehicle Charging Connector Market by Charging Speed, 2023 - 2030, USD Thousands
- TABLE 154 Germany Electric Vehicle Charging Connector Market by Charging Level, 2019 - 2022, USD Thousands
- TABLE 155 Germany Electric Vehicle Charging Connector Market by Charging Level, 2023 - 2030, USD Thousands
- TABLE 156 UK Electric Vehicle Charging Connector Market, 2019 - 2022, USD Thousands
- TABLE 157 UK Electric Vehicle Charging Connector Market, 2023 - 2030, USD Thousands
- TABLE 158 UK Electric Vehicle Charging Connector Market by End User, 2019 - 2022, USD Thousands
- TABLE 159 UK Electric Vehicle Charging Connector Market by End User, 2023 - 2030, USD Thousands
- TABLE 160 UK Electric Vehicle Charging Connector Market by Type, 2019 - 2022, USD Thousands
- TABLE 161 UK Electric Vehicle Charging Connector Market by Type, 2023 - 2030, USD Thousands
- TABLE 162 UK Electric Vehicle Charging Connector Market by Charging Speed, 2019 - 2022, USD Thousands
- TABLE 163 UK Electric Vehicle Charging Connector Market by Charging Speed, 2023 - 2030, USD Thousands
- TABLE 164 UK Electric Vehicle Charging Connector Market by Charging Level, 2019 - 2022, USD Thousands
- TABLE 165 UK Electric Vehicle Charging Connector Market by Charging Level, 2023 - 2030, USD Thousands
- TABLE 166 France Electric Vehicle Charging Connector Market, 2019 - 2022, USD Thousands
- TABLE 167 France Electric Vehicle Charging Connector Market, 2023 - 2030, USD Thousands
- TABLE 168 France Electric Vehicle Charging Connector Market by End User, 2019 - 2022, USD Thousands
- TABLE 169 France Electric Vehicle Charging Connector Market by End User, 2023 - 2030, USD Thousands
- TABLE 170 France Electric Vehicle Charging Connector Market by Type, 2019 - 2022, USD Thousands
- TABLE 171 France Electric Vehicle Charging Connector Market by Type, 2023 - 2030, USD Thousands
- TABLE 172 France Electric Vehicle Charging Connector Market by Charging Speed, 2019 - 2022, USD Thousands
- TABLE 173 France Electric Vehicle Charging Connector Market by Charging Speed, 2023 - 2030, USD Thousands
- TABLE 174 France Electric Vehicle Charging Connector Market by Charging Level, 2019 - 2022, USD Thousands
- TABLE 175 France Electric Vehicle Charging Connector Market by Charging Level, 2023 - 2030, USD Thousands
- TABLE 176 Russia Electric Vehicle Charging Connector Market, 2019 - 2022, USD Thousands
- TABLE 177 Russia Electric Vehicle Charging Connector Market, 2023 - 2030, USD Thousands
- TABLE 178 Russia Electric Vehicle Charging Connector Market by End User, 2019 - 2022, USD Thousands
- TABLE 179 Russia Electric Vehicle Charging Connector Market by End User, 2023 - 2030, USD Thousands
- TABLE 180 Russia Electric Vehicle Charging Connector Market by Type, 2019 - 2022, USD Thousands
- TABLE 181 Russia Electric Vehicle Charging Connector Market by Type, 2023 - 2030, USD Thousands
- TABLE 182 Russia Electric Vehicle Charging Connector Market by Charging Speed, 2019 - 2022, USD Thousands
- TABLE 183 Russia Electric Vehicle Charging Connector Market by Charging Speed, 2023 - 2030, USD Thousands
- TABLE 184 Russia Electric Vehicle Charging Connector Market by Charging Level, 2019 - 2022, USD Thousands
- TABLE 185 Russia Electric Vehicle Charging Connector Market by Charging Level, 2023 - 2030, USD Thousands
- TABLE 186 Norway Electric Vehicle Charging Connector Market, 2019 - 2022, USD Thousands
- TABLE 187 Norway Electric Vehicle Charging Connector Market, 2023 - 2030, USD Thousands
- TABLE 188 Norway Electric Vehicle Charging Connector Market by End User, 2019 - 2022, USD Thousands
- TABLE 189 Norway Electric Vehicle Charging Connector Market by End User, 2023 - 2030, USD Thousands
- TABLE 190 Norway Electric Vehicle Charging Connector Market by Type, 2019 - 2022, USD Thousands
- TABLE 191 Norway Electric Vehicle Charging Connector Market by Type, 2023 - 2030, USD Thousands
- TABLE 192 Norway Electric Vehicle Charging Connector Market by Charging Speed, 2019 - 2022, USD Thousands
- TABLE 193 Norway Electric Vehicle Charging Connector Market by Charging Speed, 2023 - 2030, USD Thousands
- TABLE 194 Norway Electric Vehicle Charging Connector Market by Charging Level, 2019 - 2022, USD Thousands
- TABLE 195 Norway Electric Vehicle Charging Connector Market by Charging Level, 2023 - 2030, USD Thousands
- TABLE 196 Netherlands Electric Vehicle Charging Connector Market, 2019 - 2022, USD Thousands
- TABLE 197 Netherlands Electric Vehicle Charging Connector Market, 2023 - 2030, USD Thousands
- TABLE 198 Netherlands Electric Vehicle Charging Connector Market by End User, 2019 - 2022, USD Thousands
- TABLE 199 Netherlands Electric Vehicle Charging Connector Market by End User, 2023 - 2030, USD Thousands
- TABLE 200 Netherlands Electric Vehicle Charging Connector Market by Type, 2019 - 2022, USD Thousands
- TABLE 201 Netherlands Electric Vehicle Charging Connector Market by Type, 2023 - 2030, USD Thousands
- TABLE 202 Netherlands Electric Vehicle Charging Connector Market by Charging Speed, 2019 - 2022, USD Thousands
- TABLE 203 Netherlands Electric Vehicle Charging Connector Market by Charging Speed, 2023 - 2030, USD Thousands
- TABLE 204 Netherlands Electric Vehicle Charging Connector Market by Charging Level, 2019 - 2022, USD Thousands
- TABLE 205 Netherlands Electric Vehicle Charging Connector Market by Charging Level, 2023 - 2030, USD Thousands
- TABLE 206 Rest of Europe Electric Vehicle Charging Connector Market, 2019 - 2022, USD Thousands
- TABLE 207 Rest of Europe Electric Vehicle Charging Connector Market, 2023 - 2030, USD Thousands
- TABLE 208 Rest of Europe Electric Vehicle Charging Connector Market by End User, 2019 - 2022, USD Thousands
- TABLE 209 Rest of Europe Electric Vehicle Charging Connector Market by End User, 2023 - 2030, USD Thousands
- TABLE 210 Rest of Europe Electric Vehicle Charging Connector Market by Type, 2019 - 2022, USD Thousands
- TABLE 211 Rest of Europe Electric Vehicle Charging Connector Market by Type, 2023 - 2030, USD Thousands
- TABLE 212 Rest of Europe Electric Vehicle Charging Connector Market by Charging Speed, 2019 - 2022, USD Thousands
- TABLE 213 Rest of Europe Electric Vehicle Charging Connector Market by Charging Speed, 2023 - 2030, USD Thousands
- TABLE 214 Rest of Europe Electric Vehicle Charging Connector Market by Charging Level, 2019 - 2022, USD Thousands
- TABLE 215 Rest of Europe Electric Vehicle Charging Connector Market by Charging Level, 2023 - 2030, USD Thousands
- TABLE 216 Asia Pacific Electric Vehicle Charging Connector Market, 2019 - 2022, USD Thousands
- TABLE 217 Asia Pacific Electric Vehicle Charging Connector Market, 2023 - 2030, USD Thousands
- TABLE 218 Asia Pacific Electric Vehicle Charging Connector Market by End User, 2019 - 2022, USD Thousands
- TABLE 219 Asia Pacific Electric Vehicle Charging Connector Market by End User, 2023 - 2030, USD Thousands
- TABLE 220 Asia Pacific Residential Market by Country, 2019 - 2022, USD Thousands
- TABLE 221 Asia Pacific Residential Market by Country, 2023 - 2030, USD Thousands
- TABLE 222 Asia Pacific Commercial Market by Country, 2019 - 2022, USD Thousands
- TABLE 223 Asia Pacific Commercial Market by Country, 2023 - 2030, USD Thousands
- TABLE 224 Asia Pacific Electric Vehicle Charging Connector Market by Type, 2019 - 2022, USD Thousands
- TABLE 225 Asia Pacific Electric Vehicle Charging Connector Market by Type, 2023 - 2030, USD Thousands
- TABLE 226 Asia Pacific CCS Market by Country, 2019 - 2022, USD Thousands
- TABLE 227 Asia Pacific CCS Market by Country, 2023 - 2030, USD Thousands
- TABLE 228 Asia Pacific Chademo Market by Country, 2019 - 2022, USD Thousands
- TABLE 229 Asia Pacific Chademo Market by Country, 2023 - 2030, USD Thousands
- TABLE 230 Asia Pacific GB/T Market by Country, 2019 - 2022, USD Thousands
- TABLE 231 Asia Pacific GB/T Market by Country, 2023 - 2030, USD Thousands
- TABLE 232 Asia Pacific Others Market by Country, 2019 - 2022, USD Thousands
- TABLE 233 Asia Pacific Others Market by Country, 2023 - 2030, USD Thousands
- TABLE 234 Asia Pacific Electric Vehicle Charging Connector Market by Charging Speed, 2019 - 2022, USD Thousands
- TABLE 235 Asia Pacific Electric Vehicle Charging Connector Market by Charging Speed, 2023 - 2030, USD Thousands
- TABLE 236 Asia Pacific Slow Market by Country, 2019 - 2022, USD Thousands
- TABLE 237 Asia Pacific Slow Market by Country, 2023 - 2030, USD Thousands
- TABLE 238 Asia Pacific Fast Market by Country, 2019 - 2022, USD Thousands
- TABLE 239 Asia Pacific Fast Market by Country, 2023 - 2030, USD Thousands
- TABLE 240 Asia Pacific Electric Vehicle Charging Connector Market by Charging Level, 2019 - 2022, USD Thousands
- TABLE 241 Asia Pacific Electric Vehicle Charging Connector Market by Charging Level, 2023 - 2030, USD Thousands
- TABLE 242 Asia Pacific Level 3 Market by Country, 2019 - 2022, USD Thousands
- TABLE 243 Asia Pacific Level 3 Market by Country, 2023 - 2030, USD Thousands
- TABLE 244 Asia Pacific Level 2 Market by Country, 2019 - 2022, USD Thousands
- TABLE 245 Asia Pacific Level 2 Market by Country, 2023 - 2030, USD Thousands
- TABLE 246 Asia Pacific Level 1 Market by Country, 2019 - 2022, USD Thousands
- TABLE 247 Asia Pacific Level 1 Market by Country, 2023 - 2030, USD Thousands
- TABLE 248 Asia Pacific Electric Vehicle Charging Connector Market by Country, 2019 - 2022, USD Thousands
- TABLE 249 Asia Pacific Electric Vehicle Charging Connector Market by Country, 2023 - 2030, USD Thousands
- TABLE 250 China Electric Vehicle Charging Connector Market, 2019 - 2022, USD Thousands
- TABLE 251 China Electric Vehicle Charging Connector Market, 2023 - 2030, USD Thousands
- TABLE 252 China Electric Vehicle Charging Connector Market by End User, 2019 - 2022, USD Thousands
- TABLE 253 China Electric Vehicle Charging Connector Market by End User, 2023 - 2030, USD Thousands
- TABLE 254 China Electric Vehicle Charging Connector Market by Type, 2019 - 2022, USD Thousands
- TABLE 255 China Electric Vehicle Charging Connector Market by Type, 2023 - 2030, USD Thousands
- TABLE 256 China Electric Vehicle Charging Connector Market by Charging Speed, 2019 - 2022, USD Thousands
- TABLE 257 China Electric Vehicle Charging Connector Market by Charging Speed, 2023 - 2030, USD Thousands
- TABLE 258 China Electric Vehicle Charging Connector Market by Charging Level, 2019 - 2022, USD Thousands
- TABLE 259 China Electric Vehicle Charging Connector Market by Charging Level, 2023 - 2030, USD Thousands
- TABLE 260 Japan Electric Vehicle Charging Connector Market, 2019 - 2022, USD Thousands
- TABLE 261 Japan Electric Vehicle Charging Connector Market, 2023 - 2030, USD Thousands
- TABLE 262 Japan Electric Vehicle Charging Connector Market by End User, 2019 - 2022, USD Thousands
- TABLE 263 Japan Electric Vehicle Charging Connector Market by End User, 2023 - 2030, USD Thousands
- TABLE 264 Japan Electric Vehicle Charging Connector Market by Type, 2019 - 2022, USD Thousands
- TABLE 265 Japan Electric Vehicle Charging Connector Market by Type, 2023 - 2030, USD Thousands
- TABLE 266 Japan Electric Vehicle Charging Connector Market by Charging Speed, 2019 - 2022, USD Thousands
- TABLE 267 Japan Electric Vehicle Charging Connector Market by Charging Speed, 2023 - 2030, USD Thousands
- TABLE 268 Japan Electric Vehicle Charging Connector Market by Charging Level, 2019 - 2022, USD Thousands
- TABLE 269 Japan Electric Vehicle Charging Connector Market by Charging Level, 2023 - 2030, USD Thousands
- TABLE 270 Taiwan Electric Vehicle Charging Connector Market, 2019 - 2022, USD Thousands
- TABLE 271 Taiwan Electric Vehicle Charging Connector Market, 2023 - 2030, USD Thousands
- TABLE 272 Taiwan Electric Vehicle Charging Connector Market by End User, 2019 - 2022, USD Thousands
- TABLE 273 Taiwan Electric Vehicle Charging Connector Market by End User, 2023 - 2030, USD Thousands
- TABLE 274 Taiwan Electric Vehicle Charging Connector Market by Type, 2019 - 2022, USD Thousands
- TABLE 275 Taiwan Electric Vehicle Charging Connector Market by Type, 2023 - 2030, USD Thousands
- TABLE 276 Taiwan Electric Vehicle Charging Connector Market by Charging Speed, 2019 - 2022, USD Thousands
- TABLE 277 Taiwan Electric Vehicle Charging Connector Market by Charging Speed, 2023 - 2030, USD Thousands
- TABLE 278 Taiwan Electric Vehicle Charging Connector Market by Charging Level, 2019 - 2022, USD Thousands
- TABLE 279 Taiwan Electric Vehicle Charging Connector Market by Charging Level, 2023 - 2030, USD Thousands
- TABLE 280 India Electric Vehicle Charging Connector Market, 2019 - 2022, USD Thousands
- TABLE 281 India Electric Vehicle Charging Connector Market, 2023 - 2030, USD Thousands
- TABLE 282 India Electric Vehicle Charging Connector Market by End User, 2019 - 2022, USD Thousands
- TABLE 283 India Electric Vehicle Charging Connector Market by End User, 2023 - 2030, USD Thousands
- TABLE 284 India Electric Vehicle Charging Connector Market by Type, 2019 - 2022, USD Thousands
- TABLE 285 India Electric Vehicle Charging Connector Market by Type, 2023 - 2030, USD Thousands
- TABLE 286 India Electric Vehicle Charging Connector Market by Charging Speed, 2019 - 2022, USD Thousands
- TABLE 287 India Electric Vehicle Charging Connector Market by Charging Speed, 2023 - 2030, USD Thousands
- TABLE 288 India Electric Vehicle Charging Connector Market by Charging Level, 2019 - 2022, USD Thousands
- TABLE 289 India Electric Vehicle Charging Connector Market by Charging Level, 2023 - 2030, USD Thousands
- TABLE 290 South Korea Electric Vehicle Charging Connector Market, 2019 - 2022, USD Thousands
- TABLE 291 South Korea Electric Vehicle Charging Connector Market, 2023 - 2030, USD Thousands
- TABLE 292 South Korea Electric Vehicle Charging Connector Market by End User, 2019 - 2022, USD Thousands
- TABLE 293 South Korea Electric Vehicle Charging Connector Market by End User, 2023 - 2030, USD Thousands
- TABLE 294 South Korea Electric Vehicle Charging Connector Market by Type, 2019 - 2022, USD Thousands
- TABLE 295 South Korea Electric Vehicle Charging Connector Market by Type, 2023 - 2030, USD Thousands
- TABLE 296 South Korea Electric Vehicle Charging Connector Market by Charging Speed, 2019 - 2022, USD Thousands
- TABLE 297 South Korea Electric Vehicle Charging Connector Market by Charging Speed, 2023 - 2030, USD Thousands
- TABLE 298 South Korea Electric Vehicle Charging Connector Market by Charging Level, 2019 - 2022, USD Thousands
- TABLE 299 South Korea Electric Vehicle Charging Connector Market by Charging Level, 2023 - 2030, USD Thousands
- TABLE 300 Singapore Electric Vehicle Charging Connector Market, 2019 - 2022, USD Thousands
- TABLE 301 Singapore Electric Vehicle Charging Connector Market, 2023 - 2030, USD Thousands
- TABLE 302 Singapore Electric Vehicle Charging Connector Market by End User, 2019 - 2022, USD Thousands
- TABLE 303 Singapore Electric Vehicle Charging Connector Market by End User, 2023 - 2030, USD Thousands
- TABLE 304 Singapore Electric Vehicle Charging Connector Market by Type, 2019 - 2022, USD Thousands
- TABLE 305 Singapore Electric Vehicle Charging Connector Market by Type, 2023 - 2030, USD Thousands
- TABLE 306 Singapore Electric Vehicle Charging Connector Market by Charging Speed, 2019 - 2022, USD Thousands
- TABLE 307 Singapore Electric Vehicle Charging Connector Market by Charging Speed, 2023 - 2030, USD Thousands
- TABLE 308 Singapore Electric Vehicle Charging Connector Market by Charging Level, 2019 - 2022, USD Thousands
- TABLE 309 Singapore Electric Vehicle Charging Connector Market by Charging Level, 2023 - 2030, USD Thousands
- TABLE 310 Rest of Asia Pacific Electric Vehicle Charging Connector Market, 2019 - 2022, USD Thousands
- TABLE 311 Rest of Asia Pacific Electric Vehicle Charging Connector Market, 2023 - 2030, USD Thousands
- TABLE 312 Rest of Asia Pacific Electric Vehicle Charging Connector Market by End User, 2019 - 2022, USD Thousands
- TABLE 313 Rest of Asia Pacific Electric Vehicle Charging Connector Market by End User, 2023 - 2030, USD Thousands
- TABLE 314 Rest of Asia Pacific Electric Vehicle Charging Connector Market by Type, 2019 - 2022, USD Thousands
- TABLE 315 Rest of Asia Pacific Electric Vehicle Charging Connector Market by Type, 2023 - 2030, USD Thousands
- TABLE 316 Rest of Asia Pacific Electric Vehicle Charging Connector Market by Charging Speed, 2019 - 2022, USD Thousands
- TABLE 317 Rest of Asia Pacific Electric Vehicle Charging Connector Market by Charging Speed, 2023 - 2030, USD Thousands
- TABLE 318 Rest of Asia Pacific Electric Vehicle Charging Connector Market by Charging Level, 2019 - 2022, USD Thousands
- TABLE 319 Rest of Asia Pacific Electric Vehicle Charging Connector Market by Charging Level, 2023 - 2030, USD Thousands
- TABLE 320 LAMEA Electric Vehicle Charging Connector Market, 2019 - 2022, USD Thousands
- TABLE 321 LAMEA Electric Vehicle Charging Connector Market, 2023 - 2030, USD Thousands
- TABLE 322 LAMEA Electric Vehicle Charging Connector Market by End User, 2019 - 2022, USD Thousands
- TABLE 323 LAMEA Electric Vehicle Charging Connector Market by End User, 2023 - 2030, USD Thousands
- TABLE 324 LAMEA Residential Market by Country, 2019 - 2022, USD Thousands
- TABLE 325 LAMEA Residential Market by Country, 2023 - 2030, USD Thousands
- TABLE 326 LAMEA Commercial Market by Country, 2019 - 2022, USD Thousands
- TABLE 327 LAMEA Commercial Market by Country, 2023 - 2030, USD Thousands
- TABLE 328 LAMEA Electric Vehicle Charging Connector Market by Type, 2019 - 2022, USD Thousands
- TABLE 329 LAMEA Electric Vehicle Charging Connector Market by Type, 2023 - 2030, USD Thousands
- TABLE 330 LAMEA CCS Market by Country, 2019 - 2022, USD Thousands
- TABLE 331 LAMEA CCS Market by Country, 2023 - 2030, USD Thousands
- TABLE 332 LAMEA Chademo Market by Country, 2019 - 2022, USD Thousands
- TABLE 333 LAMEA Chademo Market by Country, 2023 - 2030, USD Thousands
- TABLE 334 LAMEA GB/T Market by Country, 2019 - 2022, USD Thousands
- TABLE 335 LAMEA GB/T Market by Country, 2023 - 2030, USD Thousands
- TABLE 336 LAMEA Others Market by Country, 2019 - 2022, USD Thousands
- TABLE 337 LAMEA Others Market by Country, 2023 - 2030, USD Thousands
- TABLE 338 LAMEA Electric Vehicle Charging Connector Market by Charging Speed, 2019 - 2022, USD Thousands
- TABLE 339 LAMEA Electric Vehicle Charging Connector Market by Charging Speed, 2023 - 2030, USD Thousands
- TABLE 340 LAMEA Slow Market by Country, 2019 - 2022, USD Thousands
- TABLE 341 LAMEA Slow Market by Country, 2023 - 2030, USD Thousands
- TABLE 342 LAMEA Fast Market by Country, 2019 - 2022, USD Thousands
- TABLE 343 LAMEA Fast Market by Country, 2023 - 2030, USD Thousands
- TABLE 344 LAMEA Electric Vehicle Charging Connector Market by Charging Level, 2019 - 2022, USD Thousands
- TABLE 345 LAMEA Electric Vehicle Charging Connector Market by Charging Level, 2023 - 2030, USD Thousands
- TABLE 346 LAMEA Level 3 Market by Country, 2019 - 2022, USD Thousands
- TABLE 347 LAMEA Level 3 Market by Country, 2023 - 2030, USD Thousands
- TABLE 348 LAMEA Level 2 Market by Country, 2019 - 2022, USD Thousands
- TABLE 349 LAMEA Level 2 Market by Country, 2023 - 2030, USD Thousands
- TABLE 350 LAMEA Level 1 Market by Country, 2019 - 2022, USD Thousands
- TABLE 351 LAMEA Level 1 Market by Country, 2023 - 2030, USD Thousands
- TABLE 352 LAMEA Electric Vehicle Charging Connector Market by Country, 2019 - 2022, USD Thousands
- TABLE 353 LAMEA Electric Vehicle Charging Connector Market by Country, 2023 - 2030, USD Thousands
- TABLE 354 Brazil Electric Vehicle Charging Connector Market, 2019 - 2022, USD Thousands
- TABLE 355 Brazil Electric Vehicle Charging Connector Market, 2023 - 2030, USD Thousands
- TABLE 356 Brazil Electric Vehicle Charging Connector Market by End User, 2019 - 2022, USD Thousands
- TABLE 357 Brazil Electric Vehicle Charging Connector Market by End User, 2023 - 2030, USD Thousands
- TABLE 358 Brazil Electric Vehicle Charging Connector Market by Type, 2019 - 2022, USD Thousands
- TABLE 359 Brazil Electric Vehicle Charging Connector Market by Type, 2023 - 2030, USD Thousands
- TABLE 360 Brazil Electric Vehicle Charging Connector Market by Charging Speed, 2019 - 2022, USD Thousands
- TABLE 361 Brazil Electric Vehicle Charging Connector Market by Charging Speed, 2023 - 2030, USD Thousands
- TABLE 362 Brazil Electric Vehicle Charging Connector Market by Charging Level, 2019 - 2022, USD Thousands
- TABLE 363 Brazil Electric Vehicle Charging Connector Market by Charging Level, 2023 - 2030, USD Thousands
- TABLE 364 Argentina Electric Vehicle Charging Connector Market, 2019 - 2022, USD Thousands
- TABLE 365 Argentina Electric Vehicle Charging Connector Market, 2023 - 2030, USD Thousands
- TABLE 366 Argentina Electric Vehicle Charging Connector Market by End User, 2019 - 2022, USD Thousands
- TABLE 367 Argentina Electric Vehicle Charging Connector Market by End User, 2023 - 2030, USD Thousands
- TABLE 368 Argentina Electric Vehicle Charging Connector Market by Type, 2019 - 2022, USD Thousands
- TABLE 369 Argentina Electric Vehicle Charging Connector Market by Type, 2023 - 2030, USD Thousands
- TABLE 370 Argentina Electric Vehicle Charging Connector Market by Charging Speed, 2019 - 2022, USD Thousands
- TABLE 371 Argentina Electric Vehicle Charging Connector Market by Charging Speed, 2023 - 2030, USD Thousands
- TABLE 372 Argentina Electric Vehicle Charging Connector Market by Charging Level, 2019 - 2022, USD Thousands
- TABLE 373 Argentina Electric Vehicle Charging Connector Market by Charging Level, 2023 - 2030, USD Thousands
- TABLE 374 UAE Electric Vehicle Charging Connector Market, 2019 - 2022, USD Thousands
- TABLE 375 UAE Electric Vehicle Charging Connector Market, 2023 - 2030, USD Thousands
- TABLE 376 UAE Electric Vehicle Charging Connector Market by End User, 2019 - 2022, USD Thousands
- TABLE 377 UAE Electric Vehicle Charging Connector Market by End User, 2023 - 2030, USD Thousands
- TABLE 378 UAE Electric Vehicle Charging Connector Market by Type, 2019 - 2022, USD Thousands
- TABLE 379 UAE Electric Vehicle Charging Connector Market by Type, 2023 - 2030, USD Thousands
- TABLE 380 UAE Electric Vehicle Charging Connector Market by Charging Speed, 2019 - 2022, USD Thousands
- TABLE 381 UAE Electric Vehicle Charging Connector Market by Charging Speed, 2023 - 2030, USD Thousands
- TABLE 382 UAE Electric Vehicle Charging Connector Market by Charging Level, 2019 - 2022, USD Thousands
- TABLE 383 UAE Electric Vehicle Charging Connector Market by Charging Level, 2023 - 2030, USD Thousands
- TABLE 384 Saudi Arabia Electric Vehicle Charging Connector Market, 2019 - 2022, USD Thousands
- TABLE 385 Saudi Arabia Electric Vehicle Charging Connector Market, 2023 - 2030, USD Thousands
- TABLE 386 Saudi Arabia Electric Vehicle Charging Connector Market by End User, 2019 - 2022, USD Thousands
- TABLE 387 Saudi Arabia Electric Vehicle Charging Connector Market by End User, 2023 - 2030, USD Thousands
- TABLE 388 Saudi Arabia Electric Vehicle Charging Connector Market by Type, 2019 - 2022, USD Thousands
- TABLE 389 Saudi Arabia Electric Vehicle Charging Connector Market by Type, 2023 - 2030, USD Thousands
- TABLE 390 Saudi Arabia Electric Vehicle Charging Connector Market by Charging Speed, 2019 - 2022, USD Thousands
- TABLE 391 Saudi Arabia Electric Vehicle Charging Connector Market by Charging Speed, 2023 - 2030, USD Thousands
- TABLE 392 Saudi Arabia Electric Vehicle Charging Connector Market by Charging Level, 2019 - 2022, USD Thousands
- TABLE 393 Saudi Arabia Electric Vehicle Charging Connector Market by Charging Level, 2023 - 2030, USD Thousands
- TABLE 394 South Africa Electric Vehicle Charging Connector Market, 2019 - 2022, USD Thousands
- TABLE 395 South Africa Electric Vehicle Charging Connector Market, 2023 - 2030, USD Thousands
- TABLE 396 South Africa Electric Vehicle Charging Connector Market by End User, 2019 - 2022, USD Thousands
- TABLE 397 South Africa Electric Vehicle Charging Connector Market by End User, 2023 - 2030, USD Thousands
- TABLE 398 South Africa Electric Vehicle Charging Connector Market by Type, 2019 - 2022, USD Thousands
- TABLE 399 South Africa Electric Vehicle Charging Connector Market by Type, 2023 - 2030, USD Thousands
- TABLE 400 South Africa Electric Vehicle Charging Connector Market by Charging Speed, 2019 - 2022, USD Thousands
- TABLE 401 South Africa Electric Vehicle Charging Connector Market by Charging Speed, 2023 - 2030, USD Thousands
- TABLE 402 South Africa Electric Vehicle Charging Connector Market by Charging Level, 2019 - 2022, USD Thousands
- TABLE 403 South Africa Electric Vehicle Charging Connector Market by Charging Level, 2023 - 2030, USD Thousands
- TABLE 404 Nigeria Electric Vehicle Charging Connector Market, 2019 - 2022, USD Thousands
- TABLE 405 Nigeria Electric Vehicle Charging Connector Market, 2023 - 2030, USD Thousands
- TABLE 406 Nigeria Electric Vehicle Charging Connector Market by End User, 2019 - 2022, USD Thousands
- TABLE 407 Nigeria Electric Vehicle Charging Connector Market by End User, 2023 - 2030, USD Thousands
- TABLE 408 Nigeria Electric Vehicle Charging Connector Market by Type, 2019 - 2022, USD Thousands
- TABLE 409 Nigeria Electric Vehicle Charging Connector Market by Type, 2023 - 2030, USD Thousands
- TABLE 410 Nigeria Electric Vehicle Charging Connector Market by Charging Speed, 2019 - 2022, USD Thousands
- TABLE 411 Nigeria Electric Vehicle Charging Connector Market by Charging Speed, 2023 - 2030, USD Thousands
- TABLE 412 Nigeria Electric Vehicle Charging Connector Market by Charging Level, 2019 - 2022, USD Thousands
- TABLE 413 Nigeria Electric Vehicle Charging Connector Market by Charging Level, 2023 - 2030, USD Thousands
- TABLE 414 Rest of LAMEA Electric Vehicle Charging Connector Market, 2019 - 2022, USD Thousands
- TABLE 415 Rest of LAMEA Electric Vehicle Charging Connector Market, 2023 - 2030, USD Thousands
- TABLE 416 Rest of LAMEA Electric Vehicle Charging Connector Market by End User, 2019 - 2022, USD Thousands
- TABLE 417 Rest of LAMEA Electric Vehicle Charging Connector Market by End User, 2023 - 2030, USD Thousands
- TABLE 418 Rest of LAMEA Electric Vehicle Charging Connector Market by Type, 2019 - 2022, USD Thousands
- TABLE 419 Rest of LAMEA Electric Vehicle Charging Connector Market by Type, 2023 - 2030, USD Thousands
- TABLE 420 Rest of LAMEA Electric Vehicle Charging Connector Market by Charging Speed, 2019 - 2022, USD Thousands
- TABLE 421 Rest of LAMEA Electric Vehicle Charging Connector Market by Charging Speed, 2023 - 2030, USD Thousands
- TABLE 422 Rest of LAMEA Electric Vehicle Charging Connector Market by Charging Level, 2019 - 2022, USD Thousands
- TABLE 423 Rest of LAMEA Electric Vehicle Charging Connector Market by Charging Level, 2023 - 2030, USD Thousands
- TABLE 424 Key information - Sumitomo Electric Industries, Ltd.
- TABLE 425 Key Information - Siemens AG
- TABLE 426 Key information - Schneider Electric SE
- TABLE 427 Key Information - Robert Bosch GmbH
- TABLE 428 Key information -TE Connectivity Ltd.
- TABLE 429 key information - Yazaki Corporation
- TABLE 430 Key Information - HUBER+SUHNER AG
- TABLE 431 Key Information - ITT, Inc.
- TABLE 432 key information - Amphenol Corporation
- TABLE 433 key Information - Tesla, Inc.
List of Figures
- FIG 1 Methodology for the research
- FIG 2 Global Electric Vehicle Charging Connector Market, 2019 - 2030, USD Thousands
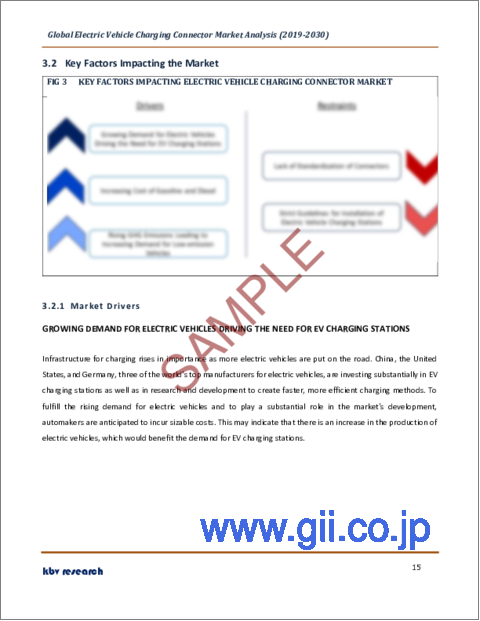
- FIG 3 Key Factors Impacting Electric Vehicle Charging Connector Market
- FIG 4 KBV Cardinal Matrix
- FIG 5 Key Leading Strategies: Percentage Distribution (2019-2023)
- FIG 6 Key Strategic Move: (Partnerships, Collaborations, and Agreements: 2021, Jul - 2023, Jul) Leading Players
- FIG 7 Porter's Five Force Analysis: ELECTRIC VEHICLE CHARGING CONNECTOR MARKET
- FIG 8 Global Electric Vehicle Charging Connector Market share by End User, 2022
- FIG 9 Global Electric Vehicle Charging Connector Market share by End User, 2030
- FIG 10 Global Electric Vehicle Charging Connector Market by End User, 2019 - 2030, USD Thousands
- FIG 11 Global Electric Vehicle Charging Connector Market share by Type, 2022
- FIG 12 Global Electric Vehicle Charging Connector Market share by Type, 2030
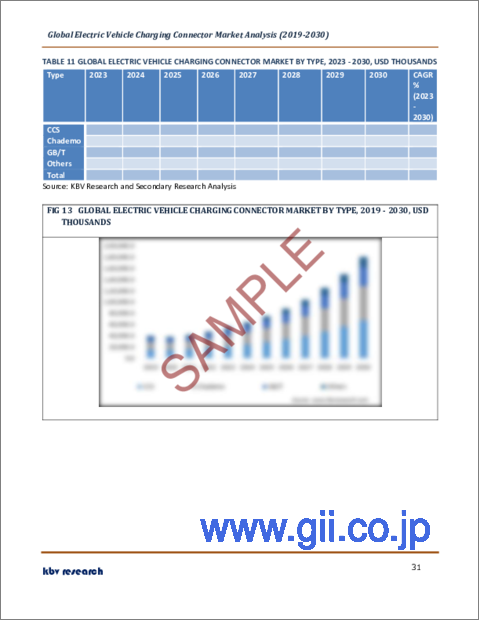
- FIG 13 Global Electric Vehicle Charging Connector Market by Type, 2019 - 2030, USD Thousands
- FIG 14 Global Electric Vehicle Charging Connector Market share by Charging Speed, 2022
- FIG 15 Global Electric Vehicle Charging Connector Market share by Charging Speed, 2030
- FIG 16 Global Electric Vehicle Charging Connector Market by Charging Speed, 2019 - 2030, USD Thousands
- FIG 17 Global Electric Vehicle Charging Connector Market share by Charging Level, 2022
- FIG 18 Global Electric Vehicle Charging Connector Market share by Charging Level, 2030
- FIG 19 Global Electric Vehicle Charging Connector Market by Charging Level, 2019 - 2030, USD Thousands
- FIG 20 Global Electric Vehicle Charging Connector Market share by Region, 2022
- FIG 21 Global Electric Vehicle Charging Connector Market share by Region, 2030
- FIG 22 Global Electric Vehicle Charging Connector Market by Region, 2019 - 2030, USD Thousands
- FIG 23 SWOT Analysis: Sumitomo Electric Industries, Ltd
- FIG 24 Recent strategies and developments: Siemens AG
- FIG 25 SWOT Analysis: Siemens AG
- FIG 26 Recent strategies and developments: Schneider Electric SE
- FIG 27 SWOT Analysis: Schneider Electric SE
- FIG 28 Recent strategies and developments: Robert Bosch GmbH
- FIG 29 SWOT Analysis: Robert Bosch GmbH
- FIG 30 SWOT Analysis: TE Connectivity Ltd
- FIG 31 SWOT Analysis: Yazaki Corporation
- FIG 32 Recent strategies and developments: HUBER+SUHNER AG
- FIG 33 SWOT Analysis: HUBER+SUHNER AG
- FIG 34 SWOT Analysis: ITT, Inc
- FIG 35 SWOT Analysis: Amphenol Corporation
- FIG 36 SWOT Analysis: Tesla, Inc
The Global Electric Vehicle Charging Connector Market size is expected to reach $181.2 million by 2030, rising at a market growth of 18.6% CAGR during the forecast period.
The demand of public charging stations is growing due to increased EV sales. Most EV owners install a Level 1 EV charging unit in their homes or apartment building. Hence, Level 1 is anticipated to acquire more than 20% share of the market by 2030. From hatchbacks like the Blade to luxurious sedans like the Tesla Model 3, electric vehicles come in various sizes. The wide range of product options has attracted a lot of customers, leading to the emergence of an industry for electric vehicles. These investments and laws are probably going to help the market grow over the coming years.
The major strategies followed by the market participants are Partnerships as the key developmental strategy to keep pace with the changing demands of end users. For instance, In December, 2022, Bosch came into collaboration with Blink Charging Co. following which Bosch became the official provider of EV Charger for General Motors dealerships in Mexico for implementing the Blink IQ 200 family of charging products and services. Additionally, In December, 2021, Schneider Electric partnered with SKIDATA for providing a seamless EV charging solution to parking managers and their customers due to the wide adoption of EVs.
Based on the Analysis presented in the Cardinal matrix, Tesla, Inc. is the major forerunner in the Market. In June, 2023, Tesla joined hands with General Motors Co., for combining the North American Charging Standard (NACS) connector design with its EVs starting in 2025 and to provide GM EV drivers access to charging at more than 12,000 Tesla Superchargers across North America. Companies such as Schneider Electric SE, Siemens AG, Robert Bosch GmbH are some of the key innovators in the Market.
Market Growth Factors
Increasing Cost of Gasoline and Diesel
The operational costs of an electric car are significantly lower than those of a comparable gasoline or diesel vehicle. Electric vehicles charge their batteries using electricity as opposed to fossil fuels like gasoline or diesel. Electric vehicles are less expensive to charge than gasoline or diesel vehicles due to their higher efficiency and lower cost of electricity. The price of electricity can be further reduced if charging is done with renewable energy sources, such as solar panels installed at bus terminals. As a result, countries all over the world are switching from conventional to electric automobiles, expanding the market.
Rising GHG Emissions Leading To Increasing Demand For Low-Emission Vehicles
The combustion of conventional fuels results in the release of GHGs such as CO2, NOx, HC, and CO. These gases and particles contribute to global warming and climate change. By using hydrogen energy for business and industrial purposes as well as transportation, GHG emissions will be significantly reduced. Many governments are expanding their fleets of electric vehicles to reduce greenhouse gas (GHG) emissions, which are mostly caused by the transportation sector. Fleet manufacturers are now required to utilize electric alternatives due to the establishment of GHG emission reduction targets. It is predicted that this will lead to growth in the market.
Market Restraining Factors
Lack of Standardization of Connectors
The lack of a common charging connector standard also has the effect of limiting charging options and raising prices. A complete and effective charging network can be expensive to establish and requires large financial commitments from both the public and private sectors. The development of charging infrastructure may be slowed down by the expensive cost. Access to charging stations that support their particular connector type may be restricted for EV owners, and the necessity to support numerous connector types comes at a higher cost to manufacturers and operators. Hence, the lack of standardization may hamper the growth of the market in the coming years.
End User Outlook
Based on end user, the market is categorized into residential and commercial. The commercial segment acquired a substantial revenue share in the market in 2022. Commercial charger installation makes it easier for employees to do their jobs and maintain charged fleets. Because of the segment's excellent growth potential, electric vehicle charging stations in office buildings have continued to increase. Commercial connectors are essential for EV owners' ability to recharge their cars while away from home, allowing them to travel farther distances and rely on public charging infrastructure for practical recharging alternatives.
Charging Speed Outlook
By charging speed, the market is bifurcated into slow and fast. The slow segment witnessed the maximum revenue share in the market in 2022. Slow charging is perfect for use at home and is the type of charging point typically seen in offices. The number of public slow charging stations installed worldwide in 2022, according to the IEA, exceeded 600 000. Of these, 360 000 were erected in China, increasing the total number of slow charging points to almost 1 thousand. More than half of the world's public slow chargers were in China as of 2022.
Type Outlook
Based on type, the market is divided into CCS, CHAdeMO, GB/T, and others. The CHAdeMO segment procured a considerable growth rate in the market in 2022. This is a Japanese-developed charging method that is now used by many OEMs, including Nissan, Mitsubishi, and Toyota. The most recent protocol supports this charger type at 600A for 500 kW of charging. CHAdeMO connectors convert alternating current (AC) in the charging point to direct current (DC) in order to power the vehicle's battery. The conversion is required to charge the EVs because AC is what the UK national grid provides.
Charging Level Outlook
On the basis of charging level, the market is segmented into level 1, level2, and level 3. The level 3 segment acquired the largest revenue share in the market in 2022. The charging level is determined by the power output of charging stations and the time needed to charge the EV accordingly. In the EV charging connector market, level 3 EV connectors predominate. This charger can charge the car from completely flat to 80% in less than 10 minutes. The level 3 EV connectors, which work with a normal 45 kW off-board charger, fall between 200 and 600 volts and are suitable for quick charging.
Regional Outlook
Region-wise, the market is analyzed across North America, Europe, Asia Pacific, and LAMEA. The Asia Pacific region recorded the largest revenue share in the market in 2022. Some of the world's economies that are growing the fastest are found in this region, including China and India. This region has a huge demand for EVs because of continuous improvements in the charging infrastructure in developing nations along with support from governments through grants, subsidies, or tax breaks. As a result, the market will increase along with the EV charging infrastructure in this region.
The market research report covers the analysis of key stakeholders of the market. Key companies profiled in the report include Sumitomo Electric Industries, Ltd., Siemens AG, Schneider Electric SE, Robert Bosch GmbH, TE Connectivity Ltd., Yazaki Corporation, HUBER+SUHNER AG, ITT, Inc., Amphenol Corporation, Tesla, Inc.
Recent strategies deployed in Electric Vehicle Charging Connector Market
Partnerships, Collaborations, and Agreements:
Jul-2023: Siemens Smart Infrastructure teamed up with ENGIE Vianeo, through its subsidiaries ENGIE Solutions and SSEC (a joint venture with CERTAS ENERGY France) for implementing state-of-the-art electric vehicle charging stations. These have been installed on the SANEF (Societe des Autoroutes du Nord et de l'Est France), APRR (Autoroutes Paris-Rhin-Rhone), AREA (Societe des Autoroutes Rhone-Alpes), and VINCI Autoroutes networks.
Jun-2023: Tesla joined hands with General Motors Co., for combining the North American Charging Standard (NACS) connector design with its EVs starting in 2025. Additionally, the collaboration aims to provide GM EV drivers access to charging at more than 12,000 Tesla Superchargers across North America. Starting in 2024, GM EV users would be able to utilize the Tesla Supercharger Network, but initially, an adapter would be needed.
Dec-2022: Bosch came into collaboration with Blink Charging Co. following which Bosch became the official provider of EV Charger for General Motors dealerships in Mexico for implementing the Blink IQ 200 family of charging products and services. As EV sales increase in Mexico, this collaboration aimed to concentrate on supplying the charging infrastructure that GM dealerships require, with the possibility of expanding the program as the electric mobility market develops across Latin America.
Oct-2022: HUBER+SUHNER announced a Memorandum of Understanding (MoU) for strengthening their focus on sharing expertise and knowledge for helping increase the development of charging infrastructure for EVs. By exchanging information and skills, SK Signet and HUBER+SUHNER seek to learn new things that would develop EV charging technologies and give customers quicker methods to recharge their cars.
Sep-2022: Siemens signed an agreement with ConnectDER, a company engaged in helping customers to decarbonize their homes, following which ConnectDER aimed to supply proprietary plug-in adapters for electric vehicle chargers to Siemens. The new charger would allow owners of electric vehicles (EVs) to charge their vehicles straight through the meter socket, which is a practical and effective place present in every home. The adaptor would save between 60 and 80 percent of the cost of installing the charger by avoiding the requirement to update an electric service panel in a residence.
Sep-2022: Siemens collaborated with EVLOMO to build one of the biggest, and most technologically advanced and future-ready EV charging networks in Southeast Asia. Following this collaboration, Siemens aimed to provide its complete range of EV chargers as well as digital offerings for charging infrastructure.
May-2022: Yazaki Corporation partnered with Aptera Motors following which Yazaki became the official supplier of engineering services and line prototype and production parts. In this partnership, Yazaki aimed to provide particular production components, such as wiring, connectivity, charge ports, and other utilities, for Aptera's LV & HV EE Electrical harness.
Product Launches and Product Expansions:
Jun-2023: HUBER+SUHNER added megawatt charging technology with its new Radox MCS1500 system to its portfolio. The charging connection enables heavy-duty electric cars to receive continuous charging currents of up to 2,250 kW at 1,500 amps.
Aug-2022: Amphenol Industrial Operations launched the Amphe-PD Mini 5.7mm and Gen2 5.7mm Amphe-PD to its Amphe-PD series with two low-profile, two-way power connectors. A PSU/PDU can be used to transfer power to a CPU or GPU PCB board using the Amphe-PD Mini 5.7mm and Gen2 5.7mm Amphe-PD. The maximum current capacity of the Amphe-PD Mini 5.7mm is 120A at 500V DC. These connections can be mounted on a PCB in three different ways: vertical, right angle, and busbar mount. The maximum current capacity for the Gen2 5.7mm Amphe-PD is 150A at 500V DC. Both connectors may carry power from a cable harness to a PCB or other power application, and their wire termination options range from 6 AWG to 2 AWG. Both connectors in this upgraded power connector series have a tiny footprint, making them perfect for use in electrical devices with restricted space, such as servers, 5G, HPC, energy storage racks, and data center equipment.
Jul-2022: Bosch unveiled the EV300 Level 2 EV Charging Station and EV3000 DC Fast Charger, two new electric vehicle chargers. Both chargers were developed to offer a less expensive charging option without sacrificing security and charging efficiency. The UL and cUL compliance of the EV300 and EV3000 ensures the highest level of safety for users, cars, and the surrounding region.
May-2022: Schneider Electric released a new EV Charging solution for resilient, effective, and sustainable electric mobility and net-zero buildings. By integrating EV charging infrastructure into the facilities, Schneider Electric is advancing its mission to make buildings smarter and more environmentally friendly overall.
Scope of the Study
Market Segments covered in the Report:
By End User
- Residential
- Commercial
By Type
- CCS
- Chademo
- GB/T
- Others
By Charging Speed
- Slow
- Fast
By Charging Level
- Level 3
- Level 2
- Level 1
By Geography
- North America
- US
- Canada
- Mexico
- Rest of North America
- Europe
- Germany
- UK
- France
- Russia
- Norway
- Netherlands
- Rest of Europe
- Asia Pacific
- China
- Japan
- India
- South Korea
- Singapore
- Taiwan
- Rest of Asia Pacific
- LAMEA
- Brazil
- Argentina
- UAE
- Saudi Arabia
- South Africa
- Nigeria
- Rest of LAMEA
Companies Profiled
- Sumitomo Electric Industries, Ltd.
- Siemens AG
- Schneider Electric SE
- Robert Bosch GmbH
- TE Connectivity Ltd.
- Yazaki Corporation
- HUBER+SUHNER AG
- ITT, Inc.
- Amphenol Corporation
- Tesla, Inc.
Unique Offerings from KBV Research
- Exhaustive coverage
- Highest number of market tables and figures
- Subscription based model available
- Guaranteed best price
- Assured post sales research support with 10% customization free
Table of Contents
Chapter 1. Market Scope & Methodology
- 1.1 Market Definition
- 1.2 Objectives
- 1.3 Market Scope
- 1.4 Segmentation
- 1.4.1 Global Electric Vehicle Charging Connector Market, by End User
- 1.4.2 Global Electric Vehicle Charging Connector Market, by Type
- 1.4.3 Global Electric Vehicle Charging Connector Market, by Charging Speed
- 1.4.4 Global Electric Vehicle Charging Connector Market, by Charging Level
- 1.4.5 Global Electric Vehicle Charging Connector Market, by Geography
- 1.5 Methodology for the research
Chapter 2. Market at a Glance
- 2.1 Key Highlights
Chapter 3. Market Overview
- 3.1 Introduction
- 3.1.1 Overview
- 3.1.1.1 Market Composition and Scenario
- 3.1.1 Overview
- 3.2 Key Factors Impacting the Market
- 3.2.1 Market Drivers
- 3.2.2 Market Restraints
Chapter 4. Competition Analysis - Global
- 4.1 KBV Cardinal Matrix
- 4.2 Recent Industry Wide Strategic Developments
- 4.2.1 Partnerships, Collaborations and Agreements
- 4.2.2 Product Launches and Product Expansions
- 4.2.3 Acquisition and Mergers
- 4.3 Top Winning Strategies
- 4.3.1 Key Leading Strategies: Percentage Distribution (2019-2023)
- 4.3.2 Key Strategic Move: (Partnerships, Collaborations, and Agreements: 2021, Jul - 2023, Jul) Leading Players
- 4.4 Porter's Five Force Analysis
Chapter 5. Global Electric Vehicle Charging Connector Market by End User
- 5.1 Global Residential Market by Region
- 5.2 Global Commercial Market by Region
Chapter 6. Global Electric Vehicle Charging Connector Market by Type
- 6.1 Global CCS Market by Region
- 6.2 Global Chademo Market by Region
- 6.3 Global GB/T Market by Region
- 6.4 Global Others Market by Region
Chapter 7. Global Electric Vehicle Charging Connector Market by Charging Speed
- 7.1 Global Slow Market by Region
- 7.2 Global Fast Market by Region
Chapter 8. Global Electric Vehicle Charging Connector Market by Charging Level
- 8.1 Global Level 3 Market by Region
- 8.2 Global Level 2 Market by Region
- 8.3 Global Level 1 Market by Region
Chapter 9. Global Electric Vehicle Charging Connector Market by Region
- 9.1 North America Electric Vehicle Charging Connector Market
- 9.1.1 North America Electric Vehicle Charging Connector Market by End User
- 9.1.1.1 North America Residential Market by Country
- 9.1.1.2 North America Commercial Market by Country
- 9.1.2 North America Electric Vehicle Charging Connector Market by Type
- 9.1.2.1 North America CCS Market by Country
- 9.1.2.2 North America Chademo Market by Country
- 9.1.2.3 North America GB/T Market by Country
- 9.1.2.4 North America Others Market by Country
- 9.1.3 North America Electric Vehicle Charging Connector Market by Charging Speed
- 9.1.3.1 North America Slow Market by Country
- 9.1.3.2 North America Fast Market by Country
- 9.1.4 North America Electric Vehicle Charging Connector Market by Charging Level
- 9.1.4.1 North America Level 3 Market by Country
- 9.1.4.2 North America Level 2 Market by Country
- 9.1.4.3 North America Level 1 Market by Country
- 9.1.5 North America Electric Vehicle Charging Connector Market by Country
- 9.1.5.1 US Electric Vehicle Charging Connector Market
- 9.1.5.1.1 US Electric Vehicle Charging Connector Market by End User
- 9.1.5.1.2 US Electric Vehicle Charging Connector Market by Type
- 9.1.5.1.3 US Electric Vehicle Charging Connector Market by Charging Speed
- 9.1.5.1.4 US Electric Vehicle Charging Connector Market by Charging Level
- 9.1.5.2 Canada Electric Vehicle Charging Connector Market
- 9.1.5.2.1 Canada Electric Vehicle Charging Connector Market by End User
- 9.1.5.2.2 Canada Electric Vehicle Charging Connector Market by Type
- 9.1.5.2.3 Canada Electric Vehicle Charging Connector Market by Charging Speed
- 9.1.5.2.4 Canada Electric Vehicle Charging Connector Market by Charging Level
- 9.1.5.3 Mexico Electric Vehicle Charging Connector Market
- 9.1.5.3.1 Mexico Electric Vehicle Charging Connector Market by End User
- 9.1.5.3.2 Mexico Electric Vehicle Charging Connector Market by Type
- 9.1.5.3.3 Mexico Electric Vehicle Charging Connector Market by Charging Speed
- 9.1.5.3.4 Mexico Electric Vehicle Charging Connector Market by Charging Level
- 9.1.5.4 Rest of North America Electric Vehicle Charging Connector Market
- 9.1.5.4.1 Rest of North America Electric Vehicle Charging Connector Market by End User
- 9.1.5.4.2 Rest of North America Electric Vehicle Charging Connector Market by Type
- 9.1.5.4.3 Rest of North America Electric Vehicle Charging Connector Market by Charging Speed
- 9.1.5.4.4 Rest of North America Electric Vehicle Charging Connector Market by Charging Level
- 9.1.5.1 US Electric Vehicle Charging Connector Market
- 9.1.1 North America Electric Vehicle Charging Connector Market by End User
- 9.2 Europe Electric Vehicle Charging Connector Market
- 9.2.1 Europe Electric Vehicle Charging Connector Market by End User
- 9.2.1.1 Europe Residential Market by Country
- 9.2.1.2 Europe Commercial Market by Country
- 9.2.2 Europe Electric Vehicle Charging Connector Market by Type
- 9.2.2.1 Europe CCS Market by Country
- 9.2.2.2 Europe Chademo Market by Country
- 9.2.2.3 Europe GB/T Market by Country
- 9.2.2.4 Europe Others Market by Country
- 9.2.3 Europe Electric Vehicle Charging Connector Market by Charging Speed
- 9.2.3.1 Europe Slow Market by Country
- 9.2.3.2 Europe Fast Market by Country
- 9.2.4 Europe Electric Vehicle Charging Connector Market by Charging Level
- 9.2.4.1 Europe Level 3 Market by Country
- 9.2.4.2 Europe Level 2 Market by Country
- 9.2.4.3 Europe Level 1 Market by Country
- 9.2.5 Europe Electric Vehicle Charging Connector Market by Country
- 9.2.5.1 Germany Electric Vehicle Charging Connector Market
- 9.2.5.1.1 Germany Electric Vehicle Charging Connector Market by End User
- 9.2.5.1.2 Germany Electric Vehicle Charging Connector Market by Type
- 9.2.5.1.3 Germany Electric Vehicle Charging Connector Market by Charging Speed
- 9.2.5.1.4 Germany Electric Vehicle Charging Connector Market by Charging Level
- 9.2.5.2 UK Electric Vehicle Charging Connector Market
- 9.2.5.2.1 UK Electric Vehicle Charging Connector Market by End User
- 9.2.5.2.2 UK Electric Vehicle Charging Connector Market by Type
- 9.2.5.2.3 UK Electric Vehicle Charging Connector Market by Charging Speed
- 9.2.5.2.4 UK Electric Vehicle Charging Connector Market by Charging Level
- 9.2.5.3 France Electric Vehicle Charging Connector Market
- 9.2.5.3.1 France Electric Vehicle Charging Connector Market by End User
- 9.2.5.3.2 France Electric Vehicle Charging Connector Market by Type
- 9.2.5.3.3 France Electric Vehicle Charging Connector Market by Charging Speed
- 9.2.5.3.4 France Electric Vehicle Charging Connector Market by Charging Level
- 9.2.5.4 Russia Electric Vehicle Charging Connector Market
- 9.2.5.4.1 Russia Electric Vehicle Charging Connector Market by End User
- 9.2.5.4.2 Russia Electric Vehicle Charging Connector Market by Type
- 9.2.5.4.3 Russia Electric Vehicle Charging Connector Market by Charging Speed
- 9.2.5.4.4 Russia Electric Vehicle Charging Connector Market by Charging Level
- 9.2.5.5 Norway Electric Vehicle Charging Connector Market
- 9.2.5.5.1 Norway Electric Vehicle Charging Connector Market by End User
- 9.2.5.5.2 Norway Electric Vehicle Charging Connector Market by Type
- 9.2.5.5.3 Norway Electric Vehicle Charging Connector Market by Charging Speed
- 9.2.5.5.4 Norway Electric Vehicle Charging Connector Market by Charging Level
- 9.2.5.6 Netherlands Electric Vehicle Charging Connector Market
- 9.2.5.6.1 Netherlands Electric Vehicle Charging Connector Market by End User
- 9.2.5.6.2 Netherlands Electric Vehicle Charging Connector Market by Type
- 9.2.5.6.3 Netherlands Electric Vehicle Charging Connector Market by Charging Speed
- 9.2.5.6.4 Netherlands Electric Vehicle Charging Connector Market by Charging Level
- 9.2.5.7 Rest of Europe Electric Vehicle Charging Connector Market
- 9.2.5.7.1 Rest of Europe Electric Vehicle Charging Connector Market by End User
- 9.2.5.7.2 Rest of Europe Electric Vehicle Charging Connector Market by Type
- 9.2.5.7.3 Rest of Europe Electric Vehicle Charging Connector Market by Charging Speed
- 9.2.5.7.4 Rest of Europe Electric Vehicle Charging Connector Market by Charging Level
- 9.2.5.1 Germany Electric Vehicle Charging Connector Market
- 9.2.1 Europe Electric Vehicle Charging Connector Market by End User
- 9.3 Asia Pacific Electric Vehicle Charging Connector Market
- 9.3.1 Asia Pacific Electric Vehicle Charging Connector Market by End User
- 9.3.1.1 Asia Pacific Residential Market by Country
- 9.3.1.2 Asia Pacific Commercial Market by Country
- 9.3.2 Asia Pacific Electric Vehicle Charging Connector Market by Type
- 9.3.2.1 Asia Pacific CCS Market by Country
- 9.3.2.2 Asia Pacific Chademo Market by Country
- 9.3.2.3 Asia Pacific GB/T Market by Country
- 9.3.2.4 Asia Pacific Others Market by Country
- 9.3.3 Asia Pacific Electric Vehicle Charging Connector Market by Charging Speed
- 9.3.3.1 Asia Pacific Slow Market by Country
- 9.3.3.2 Asia Pacific Fast Market by Country
- 9.3.4 Asia Pacific Electric Vehicle Charging Connector Market by Charging Level
- 9.3.4.1 Asia Pacific Level 3 Market by Country
- 9.3.4.2 Asia Pacific Level 2 Market by Country
- 9.3.4.3 Asia Pacific Level 1 Market by Country
- 9.3.5 Asia Pacific Electric Vehicle Charging Connector Market by Country
- 9.3.5.1 China Electric Vehicle Charging Connector Market
- 9.3.5.1.1 China Electric Vehicle Charging Connector Market by End User
- 9.3.5.1.2 China Electric Vehicle Charging Connector Market by Type
- 9.3.5.1.3 China Electric Vehicle Charging Connector Market by Charging Speed
- 9.3.5.1.4 China Electric Vehicle Charging Connector Market by Charging Level
- 9.3.5.2 Japan Electric Vehicle Charging Connector Market
- 9.3.5.2.1 Japan Electric Vehicle Charging Connector Market by End User
- 9.3.5.2.2 Japan Electric Vehicle Charging Connector Market by Type
- 9.3.5.2.3 Japan Electric Vehicle Charging Connector Market by Charging Speed
- 9.3.5.2.4 Japan Electric Vehicle Charging Connector Market by Charging Level
- 9.3.5.3 Taiwan Electric Vehicle Charging Connector Market
- 9.3.5.3.1 Taiwan Electric Vehicle Charging Connector Market by End User
- 9.3.5.3.2 Taiwan Electric Vehicle Charging Connector Market by Type
- 9.3.5.3.3 Taiwan Electric Vehicle Charging Connector Market by Charging Speed
- 9.3.5.3.4 Taiwan Electric Vehicle Charging Connector Market by Charging Level
- 9.3.5.4 India Electric Vehicle Charging Connector Market
- 9.3.5.4.1 India Electric Vehicle Charging Connector Market by End User
- 9.3.5.4.2 India Electric Vehicle Charging Connector Market by Type
- 9.3.5.4.3 India Electric Vehicle Charging Connector Market by Charging Speed
- 9.3.5.4.4 India Electric Vehicle Charging Connector Market by Charging Level
- 9.3.5.5 South Korea Electric Vehicle Charging Connector Market
- 9.3.5.5.1 South Korea Electric Vehicle Charging Connector Market by End User
- 9.3.5.5.2 South Korea Electric Vehicle Charging Connector Market by Type
- 9.3.5.5.3 South Korea Electric Vehicle Charging Connector Market by Charging Speed
- 9.3.5.5.4 South Korea Electric Vehicle Charging Connector Market by Charging Level
- 9.3.5.6 Singapore Electric Vehicle Charging Connector Market
- 9.3.5.6.1 Singapore Electric Vehicle Charging Connector Market by End User
- 9.3.5.6.2 Singapore Electric Vehicle Charging Connector Market by Type
- 9.3.5.6.3 Singapore Electric Vehicle Charging Connector Market by Charging Speed
- 9.3.5.6.4 Singapore Electric Vehicle Charging Connector Market by Charging Level
- 9.3.5.7 Rest of Asia Pacific Electric Vehicle Charging Connector Market
- 9.3.5.7.1 Rest of Asia Pacific Electric Vehicle Charging Connector Market by End User
- 9.3.5.7.2 Rest of Asia Pacific Electric Vehicle Charging Connector Market by Type
- 9.3.5.7.3 Rest of Asia Pacific Electric Vehicle Charging Connector Market by Charging Speed
- 9.3.5.7.4 Rest of Asia Pacific Electric Vehicle Charging Connector Market by Charging Level
- 9.3.5.1 China Electric Vehicle Charging Connector Market
- 9.3.1 Asia Pacific Electric Vehicle Charging Connector Market by End User
- 9.4 LAMEA Electric Vehicle Charging Connector Market
- 9.4.1 LAMEA Electric Vehicle Charging Connector Market by End User
- 9.4.1.1 LAMEA Residential Market by Country
- 9.4.1.2 LAMEA Commercial Market by Country
- 9.4.2 LAMEA Electric Vehicle Charging Connector Market by Type
- 9.4.2.1 LAMEA CCS Market by Country
- 9.4.2.2 LAMEA Chademo Market by Country
- 9.4.2.3 LAMEA GB/T Market by Country
- 9.4.2.4 LAMEA Others Market by Country
- 9.4.3 LAMEA Electric Vehicle Charging Connector Market by Charging Speed
- 9.4.3.1 LAMEA Slow Market by Country
- 9.4.3.2 LAMEA Fast Market by Country
- 9.4.4 LAMEA Electric Vehicle Charging Connector Market by Charging Level
- 9.4.4.1 LAMEA Level 3 Market by Country
- 9.4.4.2 LAMEA Level 2 Market by Country
- 9.4.4.3 LAMEA Level 1 Market by Country
- 9.4.5 LAMEA Electric Vehicle Charging Connector Market by Country
- 9.4.5.1 Brazil Electric Vehicle Charging Connector Market
- 9.4.5.1.1 Brazil Electric Vehicle Charging Connector Market by End User
- 9.4.5.1.2 Brazil Electric Vehicle Charging Connector Market by Type
- 9.4.5.1.3 Brazil Electric Vehicle Charging Connector Market by Charging Speed
- 9.4.5.1.4 Brazil Electric Vehicle Charging Connector Market by Charging Level
- 9.4.5.2 Argentina Electric Vehicle Charging Connector Market
- 9.4.5.2.1 Argentina Electric Vehicle Charging Connector Market by End User
- 9.4.5.2.2 Argentina Electric Vehicle Charging Connector Market by Type
- 9.4.5.2.3 Argentina Electric Vehicle Charging Connector Market by Charging Speed
- 9.4.5.2.4 Argentina Electric Vehicle Charging Connector Market by Charging Level
- 9.4.5.3 UAE Electric Vehicle Charging Connector Market
- 9.4.5.3.1 UAE Electric Vehicle Charging Connector Market by End User
- 9.4.5.3.2 UAE Electric Vehicle Charging Connector Market by Type
- 9.4.5.3.3 UAE Electric Vehicle Charging Connector Market by Charging Speed
- 9.4.5.3.4 UAE Electric Vehicle Charging Connector Market by Charging Level
- 9.4.5.4 Saudi Arabia Electric Vehicle Charging Connector Market
- 9.4.5.4.1 Saudi Arabia Electric Vehicle Charging Connector Market by End User
- 9.4.5.4.2 Saudi Arabia Electric Vehicle Charging Connector Market by Type
- 9.4.5.4.3 Saudi Arabia Electric Vehicle Charging Connector Market by Charging Speed
- 9.4.5.4.4 Saudi Arabia Electric Vehicle Charging Connector Market by Charging Level
- 9.4.5.5 South Africa Electric Vehicle Charging Connector Market
- 9.4.5.5.1 South Africa Electric Vehicle Charging Connector Market by End User
- 9.4.5.5.2 South Africa Electric Vehicle Charging Connector Market by Type
- 9.4.5.5.3 South Africa Electric Vehicle Charging Connector Market by Charging Speed
- 9.4.5.5.4 South Africa Electric Vehicle Charging Connector Market by Charging Level
- 9.4.5.6 Nigeria Electric Vehicle Charging Connector Market
- 9.4.5.6.1 Nigeria Electric Vehicle Charging Connector Market by End User
- 9.4.5.6.2 Nigeria Electric Vehicle Charging Connector Market by Type
- 9.4.5.6.3 Nigeria Electric Vehicle Charging Connector Market by Charging Speed
- 9.4.5.6.4 Nigeria Electric Vehicle Charging Connector Market by Charging Level
- 9.4.5.7 Rest of LAMEA Electric Vehicle Charging Connector Market
- 9.4.5.7.1 Rest of LAMEA Electric Vehicle Charging Connector Market by End User
- 9.4.5.7.2 Rest of LAMEA Electric Vehicle Charging Connector Market by Type
- 9.4.5.7.3 Rest of LAMEA Electric Vehicle Charging Connector Market by Charging Speed
- 9.4.5.7.4 Rest of LAMEA Electric Vehicle Charging Connector Market by Charging Level
- 9.4.5.1 Brazil Electric Vehicle Charging Connector Market
- 9.4.1 LAMEA Electric Vehicle Charging Connector Market by End User
Chapter 10. Company Profiles
- 10.1 Sumitomo Electric Industries, Ltd.
- 10.1.1 Company Overview
- 10.1.2 Financial Analysis
- 10.1.3 Segmental and Regional Analysis
- 10.1.4 Research & Development Expenses
- 10.1.5 Recent strategies and developments:
- 10.1.5.1 Product Launches and Product Expansions:
- 10.1.6 SWOT Analysis
- 10.2 Siemens AG
- 10.2.1 Company Overview
- 10.2.2 Financial Analysis
- 10.2.3 Segmental and Regional Analysis
- 10.2.4 Research & Development Expense
- 10.2.5 Recent strategies and developments:
- 10.2.5.1 Partnerships, Collaborations, and Agreements:
- 10.2.5.2 Product Launches and Product Expansions:
- 10.2.6 SWOT Analysis
- 10.3 Schneider Electric SE
- 10.3.1 Company Overview
- 10.3.2 Financial Analysis
- 10.3.3 Segmental and Regional Analysis
- 10.3.4 Research & Development Expense
- 10.3.5 Recent strategies and developments:
- 10.3.5.1 Partnerships, Collaborations, and Agreements:
- 10.3.5.2 Product Launches and Product Expansions:
- 10.3.6 SWOT Analysis
- 10.4 Robert Bosch GmbH
- 10.4.1 Company Overview
- 10.4.2 Financial Analysis
- 10.4.3 Segmental and Regional Analysis
- 10.4.4 Research & Development Expense
- 10.4.5 Recent Strategies and Developments:
- 10.4.5.1 Product Launches and Product Expansions:
- 10.4.5.2 Partnerships, Collaborations, and Agreements:
- 10.4.6 SWOT Analysis
- 10.5 TE Connectivity Ltd.
- 10.5.1 Company Overview
- 10.5.2 Financial Analysis
- 10.5.3 Segmental and Regional Analysis
- 10.5.4 Research & Development Expense
- 10.5.5 Recent strategies and developments:
- 10.5.5.1 Acquisition and Mergers:
- 10.5.6 SWOT Analysis
- 10.6 Yazaki Corporation
- 10.6.1 Company Overview
- 10.6.2 Recent strategies and developments:
- 10.6.2.1 Partnerships, Collaborations, and Agreements:
- 10.6.3 SWOT Analysis
- 10.7 HUBER+SUHNER AG
- 10.7.1 Company Overview
- 10.7.2 Financial Analysis
- 10.7.3 Segmental and Regional Analysis
- 10.7.4 Research & Development Expenses
- 10.7.5 Recent strategies and developments:
- 10.7.5.1 Partnerships, Collaborations, and Agreements:
- 10.7.5.2 Product Launches and Product Expansions:
- 10.7.6 SWOT Analysis
- 10.8 ITT, Inc.
- 10.8.1 Company Overview
- 10.8.2 Financial Analysis
- 10.8.3 Segmental and Regional Analysis
- 10.8.4 Research & Development Expenses
- 10.8.5 SWOT Analysis
- 10.9 Amphenol Corporation
- 10.9.1 Company Overview
- 10.9.2 Financial Analysis
- 10.9.3 Segmental and Regional Analysis
- 10.9.4 Research & Development Expenses
- 10.9.5 Recent strategies and developments:
- 10.9.5.1 Product Launches and Product Expansions:
- 10.9.6 SWOT Analysis
- 10.10. Tesla, Inc.
- 10.10.1 Company Overview
- 10.10.2 Financial Analysis
- 10.10.3 Segmental and Regional Analysis
- 10.10.4 Research & Development Expense
- 10.10.5 Recent strategies and developments:
- 10.10.5.1 Partnerships, Collaborations, and Agreements:
- 10.10.6 SWOT Analysis
