|
|
市場調査レポート
商品コード
1335875
血栓溶解薬の世界市場規模、シェア、産業動向分析レポート:流通経路別、製品別、投与経路別、適応症別、地域別展望および予測、2023年~2030年Global Clot Busting Drugs Market Size, Share & Industry Trends Analysis Report By Distribution Channel, By Product, By Route of Administration, By Indication, By Regional Outlook and Forecast, 2023 - 2030 |
||||||
|
|
|||||||
|
|||||||


| 血栓溶解薬の世界市場規模、シェア、産業動向分析レポート:流通経路別、製品別、投与経路別、適応症別、地域別展望および予測、2023年~2030年 |
|
出版日: 2023年07月31日
発行: KBV Research
ページ情報: 英文 298 Pages
納期: 即納可能
|

- 全表示
- 概要
- 図表
- 目次
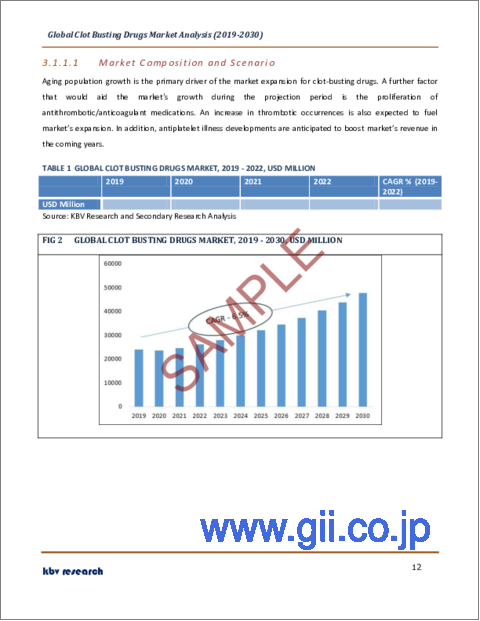
血栓溶解薬市場規模は2030年までに477億米ドルに達し、予測期間中にCAGR 7.9%の市場成長率で上昇すると予測されています。
しかし、出血リスクの増大が血栓溶解薬の主な問題点です。これらの薬剤は血栓の溶解を促すが、体内の凝固プロセスにも影響を及ぼし、出血のリスクを高める可能性があります。これは内出血や消化管出血、注射部位の出血として現れることがあります。軽い打撲から、生命を脅かすほどの出血に至ることもあります。今後数年間は、これらの問題が血栓溶解剤の市場拡大を抑制すると予想されます。さらに、パンデミック発生当初数ヶ月は、血液凝固阻止薬市場に悪影響を及ぼしました。パンデミックの間、世界の医薬品サプライチェーンは混乱し、血栓溶解剤を含むいくつかの医薬品の入手や流通に影響を及ぼしました。血液凝固阻止薬の入手は、生産上の問題、輸送の制限、重篤な治療に対する需要の高まりにより、一部の地域で制限されました。
流通チャネルの展望
流通チャネル別では、病院薬局、オンライン薬局、小売薬局に分類されます。オンラインセグメントは2022年の市場において顕著な収益シェアを記録しました。このセグメントでは、インターネット普及率の上昇により市場が拡大しています。このセグメントの成長を可能にしている他の要因には、ドアステップデリバリー、割引など、オンラインプラットフォームによって提供される利便性が含まれます。また、これらのプラットフォームを通じて血栓溶解薬が簡単に入手できることも、このセグメントの成長を支えています。
製品展望
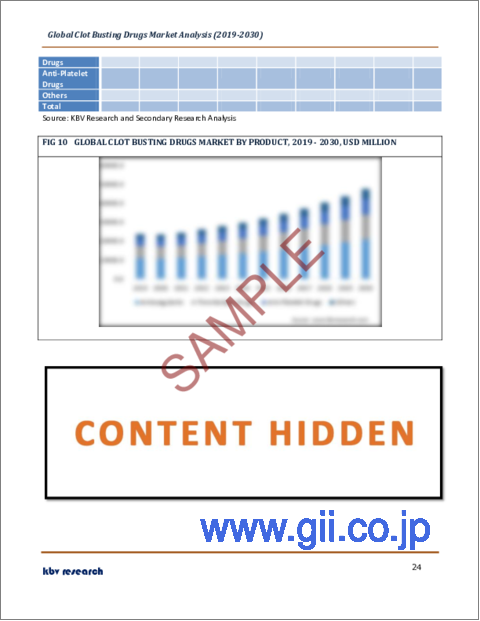
製品別では、市場は血栓溶解薬、抗血小板薬、抗凝固薬、その他に分類されます。2022年の市場では、抗凝固薬が最も高い売上シェアを占めています。凝固障害の増加が抗凝固薬サブセグメントを牽引しています。抗凝固剤の需要は、製品の浸透を高める大手企業間の戦略的合意により、将来的に発展すると予想されます。抗凝固剤市場は、高齢者人口の増加、肥満の蔓延、股関節・膝関節手術の増加などの要因により、予測期間中に成長すると予測されます。
投与経路別の展望
投与経路によって、市場は経口剤と注射剤に区分されます。経口剤セグメントは2022年の市場で大きな売上シェアを獲得しました。錠剤やタブレットによって経口投与できることが、経口血栓溶解薬の主な利点の1つです。静脈内カテーテルを挿入し、医師の厳重な監視が必要な静脈内投与療法に比べ、この投与方法はより実用的で侵襲性が低いです。
適応症の展望
適応症に基づき、市場は深部静脈血栓症、心房細動、その他、肺塞栓症に二分されます。2022年には、肺塞栓症分野が市場で最大の収益シェアを占めています。血栓が肺動脈に埋まり、血液が特定の肺領域に到達するのを妨げると、肺塞栓症(PE)を引き起こします。通常、血栓は脚で発生し、心臓の右側を上昇して肺に入る。深部静脈血栓症(DVT)はこの病態を指す医学用語です。化学療法を受ける人や肺塞栓症の家族歴のある人が増えるにつれて、血栓溶解薬の必要性が増すと思われます。
地域別展望
地域別に見ると、医薬品市場は北米、欧州、アジア太平洋、LAMEAで分析されています。2022年には、北米地域が最も高い収益シェアを獲得して市場をリードしました。この地域の血栓溶解薬に対する需要が常に高いのは、心血管疾患と老年人口の有病率が増加しているためです。高齢者は血栓ができやすいため、血栓溶解薬が必要です。このような人口動向は、おそらくこの地域の医薬品需要を牽引しています。
目次
第1章 市場範囲と調査手法
- 市場の定義
- 目的
- 市場範囲
- セグメンテーション
- 調査手法
第2章 市場の概要
- 主なハイライト
第3章 市場概要
- イントロダクション
- 概要
- 市場構成とシナリオ
- 概要
- 市場に影響を与える主な要因
- 市場促進要因
- 市場抑制要因
- ポーターのファイブフォース分析
第4章 世界の血栓破壊薬市場:流通チャネル別
- 世界の病院薬局市場:地域別
- 世界の小売薬局市場:地域別
- 世界のオンライン薬局市場:地域別
第5章 世界の血栓破壊薬市場:製品別
- 世界の抗凝固剤市場:地域別
- 世界の血栓溶解薬市場:地域別
- 世界の抗血小板薬市場:地域別
- 世界のその他の市場:地域別
第6章 世界の血栓破壊薬市場:投与経路別
- 世界の注射剤市場:地域別
- 世界の口腔市場:地域別
第7章 世界の血栓破壊薬市場:適応症別
- 世界の肺塞栓症市場:地域別
- 世界の心房細動市場:地域別
- 世界の深部静脈血栓症市場:地域別
- 世界のその他の市場:地域別
第8章 世界の血栓破壊薬市場:地域別
- 北米
- 北米の市場:国別
- 米国
- カナダ
- メキシコ
- その他北米地域
- 北米の市場:国別
- 欧州
- 欧州の市場:国別
- ドイツ
- 英国
- フランス
- ロシア
- スペイン
- イタリア
- その他欧州地域
- 欧州の市場:国別
- アジア太平洋
- アジア太平洋の市場:国別
- 中国
- 日本
- インド
- 韓国
- シンガポール
- マレーシア
- その他アジア太平洋地域
- アジア太平洋の市場:国別
- ラテンアメリカ・中東・アフリカ
- ラテンアメリカ・中東・アフリカの市場:国別
- ブラジル
- アルゼンチン
- アラブ首長国連邦
- サウジアラビア
- 南アフリカ
- ナイジェリア
- その他ラテンアメリカ・中東・アフリカ地域
- ラテンアメリカ・中東・アフリカの市場:国別
第9章 企業プロファイル
- Sanofi SA
- Dr Reddy's Laboratories Ltd.
- Bayer AG
- Boehringer Ingelheim International Gmbh
- Sun Pharmaceutical Industries Ltd
- Bristol Myers Squibb Company
- Eli Lilly And Company
- Johnson & Johnson(Johnson & Johnson Services, Inc)
- Pfizer, Inc
- Merck & Co, Inc.
第10章 血栓破壊薬市場での勝利は必須
LIST OF TABLES
- TABLE 1 Global Clot Busting Drugs Market, 2019 - 2022, USD Million
- TABLE 2 Global Clot Busting Drugs Market, 2023 - 2030, USD Million
- TABLE 3 Global Clot Busting Drugs Market by Distribution Channel, 2019 - 2022, USD Million
- TABLE 4 Global Clot Busting Drugs Market by Distribution Channel, 2023 - 2030, USD Million
- TABLE 5 Global Hospital Pharmacy Market by Region, 2019 - 2022, USD Million
- TABLE 6 Global Hospital Pharmacy Market by Region, 2023 - 2030, USD Million
- TABLE 7 Global Retail Pharmacy Market by Region, 2019 - 2022, USD Million
- TABLE 8 Global Retail Pharmacy Market by Region, 2023 - 2030, USD Million
- TABLE 9 Global Online Pharmacy Market by Region, 2019 - 2022, USD Million
- TABLE 10 Global Online Pharmacy Market by Region, 2023 - 2030, USD Million
- TABLE 11 Global Clot Busting Drugs Market by Product, 2019 - 2022, USD Million
- TABLE 12 Global Clot Busting Drugs Market by Product, 2023 - 2030, USD Million
- TABLE 13 Global Anticoagulants Market by Region, 2019 - 2022, USD Million
- TABLE 14 Global Anticoagulants Market by Region, 2023 - 2030, USD Million
- TABLE 15 Global Thrombolytic Drugs Market by Region, 2019 - 2022, USD Million
- TABLE 16 Global Thrombolytic Drugs Market by Region, 2023 - 2030, USD Million
- TABLE 17 Global Anti-Platelet Drugs Market by Region, 2019 - 2022, USD Million
- TABLE 18 Global Anti-Platelet Drugs Market by Region, 2023 - 2030, USD Million
- TABLE 19 Global Others Market by Region, 2019 - 2022, USD Million
- TABLE 20 Global Others Market by Region, 2023 - 2030, USD Million
- TABLE 21 Global Clot Busting Drugs Market by Route of Administration, 2019 - 2022, USD Million
- TABLE 22 Global Clot Busting Drugs Market by Route of Administration, 2023 - 2030, USD Million
- TABLE 23 Global Injectable Market by Region, 2019 - 2022, USD Million
- TABLE 24 Global Injectable Market by Region, 2023 - 2030, USD Million
- TABLE 25 Global Oral Market by Region, 2019 - 2022, USD Million
- TABLE 26 Global Oral Market by Region, 2023 - 2030, USD Million
- TABLE 27 Global Clot Busting Drugs Market by Indication, 2019 - 2022, USD Million
- TABLE 28 Global Clot Busting Drugs Market by Indication, 2023 - 2030, USD Million
- TABLE 29 Global Pulmonary Embolism Market by Region, 2019 - 2022, USD Million
- TABLE 30 Global Pulmonary Embolism Market by Region, 2023 - 2030, USD Million
- TABLE 31 Global Atrial Fibrillation Market by Region, 2019 - 2022, USD Million
- TABLE 32 Global Atrial Fibrillation Market by Region, 2023 - 2030, USD Million
- TABLE 33 Global Deep Vein Thrombosis Market by Region, 2019 - 2022, USD Million
- TABLE 34 Global Deep Vein Thrombosis Market by Region, 2023 - 2030, USD Million
- TABLE 35 Global Others Market by Region, 2019 - 2022, USD Million
- TABLE 36 Global Others Market by Region, 2023 - 2030, USD Million
- TABLE 37 Global Clot Busting Drugs Market by Region, 2019 - 2022, USD Million
- TABLE 38 Global Clot Busting Drugs Market by Region, 2023 - 2030, USD Million
- TABLE 39 North America Clot Busting Drugs Market, 2019 - 2022, USD Million
- TABLE 40 North America Clot Busting Drugs Market, 2023 - 2030, USD Million
- TABLE 41 North America Clot Busting Drugs Market by Distribution Channel, 2019 - 2022, USD Million
- TABLE 42 North America Clot Busting Drugs Market by Distribution Channel, 2023 - 2030, USD Million
- TABLE 43 North America Hospital Pharmacy Market by Country, 2019 - 2022, USD Million
- TABLE 44 North America Hospital Pharmacy Market by Country, 2023 - 2030, USD Million
- TABLE 45 North America Retail Pharmacy Market by Country, 2019 - 2022, USD Million
- TABLE 46 North America Retail Pharmacy Market by Country, 2023 - 2030, USD Million
- TABLE 47 North America Online Pharmacy Market by Country, 2019 - 2022, USD Million
- TABLE 48 North America Online Pharmacy Market by Country, 2023 - 2030, USD Million
- TABLE 49 North America Clot Busting Drugs Market by Product, 2019 - 2022, USD Million
- TABLE 50 North America Clot Busting Drugs Market by Product, 2023 - 2030, USD Million
- TABLE 51 North America Anticoagulants Market by Country, 2019 - 2022, USD Million
- TABLE 52 North America Anticoagulants Market by Country, 2023 - 2030, USD Million
- TABLE 53 North America Thrombolytic Drugs Market by Country, 2019 - 2022, USD Million
- TABLE 54 North America Thrombolytic Drugs Market by Country, 2023 - 2030, USD Million
- TABLE 55 North America Anti-Platelet Drugs Market by Country, 2019 - 2022, USD Million
- TABLE 56 North America Anti-Platelet Drugs Market by Country, 2023 - 2030, USD Million
- TABLE 57 North America Others Market by Country, 2019 - 2022, USD Million
- TABLE 58 North America Others Market by Country, 2023 - 2030, USD Million
- TABLE 59 North America Clot Busting Drugs Market by Route of Administration, 2019 - 2022, USD Million
- TABLE 60 North America Clot Busting Drugs Market by Route of Administration, 2023 - 2030, USD Million
- TABLE 61 North America Injectable Market by Country, 2019 - 2022, USD Million
- TABLE 62 North America Injectable Market by Country, 2023 - 2030, USD Million
- TABLE 63 North America Oral Market by Country, 2019 - 2022, USD Million
- TABLE 64 North America Oral Market by Country, 2023 - 2030, USD Million
- TABLE 65 North America Clot Busting Drugs Market by Indication, 2019 - 2022, USD Million
- TABLE 66 North America Clot Busting Drugs Market by Indication, 2023 - 2030, USD Million
- TABLE 67 North America Pulmonary Embolism Market by Country, 2019 - 2022, USD Million
- TABLE 68 North America Pulmonary Embolism Market by Country, 2023 - 2030, USD Million
- TABLE 69 North America Atrial Fibrillation Market by Country, 2019 - 2022, USD Million
- TABLE 70 North America Atrial Fibrillation Market by Country, 2023 - 2030, USD Million
- TABLE 71 North America Deep Vein Thrombosis Market by Country, 2019 - 2022, USD Million
- TABLE 72 North America Deep Vein Thrombosis Market by Country, 2023 - 2030, USD Million
- TABLE 73 North America Others Market by Country, 2019 - 2022, USD Million
- TABLE 74 North America Others Market by Country, 2023 - 2030, USD Million
- TABLE 75 North America Clot Busting Drugs Market by Country, 2019 - 2022, USD Million
- TABLE 76 North America Clot Busting Drugs Market by Country, 2023 - 2030, USD Million
- TABLE 77 US Clot Busting Drugs Market, 2019 - 2022, USD Million
- TABLE 78 US Clot Busting Drugs Market, 2023 - 2030, USD Million
- TABLE 79 US Clot Busting Drugs Market by Distribution Channel, 2019 - 2022, USD Million
- TABLE 80 US Clot Busting Drugs Market by Distribution Channel, 2023 - 2030, USD Million
- TABLE 81 US Clot Busting Drugs Market by Product, 2019 - 2022, USD Million
- TABLE 82 US Clot Busting Drugs Market by Product, 2023 - 2030, USD Million
- TABLE 83 US Clot Busting Drugs Market by Route of Administration, 2019 - 2022, USD Million
- TABLE 84 US Clot Busting Drugs Market by Route of Administration, 2023 - 2030, USD Million
- TABLE 85 US Clot Busting Drugs Market by Indication, 2019 - 2022, USD Million
- TABLE 86 US Clot Busting Drugs Market by Indication, 2023 - 2030, USD Million
- TABLE 87 Canada Clot Busting Drugs Market, 2019 - 2022, USD Million
- TABLE 88 Canada Clot Busting Drugs Market, 2023 - 2030, USD Million
- TABLE 89 Canada Clot Busting Drugs Market by Distribution Channel, 2019 - 2022, USD Million
- TABLE 90 Canada Clot Busting Drugs Market by Distribution Channel, 2023 - 2030, USD Million
- TABLE 91 Canada Clot Busting Drugs Market by Product, 2019 - 2022, USD Million
- TABLE 92 Canada Clot Busting Drugs Market by Product, 2023 - 2030, USD Million
- TABLE 93 Canada Clot Busting Drugs Market by Route of Administration, 2019 - 2022, USD Million
- TABLE 94 Canada Clot Busting Drugs Market by Route of Administration, 2023 - 2030, USD Million
- TABLE 95 Canada Clot Busting Drugs Market by Indication, 2019 - 2022, USD Million
- TABLE 96 Canada Clot Busting Drugs Market by Indication, 2023 - 2030, USD Million
- TABLE 97 Mexico Clot Busting Drugs Market, 2019 - 2022, USD Million
- TABLE 98 Mexico Clot Busting Drugs Market, 2023 - 2030, USD Million
- TABLE 99 Mexico Clot Busting Drugs Market by Distribution Channel, 2019 - 2022, USD Million
- TABLE 100 Mexico Clot Busting Drugs Market by Distribution Channel, 2023 - 2030, USD Million
- TABLE 101 Mexico Clot Busting Drugs Market by Product, 2019 - 2022, USD Million
- TABLE 102 Mexico Clot Busting Drugs Market by Product, 2023 - 2030, USD Million
- TABLE 103 Mexico Clot Busting Drugs Market by Route of Administration, 2019 - 2022, USD Million
- TABLE 104 Mexico Clot Busting Drugs Market by Route of Administration, 2023 - 2030, USD Million
- TABLE 105 Mexico Clot Busting Drugs Market by Indication, 2019 - 2022, USD Million
- TABLE 106 Mexico Clot Busting Drugs Market by Indication, 2023 - 2030, USD Million
- TABLE 107 Rest of North America Clot Busting Drugs Market, 2019 - 2022, USD Million
- TABLE 108 Rest of North America Clot Busting Drugs Market, 2023 - 2030, USD Million
- TABLE 109 Rest of North America Clot Busting Drugs Market by Distribution Channel, 2019 - 2022, USD Million
- TABLE 110 Rest of North America Clot Busting Drugs Market by Distribution Channel, 2023 - 2030, USD Million
- TABLE 111 Rest of North America Clot Busting Drugs Market by Product, 2019 - 2022, USD Million
- TABLE 112 Rest of North America Clot Busting Drugs Market by Product, 2023 - 2030, USD Million
- TABLE 113 Rest of North America Clot Busting Drugs Market by Route of Administration, 2019 - 2022, USD Million
- TABLE 114 Rest of North America Clot Busting Drugs Market by Route of Administration, 2023 - 2030, USD Million
- TABLE 115 Rest of North America Clot Busting Drugs Market by Indication, 2019 - 2022, USD Million
- TABLE 116 Rest of North America Clot Busting Drugs Market by Indication, 2023 - 2030, USD Million
- TABLE 117 Europe Clot Busting Drugs Market, 2019 - 2022, USD Million
- TABLE 118 Europe Clot Busting Drugs Market, 2023 - 2030, USD Million
- TABLE 119 Europe Clot Busting Drugs Market by Distribution Channel, 2019 - 2022, USD Million
- TABLE 120 Europe Clot Busting Drugs Market by Distribution Channel, 2023 - 2030, USD Million
- TABLE 121 Europe Hospital Pharmacy Market by Country, 2019 - 2022, USD Million
- TABLE 122 Europe Hospital Pharmacy Market by Country, 2023 - 2030, USD Million
- TABLE 123 Europe Retail Pharmacy Market by Country, 2019 - 2022, USD Million
- TABLE 124 Europe Retail Pharmacy Market by Country, 2023 - 2030, USD Million
- TABLE 125 Europe Online Pharmacy Market by Country, 2019 - 2022, USD Million
- TABLE 126 Europe Online Pharmacy Market by Country, 2023 - 2030, USD Million
- TABLE 127 Europe Clot Busting Drugs Market by Product, 2019 - 2022, USD Million
- TABLE 128 Europe Clot Busting Drugs Market by Product, 2023 - 2030, USD Million
- TABLE 129 Europe Anticoagulants Market by Country, 2019 - 2022, USD Million
- TABLE 130 Europe Anticoagulants Market by Country, 2023 - 2030, USD Million
- TABLE 131 Europe Thrombolytic Drugs Market by Country, 2019 - 2022, USD Million
- TABLE 132 Europe Thrombolytic Drugs Market by Country, 2023 - 2030, USD Million
- TABLE 133 Europe Anti-Platelet Drugs Market by Country, 2019 - 2022, USD Million
- TABLE 134 Europe Anti-Platelet Drugs Market by Country, 2023 - 2030, USD Million
- TABLE 135 Europe Others Market by Country, 2019 - 2022, USD Million
- TABLE 136 Europe Others Market by Country, 2023 - 2030, USD Million
- TABLE 137 Europe Clot Busting Drugs Market by Route of Administration, 2019 - 2022, USD Million
- TABLE 138 Europe Clot Busting Drugs Market by Route of Administration, 2023 - 2030, USD Million
- TABLE 139 Europe Injectable Market by Country, 2019 - 2022, USD Million
- TABLE 140 Europe Injectable Market by Country, 2023 - 2030, USD Million
- TABLE 141 Europe Oral Market by Country, 2019 - 2022, USD Million
- TABLE 142 Europe Oral Market by Country, 2023 - 2030, USD Million
- TABLE 143 Europe Clot Busting Drugs Market by Indication, 2019 - 2022, USD Million
- TABLE 144 Europe Clot Busting Drugs Market by Indication, 2023 - 2030, USD Million
- TABLE 145 Europe Pulmonary Embolism Market by Country, 2019 - 2022, USD Million
- TABLE 146 Europe Pulmonary Embolism Market by Country, 2023 - 2030, USD Million
- TABLE 147 Europe Atrial Fibrillation Market by Country, 2019 - 2022, USD Million
- TABLE 148 Europe Atrial Fibrillation Market by Country, 2023 - 2030, USD Million
- TABLE 149 Europe Deep Vein Thrombosis Market by Country, 2019 - 2022, USD Million
- TABLE 150 Europe Deep Vein Thrombosis Market by Country, 2023 - 2030, USD Million
- TABLE 151 Europe Others Market by Country, 2019 - 2022, USD Million
- TABLE 152 Europe Others Market by Country, 2023 - 2030, USD Million
- TABLE 153 Europe Clot Busting Drugs Market by Country, 2019 - 2022, USD Million
- TABLE 154 Europe Clot Busting Drugs Market by Country, 2023 - 2030, USD Million
- TABLE 155 Germany Clot Busting Drugs Market, 2019 - 2022, USD Million
- TABLE 156 Germany Clot Busting Drugs Market, 2023 - 2030, USD Million
- TABLE 157 Germany Clot Busting Drugs Market by Distribution Channel, 2019 - 2022, USD Million
- TABLE 158 Germany Clot Busting Drugs Market by Distribution Channel, 2023 - 2030, USD Million
- TABLE 159 Germany Clot Busting Drugs Market by Product, 2019 - 2022, USD Million
- TABLE 160 Germany Clot Busting Drugs Market by Product, 2023 - 2030, USD Million
- TABLE 161 Germany Clot Busting Drugs Market by Route of Administration, 2019 - 2022, USD Million
- TABLE 162 Germany Clot Busting Drugs Market by Route of Administration, 2023 - 2030, USD Million
- TABLE 163 Germany Clot Busting Drugs Market by Indication, 2019 - 2022, USD Million
- TABLE 164 Germany Clot Busting Drugs Market by Indication, 2023 - 2030, USD Million
- TABLE 165 UK Clot Busting Drugs Market, 2019 - 2022, USD Million
- TABLE 166 UK Clot Busting Drugs Market, 2023 - 2030, USD Million
- TABLE 167 UK Clot Busting Drugs Market by Distribution Channel, 2019 - 2022, USD Million
- TABLE 168 UK Clot Busting Drugs Market by Distribution Channel, 2023 - 2030, USD Million
- TABLE 169 UK Clot Busting Drugs Market by Product, 2019 - 2022, USD Million
- TABLE 170 UK Clot Busting Drugs Market by Product, 2023 - 2030, USD Million
- TABLE 171 UK Clot Busting Drugs Market by Route of Administration, 2019 - 2022, USD Million
- TABLE 172 UK Clot Busting Drugs Market by Route of Administration, 2023 - 2030, USD Million
- TABLE 173 UK Clot Busting Drugs Market by Indication, 2019 - 2022, USD Million
- TABLE 174 UK Clot Busting Drugs Market by Indication, 2023 - 2030, USD Million
- TABLE 175 France Clot Busting Drugs Market, 2019 - 2022, USD Million
- TABLE 176 France Clot Busting Drugs Market, 2023 - 2030, USD Million
- TABLE 177 France Clot Busting Drugs Market by Distribution Channel, 2019 - 2022, USD Million
- TABLE 178 France Clot Busting Drugs Market by Distribution Channel, 2023 - 2030, USD Million
- TABLE 179 France Clot Busting Drugs Market by Product, 2019 - 2022, USD Million
- TABLE 180 France Clot Busting Drugs Market by Product, 2023 - 2030, USD Million
- TABLE 181 France Clot Busting Drugs Market by Route of Administration, 2019 - 2022, USD Million
- TABLE 182 France Clot Busting Drugs Market by Route of Administration, 2023 - 2030, USD Million
- TABLE 183 France Clot Busting Drugs Market by Indication, 2019 - 2022, USD Million
- TABLE 184 France Clot Busting Drugs Market by Indication, 2023 - 2030, USD Million
- TABLE 185 Russia Clot Busting Drugs Market, 2019 - 2022, USD Million
- TABLE 186 Russia Clot Busting Drugs Market, 2023 - 2030, USD Million
- TABLE 187 Russia Clot Busting Drugs Market by Distribution Channel, 2019 - 2022, USD Million
- TABLE 188 Russia Clot Busting Drugs Market by Distribution Channel, 2023 - 2030, USD Million
- TABLE 189 Russia Clot Busting Drugs Market by Product, 2019 - 2022, USD Million
- TABLE 190 Russia Clot Busting Drugs Market by Product, 2023 - 2030, USD Million
- TABLE 191 Russia Clot Busting Drugs Market by Route of Administration, 2019 - 2022, USD Million
- TABLE 192 Russia Clot Busting Drugs Market by Route of Administration, 2023 - 2030, USD Million
- TABLE 193 Russia Clot Busting Drugs Market by Indication, 2019 - 2022, USD Million
- TABLE 194 Russia Clot Busting Drugs Market by Indication, 2023 - 2030, USD Million
- TABLE 195 Spain Clot Busting Drugs Market, 2019 - 2022, USD Million
- TABLE 196 Spain Clot Busting Drugs Market, 2023 - 2030, USD Million
- TABLE 197 Spain Clot Busting Drugs Market by Distribution Channel, 2019 - 2022, USD Million
- TABLE 198 Spain Clot Busting Drugs Market by Distribution Channel, 2023 - 2030, USD Million
- TABLE 199 Spain Clot Busting Drugs Market by Product, 2019 - 2022, USD Million
- TABLE 200 Spain Clot Busting Drugs Market by Product, 2023 - 2030, USD Million
- TABLE 201 Spain Clot Busting Drugs Market by Route of Administration, 2019 - 2022, USD Million
- TABLE 202 Spain Clot Busting Drugs Market by Route of Administration, 2023 - 2030, USD Million
- TABLE 203 Spain Clot Busting Drugs Market by Indication, 2019 - 2022, USD Million
- TABLE 204 Spain Clot Busting Drugs Market by Indication, 2023 - 2030, USD Million
- TABLE 205 Italy Clot Busting Drugs Market, 2019 - 2022, USD Million
- TABLE 206 Italy Clot Busting Drugs Market, 2023 - 2030, USD Million
- TABLE 207 Italy Clot Busting Drugs Market by Distribution Channel, 2019 - 2022, USD Million
- TABLE 208 Italy Clot Busting Drugs Market by Distribution Channel, 2023 - 2030, USD Million
- TABLE 209 Italy Clot Busting Drugs Market by Product, 2019 - 2022, USD Million
- TABLE 210 Italy Clot Busting Drugs Market by Product, 2023 - 2030, USD Million
- TABLE 211 Italy Clot Busting Drugs Market by Route of Administration, 2019 - 2022, USD Million
- TABLE 212 Italy Clot Busting Drugs Market by Route of Administration, 2023 - 2030, USD Million
- TABLE 213 Italy Clot Busting Drugs Market by Indication, 2019 - 2022, USD Million
- TABLE 214 Italy Clot Busting Drugs Market by Indication, 2023 - 2030, USD Million
- TABLE 215 Rest of Europe Clot Busting Drugs Market, 2019 - 2022, USD Million
- TABLE 216 Rest of Europe Clot Busting Drugs Market, 2023 - 2030, USD Million
- TABLE 217 Rest of Europe Clot Busting Drugs Market by Distribution Channel, 2019 - 2022, USD Million
- TABLE 218 Rest of Europe Clot Busting Drugs Market by Distribution Channel, 2023 - 2030, USD Million
- TABLE 219 Rest of Europe Clot Busting Drugs Market by Product, 2019 - 2022, USD Million
- TABLE 220 Rest of Europe Clot Busting Drugs Market by Product, 2023 - 2030, USD Million
- TABLE 221 Rest of Europe Clot Busting Drugs Market by Route of Administration, 2019 - 2022, USD Million
- TABLE 222 Rest of Europe Clot Busting Drugs Market by Route of Administration, 2023 - 2030, USD Million
- TABLE 223 Rest of Europe Clot Busting Drugs Market by Indication, 2019 - 2022, USD Million
- TABLE 224 Rest of Europe Clot Busting Drugs Market by Indication, 2023 - 2030, USD Million
- TABLE 225 Asia Pacific Clot Busting Drugs Market, 2019 - 2022, USD Million
- TABLE 226 Asia Pacific Clot Busting Drugs Market, 2023 - 2030, USD Million
- TABLE 227 Asia Pacific Clot Busting Drugs Market by Distribution Channel, 2019 - 2022, USD Million
- TABLE 228 Asia Pacific Clot Busting Drugs Market by Distribution Channel, 2023 - 2030, USD Million
- TABLE 229 Asia Pacific Hospital Pharmacy Market by Country, 2019 - 2022, USD Million
- TABLE 230 Asia Pacific Hospital Pharmacy Market by Country, 2023 - 2030, USD Million
- TABLE 231 Asia Pacific Retail Pharmacy Market by Country, 2019 - 2022, USD Million
- TABLE 232 Asia Pacific Retail Pharmacy Market by Country, 2023 - 2030, USD Million
- TABLE 233 Asia Pacific Online Pharmacy Market by Country, 2019 - 2022, USD Million
- TABLE 234 Asia Pacific Online Pharmacy Market by Country, 2023 - 2030, USD Million
- TABLE 235 Asia Pacific Clot Busting Drugs Market by Product, 2019 - 2022, USD Million
- TABLE 236 Asia Pacific Clot Busting Drugs Market by Product, 2023 - 2030, USD Million
- TABLE 237 Asia Pacific Anticoagulants Market by Country, 2019 - 2022, USD Million
- TABLE 238 Asia Pacific Anticoagulants Market by Country, 2023 - 2030, USD Million
- TABLE 239 Asia Pacific Thrombolytic Drugs Market by Country, 2019 - 2022, USD Million
- TABLE 240 Asia Pacific Thrombolytic Drugs Market by Country, 2023 - 2030, USD Million
- TABLE 241 Asia Pacific Anti-Platelet Drugs Market by Country, 2019 - 2022, USD Million
- TABLE 242 Asia Pacific Anti-Platelet Drugs Market by Country, 2023 - 2030, USD Million
- TABLE 243 Asia Pacific Others Market by Country, 2019 - 2022, USD Million
- TABLE 244 Asia Pacific Others Market by Country, 2023 - 2030, USD Million
- TABLE 245 Asia Pacific Clot Busting Drugs Market by Route of Administration, 2019 - 2022, USD Million
- TABLE 246 Asia Pacific Clot Busting Drugs Market by Route of Administration, 2023 - 2030, USD Million
- TABLE 247 Asia Pacific Injectable Market by Country, 2019 - 2022, USD Million
- TABLE 248 Asia Pacific Injectable Market by Country, 2023 - 2030, USD Million
- TABLE 249 Asia Pacific Oral Market by Country, 2019 - 2022, USD Million
- TABLE 250 Asia Pacific Oral Market by Country, 2023 - 2030, USD Million
- TABLE 251 Asia Pacific Clot Busting Drugs Market by Indication, 2019 - 2022, USD Million
- TABLE 252 Asia Pacific Clot Busting Drugs Market by Indication, 2023 - 2030, USD Million
- TABLE 253 Asia Pacific Pulmonary Embolism Market by Country, 2019 - 2022, USD Million
- TABLE 254 Asia Pacific Pulmonary Embolism Market by Country, 2023 - 2030, USD Million
- TABLE 255 Asia Pacific Atrial Fibrillation Market by Country, 2019 - 2022, USD Million
- TABLE 256 Asia Pacific Atrial Fibrillation Market by Country, 2023 - 2030, USD Million
- TABLE 257 Asia Pacific Deep Vein Thrombosis Market by Country, 2019 - 2022, USD Million
- TABLE 258 Asia Pacific Deep Vein Thrombosis Market by Country, 2023 - 2030, USD Million
- TABLE 259 Asia Pacific Others Market by Country, 2019 - 2022, USD Million
- TABLE 260 Asia Pacific Others Market by Country, 2023 - 2030, USD Million
- TABLE 261 Asia Pacific Clot Busting Drugs Market by Country, 2019 - 2022, USD Million
- TABLE 262 Asia Pacific Clot Busting Drugs Market by Country, 2023 - 2030, USD Million
- TABLE 263 China Clot Busting Drugs Market, 2019 - 2022, USD Million
- TABLE 264 China Clot Busting Drugs Market, 2023 - 2030, USD Million
- TABLE 265 China Clot Busting Drugs Market by Distribution Channel, 2019 - 2022, USD Million
- TABLE 266 China Clot Busting Drugs Market by Distribution Channel, 2023 - 2030, USD Million
- TABLE 267 China Clot Busting Drugs Market by Product, 2019 - 2022, USD Million
- TABLE 268 China Clot Busting Drugs Market by Product, 2023 - 2030, USD Million
- TABLE 269 China Clot Busting Drugs Market by Route of Administration, 2019 - 2022, USD Million
- TABLE 270 China Clot Busting Drugs Market by Route of Administration, 2023 - 2030, USD Million
- TABLE 271 China Clot Busting Drugs Market by Indication, 2019 - 2022, USD Million
- TABLE 272 China Clot Busting Drugs Market by Indication, 2023 - 2030, USD Million
- TABLE 273 Japan Clot Busting Drugs Market, 2019 - 2022, USD Million
- TABLE 274 Japan Clot Busting Drugs Market, 2023 - 2030, USD Million
- TABLE 275 Japan Clot Busting Drugs Market by Distribution Channel, 2019 - 2022, USD Million
- TABLE 276 Japan Clot Busting Drugs Market by Distribution Channel, 2023 - 2030, USD Million
- TABLE 277 Japan Clot Busting Drugs Market by Product, 2019 - 2022, USD Million
- TABLE 278 Japan Clot Busting Drugs Market by Product, 2023 - 2030, USD Million
- TABLE 279 Japan Clot Busting Drugs Market by Route of Administration, 2019 - 2022, USD Million
- TABLE 280 Japan Clot Busting Drugs Market by Route of Administration, 2023 - 2030, USD Million
- TABLE 281 Japan Clot Busting Drugs Market by Indication, 2019 - 2022, USD Million
- TABLE 282 Japan Clot Busting Drugs Market by Indication, 2023 - 2030, USD Million
- TABLE 283 India Clot Busting Drugs Market, 2019 - 2022, USD Million
- TABLE 284 India Clot Busting Drugs Market, 2023 - 2030, USD Million
- TABLE 285 India Clot Busting Drugs Market by Distribution Channel, 2019 - 2022, USD Million
- TABLE 286 India Clot Busting Drugs Market by Distribution Channel, 2023 - 2030, USD Million
- TABLE 287 India Clot Busting Drugs Market by Product, 2019 - 2022, USD Million
- TABLE 288 India Clot Busting Drugs Market by Product, 2023 - 2030, USD Million
- TABLE 289 India Clot Busting Drugs Market by Route of Administration, 2019 - 2022, USD Million
- TABLE 290 India Clot Busting Drugs Market by Route of Administration, 2023 - 2030, USD Million
- TABLE 291 India Clot Busting Drugs Market by Indication, 2019 - 2022, USD Million
- TABLE 292 India Clot Busting Drugs Market by Indication, 2023 - 2030, USD Million
- TABLE 293 South Korea Clot Busting Drugs Market, 2019 - 2022, USD Million
- TABLE 294 South Korea Clot Busting Drugs Market, 2023 - 2030, USD Million
- TABLE 295 South Korea Clot Busting Drugs Market by Distribution Channel, 2019 - 2022, USD Million
- TABLE 296 South Korea Clot Busting Drugs Market by Distribution Channel, 2023 - 2030, USD Million
- TABLE 297 South Korea Clot Busting Drugs Market by Product, 2019 - 2022, USD Million
- TABLE 298 South Korea Clot Busting Drugs Market by Product, 2023 - 2030, USD Million
- TABLE 299 South Korea Clot Busting Drugs Market by Route of Administration, 2019 - 2022, USD Million
- TABLE 300 South Korea Clot Busting Drugs Market by Route of Administration, 2023 - 2030, USD Million
- TABLE 301 South Korea Clot Busting Drugs Market by Indication, 2019 - 2022, USD Million
- TABLE 302 South Korea Clot Busting Drugs Market by Indication, 2023 - 2030, USD Million
- TABLE 303 Singapore Clot Busting Drugs Market, 2019 - 2022, USD Million
- TABLE 304 Singapore Clot Busting Drugs Market, 2023 - 2030, USD Million
- TABLE 305 Singapore Clot Busting Drugs Market by Distribution Channel, 2019 - 2022, USD Million
- TABLE 306 Singapore Clot Busting Drugs Market by Distribution Channel, 2023 - 2030, USD Million
- TABLE 307 Singapore Clot Busting Drugs Market by Product, 2019 - 2022, USD Million
- TABLE 308 Singapore Clot Busting Drugs Market by Product, 2023 - 2030, USD Million
- TABLE 309 Singapore Clot Busting Drugs Market by Route of Administration, 2019 - 2022, USD Million
- TABLE 310 Singapore Clot Busting Drugs Market by Route of Administration, 2023 - 2030, USD Million
- TABLE 311 Singapore Clot Busting Drugs Market by Indication, 2019 - 2022, USD Million
- TABLE 312 Singapore Clot Busting Drugs Market by Indication, 2023 - 2030, USD Million
- TABLE 313 Malaysia Clot Busting Drugs Market, 2019 - 2022, USD Million
- TABLE 314 Malaysia Clot Busting Drugs Market, 2023 - 2030, USD Million
- TABLE 315 Malaysia Clot Busting Drugs Market by Distribution Channel, 2019 - 2022, USD Million
- TABLE 316 Malaysia Clot Busting Drugs Market by Distribution Channel, 2023 - 2030, USD Million
- TABLE 317 Malaysia Clot Busting Drugs Market by Product, 2019 - 2022, USD Million
- TABLE 318 Malaysia Clot Busting Drugs Market by Product, 2023 - 2030, USD Million
- TABLE 319 Malaysia Clot Busting Drugs Market by Route of Administration, 2019 - 2022, USD Million
- TABLE 320 Malaysia Clot Busting Drugs Market by Route of Administration, 2023 - 2030, USD Million
- TABLE 321 Malaysia Clot Busting Drugs Market by Indication, 2019 - 2022, USD Million
- TABLE 322 Malaysia Clot Busting Drugs Market by Indication, 2023 - 2030, USD Million
- TABLE 323 Rest of Asia Pacific Clot Busting Drugs Market, 2019 - 2022, USD Million
- TABLE 324 Rest of Asia Pacific Clot Busting Drugs Market, 2023 - 2030, USD Million
- TABLE 325 Rest of Asia Pacific Clot Busting Drugs Market by Distribution Channel, 2019 - 2022, USD Million
- TABLE 326 Rest of Asia Pacific Clot Busting Drugs Market by Distribution Channel, 2023 - 2030, USD Million
- TABLE 327 Rest of Asia Pacific Clot Busting Drugs Market by Product, 2019 - 2022, USD Million
- TABLE 328 Rest of Asia Pacific Clot Busting Drugs Market by Product, 2023 - 2030, USD Million
- TABLE 329 Rest of Asia Pacific Clot Busting Drugs Market by Route of Administration, 2019 - 2022, USD Million
- TABLE 330 Rest of Asia Pacific Clot Busting Drugs Market by Route of Administration, 2023 - 2030, USD Million
- TABLE 331 Rest of Asia Pacific Clot Busting Drugs Market by Indication, 2019 - 2022, USD Million
- TABLE 332 Rest of Asia Pacific Clot Busting Drugs Market by Indication, 2023 - 2030, USD Million
- TABLE 333 LAMEA Clot Busting Drugs Market, 2019 - 2022, USD Million
- TABLE 334 LAMEA Clot Busting Drugs Market, 2023 - 2030, USD Million
- TABLE 335 LAMEA Clot Busting Drugs Market by Distribution Channel, 2019 - 2022, USD Million
- TABLE 336 LAMEA Clot Busting Drugs Market by Distribution Channel, 2023 - 2030, USD Million
- TABLE 337 LAMEA Hospital Pharmacy Market by Country, 2019 - 2022, USD Million
- TABLE 338 LAMEA Hospital Pharmacy Market by Country, 2023 - 2030, USD Million
- TABLE 339 LAMEA Retail Pharmacy Market by Country, 2019 - 2022, USD Million
- TABLE 340 LAMEA Retail Pharmacy Market by Country, 2023 - 2030, USD Million
- TABLE 341 LAMEA Online Pharmacy Market by Country, 2019 - 2022, USD Million
- TABLE 342 LAMEA Online Pharmacy Market by Country, 2023 - 2030, USD Million
- TABLE 343 LAMEA Clot Busting Drugs Market by Product, 2019 - 2022, USD Million
- TABLE 344 LAMEA Clot Busting Drugs Market by Product, 2023 - 2030, USD Million
- TABLE 345 LAMEA Anticoagulants Market by Country, 2019 - 2022, USD Million
- TABLE 346 LAMEA Anticoagulants Market by Country, 2023 - 2030, USD Million
- TABLE 347 LAMEA Thrombolytic Drugs Market by Country, 2019 - 2022, USD Million
- TABLE 348 LAMEA Thrombolytic Drugs Market by Country, 2023 - 2030, USD Million
- TABLE 349 LAMEA Anti-Platelet Drugs Market by Country, 2019 - 2022, USD Million
- TABLE 350 LAMEA Anti-Platelet Drugs Market by Country, 2023 - 2030, USD Million
- TABLE 351 LAMEA Others Market by Country, 2019 - 2022, USD Million
- TABLE 352 LAMEA Others Market by Country, 2023 - 2030, USD Million
- TABLE 353 LAMEA Clot Busting Drugs Market by Route of Administration, 2019 - 2022, USD Million
- TABLE 354 LAMEA Clot Busting Drugs Market by Route of Administration, 2023 - 2030, USD Million
- TABLE 355 LAMEA Injectable Market by Country, 2019 - 2022, USD Million
- TABLE 356 LAMEA Injectable Market by Country, 2023 - 2030, USD Million
- TABLE 357 LAMEA Oral Market by Country, 2019 - 2022, USD Million
- TABLE 358 LAMEA Oral Market by Country, 2023 - 2030, USD Million
- TABLE 359 LAMEA Clot Busting Drugs Market by Indication, 2019 - 2022, USD Million
- TABLE 360 LAMEA Clot Busting Drugs Market by Indication, 2023 - 2030, USD Million
- TABLE 361 LAMEA Pulmonary Embolism Market by Country, 2019 - 2022, USD Million
- TABLE 362 LAMEA Pulmonary Embolism Market by Country, 2023 - 2030, USD Million
- TABLE 363 LAMEA Atrial Fibrillation Market by Country, 2019 - 2022, USD Million
- TABLE 364 LAMEA Atrial Fibrillation Market by Country, 2023 - 2030, USD Million
- TABLE 365 LAMEA Deep Vein Thrombosis Market by Country, 2019 - 2022, USD Million
- TABLE 366 LAMEA Deep Vein Thrombosis Market by Country, 2023 - 2030, USD Million
- TABLE 367 LAMEA Others Market by Country, 2019 - 2022, USD Million
- TABLE 368 LAMEA Others Market by Country, 2023 - 2030, USD Million
- TABLE 369 LAMEA Clot Busting Drugs Market by Country, 2019 - 2022, USD Million
- TABLE 370 LAMEA Clot Busting Drugs Market by Country, 2023 - 2030, USD Million
- TABLE 371 Brazil Clot Busting Drugs Market, 2019 - 2022, USD Million
- TABLE 372 Brazil Clot Busting Drugs Market, 2023 - 2030, USD Million
- TABLE 373 Brazil Clot Busting Drugs Market by Distribution Channel, 2019 - 2022, USD Million
- TABLE 374 Brazil Clot Busting Drugs Market by Distribution Channel, 2023 - 2030, USD Million
- TABLE 375 Brazil Clot Busting Drugs Market by Product, 2019 - 2022, USD Million
- TABLE 376 Brazil Clot Busting Drugs Market by Product, 2023 - 2030, USD Million
- TABLE 377 Brazil Clot Busting Drugs Market by Route of Administration, 2019 - 2022, USD Million
- TABLE 378 Brazil Clot Busting Drugs Market by Route of Administration, 2023 - 2030, USD Million
- TABLE 379 Brazil Clot Busting Drugs Market by Indication, 2019 - 2022, USD Million
- TABLE 380 Brazil Clot Busting Drugs Market by Indication, 2023 - 2030, USD Million
- TABLE 381 Argentina Clot Busting Drugs Market, 2019 - 2022, USD Million
- TABLE 382 Argentina Clot Busting Drugs Market, 2023 - 2030, USD Million
- TABLE 383 Argentina Clot Busting Drugs Market by Distribution Channel, 2019 - 2022, USD Million
- TABLE 384 Argentina Clot Busting Drugs Market by Distribution Channel, 2023 - 2030, USD Million
- TABLE 385 Argentina Clot Busting Drugs Market by Product, 2019 - 2022, USD Million
- TABLE 386 Argentina Clot Busting Drugs Market by Product, 2023 - 2030, USD Million
- TABLE 387 Argentina Clot Busting Drugs Market by Route of Administration, 2019 - 2022, USD Million
- TABLE 388 Argentina Clot Busting Drugs Market by Route of Administration, 2023 - 2030, USD Million
- TABLE 389 Argentina Clot Busting Drugs Market by Indication, 2019 - 2022, USD Million
- TABLE 390 Argentina Clot Busting Drugs Market by Indication, 2023 - 2030, USD Million
- TABLE 391 UAE Clot Busting Drugs Market, 2019 - 2022, USD Million
- TABLE 392 UAE Clot Busting Drugs Market, 2023 - 2030, USD Million
- TABLE 393 UAE Clot Busting Drugs Market by Distribution Channel, 2019 - 2022, USD Million
- TABLE 394 UAE Clot Busting Drugs Market by Distribution Channel, 2023 - 2030, USD Million
- TABLE 395 UAE Clot Busting Drugs Market by Product, 2019 - 2022, USD Million
- TABLE 396 UAE Clot Busting Drugs Market by Product, 2023 - 2030, USD Million
- TABLE 397 UAE Clot Busting Drugs Market by Route of Administration, 2019 - 2022, USD Million
- TABLE 398 UAE Clot Busting Drugs Market by Route of Administration, 2023 - 2030, USD Million
- TABLE 399 UAE Clot Busting Drugs Market by Indication, 2019 - 2022, USD Million
- TABLE 400 UAE Clot Busting Drugs Market by Indication, 2023 - 2030, USD Million
- TABLE 401 Saudi Arabia Clot Busting Drugs Market, 2019 - 2022, USD Million
- TABLE 402 Saudi Arabia Clot Busting Drugs Market, 2023 - 2030, USD Million
- TABLE 403 Saudi Arabia Clot Busting Drugs Market by Distribution Channel, 2019 - 2022, USD Million
- TABLE 404 Saudi Arabia Clot Busting Drugs Market by Distribution Channel, 2023 - 2030, USD Million
- TABLE 405 Saudi Arabia Clot Busting Drugs Market by Product, 2019 - 2022, USD Million
- TABLE 406 Saudi Arabia Clot Busting Drugs Market by Product, 2023 - 2030, USD Million
- TABLE 407 Saudi Arabia Clot Busting Drugs Market by Route of Administration, 2019 - 2022, USD Million
- TABLE 408 Saudi Arabia Clot Busting Drugs Market by Route of Administration, 2023 - 2030, USD Million
- TABLE 409 Saudi Arabia Clot Busting Drugs Market by Indication, 2019 - 2022, USD Million
- TABLE 410 Saudi Arabia Clot Busting Drugs Market by Indication, 2023 - 2030, USD Million
- TABLE 411 South Africa Clot Busting Drugs Market, 2019 - 2022, USD Million
- TABLE 412 South Africa Clot Busting Drugs Market, 2023 - 2030, USD Million
- TABLE 413 South Africa Clot Busting Drugs Market by Distribution Channel, 2019 - 2022, USD Million
- TABLE 414 South Africa Clot Busting Drugs Market by Distribution Channel, 2023 - 2030, USD Million
- TABLE 415 South Africa Clot Busting Drugs Market by Product, 2019 - 2022, USD Million
- TABLE 416 South Africa Clot Busting Drugs Market by Product, 2023 - 2030, USD Million
- TABLE 417 South Africa Clot Busting Drugs Market by Route of Administration, 2019 - 2022, USD Million
- TABLE 418 South Africa Clot Busting Drugs Market by Route of Administration, 2023 - 2030, USD Million
- TABLE 419 South Africa Clot Busting Drugs Market by Indication, 2019 - 2022, USD Million
- TABLE 420 South Africa Clot Busting Drugs Market by Indication, 2023 - 2030, USD Million
- TABLE 421 Nigeria Clot Busting Drugs Market, 2019 - 2022, USD Million
- TABLE 422 Nigeria Clot Busting Drugs Market, 2023 - 2030, USD Million
- TABLE 423 Nigeria Clot Busting Drugs Market by Distribution Channel, 2019 - 2022, USD Million
- TABLE 424 Nigeria Clot Busting Drugs Market by Distribution Channel, 2023 - 2030, USD Million
- TABLE 425 Nigeria Clot Busting Drugs Market by Product, 2019 - 2022, USD Million
- TABLE 426 Nigeria Clot Busting Drugs Market by Product, 2023 - 2030, USD Million
- TABLE 427 Nigeria Clot Busting Drugs Market by Route of Administration, 2019 - 2022, USD Million
- TABLE 428 Nigeria Clot Busting Drugs Market by Route of Administration, 2023 - 2030, USD Million
- TABLE 429 Nigeria Clot Busting Drugs Market by Indication, 2019 - 2022, USD Million
- TABLE 430 Nigeria Clot Busting Drugs Market by Indication, 2023 - 2030, USD Million
- TABLE 431 Rest of LAMEA Clot Busting Drugs Market, 2019 - 2022, USD Million
- TABLE 432 Rest of LAMEA Clot Busting Drugs Market, 2023 - 2030, USD Million
- TABLE 433 Rest of LAMEA Clot Busting Drugs Market by Distribution Channel, 2019 - 2022, USD Million
- TABLE 434 Rest of LAMEA Clot Busting Drugs Market by Distribution Channel, 2023 - 2030, USD Million
- TABLE 435 Rest of LAMEA Clot Busting Drugs Market by Product, 2019 - 2022, USD Million
- TABLE 436 Rest of LAMEA Clot Busting Drugs Market by Product, 2023 - 2030, USD Million
- TABLE 437 Rest of LAMEA Clot Busting Drugs Market by Route of Administration, 2019 - 2022, USD Million
- TABLE 438 Rest of LAMEA Clot Busting Drugs Market by Route of Administration, 2023 - 2030, USD Million
- TABLE 439 Rest of LAMEA Clot Busting Drugs Market by Indication, 2019 - 2022, USD Million
- TABLE 440 Rest of LAMEA Clot Busting Drugs Market by Indication, 2023 - 2030, USD Million
- TABLE 441 Key Information - Sanofi S.A.
- TABLE 442 Key Information - Dr. Reddy's Laboratories Ltd.
- TABLE 443 Key Information - Bayer AG
- TABLE 444 Key Information - Boehringer Ingelheim International GmbH
- TABLE 445 Key Information - Sun Pharmaceutical Industries Ltd.
- TABLE 446 Key Information - Bristol Myers Squibb Company
- TABLE 447 Key Information - Eli Lilly And Company
- TABLE 448 Key Information - Johnson & Johnson
- TABLE 449 Key Information - Pfizer, Inc.
- TABLE 450 Key Information - Merck & Co., Inc.
List of Figures
- FIG 1 Methodology for the research
- FIG 2 Global Clot Busting Drugs Market, 2019 - 2030, USD Million
- FIG 3 Key Factors Impacting Clot Busting Drugs Market
- FIG 4 Porter's Five Forces Analysis - Clot Busting Drugs Market
- FIG 5 Global Clot Busting Drugs Market share by Distribution Channel, 2022
- FIG 6 Global Clot Busting Drugs Market share by Distribution Channel, 2030
- FIG 7 Global Clot Busting Drugs Market by Distribution Channel, 2019 - 2030, USD Million
- FIG 8 Global Clot Busting Drugs Market share by Product, 2022
- FIG 9 Global Clot Busting Drugs Market share by Product, 2030
- FIG 10 Global Clot Busting Drugs Market by Product, 2019 - 2030, USD Million
- FIG 11 Global Clot Busting Drugs Market share by Route of Administration, 2022
- FIG 12 Global Clot Busting Drugs Market share by Route of Administration, 2030
- FIG 13 Global Clot Busting Drugs Market by Route of Administration, 2019 - 2030, USD Million
- FIG 14 Global Clot Busting Drugs Market share by Indication, 2022
- FIG 15 Global Clot Busting Drugs Market share by Indication, 2030
- FIG 16 Global Clot Busting Drugs Market by Indication, 2019 - 2030, USD Million
- FIG 17 Global Clot Busting Drugs Market share by Region, 2022
- FIG 18 Global Clot Busting Drugs Market share by Region, 2030
- FIG 19 Global Clot Busting Drugs Market by Region, 2019 - 2030, USD Million
- FIG 20 Swot Analysis: Sanofi S.A.
- FIG 21 Swot Analysis: Dr. Reddy's Laboratories Ltd.
- FIG 22 Swot Analysis: Bayer AG
- FIG 23 Swot Analysis: Boehringer Ingelheim International GmbH
- FIG 24 SWOT Analysis: Sun Pharmaceutical Industries Ltd.
- FIG 25 SWOT Analysis: Bristol Myers Squibb Company
- FIG 26 Swot Analysis: Eli Lilly And Company
- FIG 27 Swot Analysis: Johnson & Johnson
- FIG 28 Swot Analysis: Pfizer, Inc.
- FIG 29 Swot Analysis: Pfizer, Inc.
- FIG 30 Swot Analysis: Merck & Co., Inc.
The Global Clot Busting Drugs Market size is expected to reach $47.7 billion by 2030, rising at a market growth of 7.9% CAGR during the forecast period.
Anticoagulants can aid the situation and dissolve the blood clot accumulating in the veins, resulting in lower blood pressure, which is necessary given the rising number of cardiovascular diseases cases. Therefore, Anticoagulants would generate more than 40% share of the market by 2030. Cardiovascular diseases (CVDs), which claim approximately 17.9 million lives annually, are the leading cause of mortality worldwide, according to the World Health Organization. Heart attacks and strokes account for more than four out of every five CVD deaths, with premature deaths accounting for one-third of these deaths in those under the age of 70. Unhealthy food, inactivity, cigarette use, and alcohol abuse are the four biggest behavioral risk factors for heart disease and stroke. Raised blood pressure, elevated blood glucose, elevated blood lipids, as well as being overweight and obesity might be symptoms of behavioral risk factors in people. Some the factors impacting the market are technological advances to create excellent opportunities, increased stroke cases, and growing risk of bleeding.
Cardiovascular problems can be quickly and accurately diagnosed with diagnostic imaging advancements like computed tomography (CT) scans and magnetic resonance imaging (MRI). Directly delivering thrombolytic medications to the site of the clot is one way catheter-based technology advancements, for instance, can increase efficacy while reducing systemic side effects. These technological advancements enhance patient care, treatment outcomes, and the delivery efficiency of clot-busting drugs. They also present potential for pharmaceutical firms and healthcare experts to create and distribute cutting-edge clot-busting drugs. The demand for efficient stroke treatment options, such as pharmaceuticals, medical devices, and rehabilitation therapies, is increasing as more people suffer from strokes. The World Health Organization predicts that during the next 20 years, there will be a 25% global increase in stroke cases, with the highest increases anticipated in low- and middle-income nations. Over 147,000 deaths in the United States were attributable to stroke in 2019, according to the Centers for Disease Control and Prevention (CDC). Additionally, approximately 795,000 Americans suffered a stroke in 2018, with 610,000 being first-time strokes. Additionally, rehabilitation centers are increasing the range of therapies they offer to individuals recovering from strokes so they can regain their independence. As a result, the need for clot busting drugs will grow as a result of the increasing stroke cases.
However, the increased risk of bleeding is the main problem with clot-busting drugs. These medications encourage blood clots to dissolve but can also affect the body's clotting processes, raising the risk of bleeding. This may manifest as internal or gastrointestinal hemorrhage or bleeding at the injection site. Mild bruises to a hemorrhage that poses a severe threat to one's life may be the extent of the bleeding. In the following years, these issues are anticipated to restrain the market expansion for clot-busting drugs. Furthermore, the initial months of the pandemic outbreak had an adverse impact on the market for clot-bursting drugs. During the pandemic, the world's pharmaceutical supply chain was disrupted, which affected the accessibility and distribution of several medications, including clot-bursting drugs. The availability of clot-bursting drugs was restricted in some areas due to issues with production, transportation limitations, and a rise in the demand for critical care treatments.
Distribution Channel Outlook
By distribution channel, the market is categorized into hospital pharmacy, online pharmacy, and retail pharmacy. The online segment recorded a remarkable revenue share in the market in 2022. The market is expanding in this segment as a result of the rising internet penetration. Other factors enabling growth in this segment include the convenience provided by the online platforms such as doorstep delivery, discounts and others. Also, the easy availability of clot busting drugs through these platforms supports the growth in this segment.
Product Outlook
By product, the market is classified into thrombolytic drugs, anti-platelet drugs, anticoagulants and others. The anticoagulants segment held the highest revenue share in the market in 2022. Increasing occurrences of coagulation disorders are driving the anticoagulants subsegment. The anticoagulants' demand is expected to develop in the future due to strategic agreements between major businesses that will increase product penetration. The market for anticoagulants is anticipated to grow during the forecast period due to factors including an increase in the elderly population, an increase in obesity prevalence, and an increase in hip & knee procedures.
Route of Administration Outlook
On the basis of route of administration, the market is segmented into oral and injectable. The oral segment garnered a significant revenue share in the market in 2022. The ability to be administered orally by way of a pill or tablet is one of the main benefits of oral clot-busting medications. Compared to IV therapies, which demand the insertion of an intravenous catheter and close physician supervision, this form of administration is more practical and less invasive.
Indication Outlook
Based on indication, the market is bifurcated into deep vein thrombosis, atrial fibrillation, others, and pulmonary embolism. In 2022, the pulmonary embolism segment witnessed the largest revenue share in the market. When blood clot becomes embedded in a lung artery and prevents blood from reaching a specific lung area, it causes a pulmonary embolism (PE). Typically, blood clots develop in the legs, travel up the right side of the heart, and enter the lungs. Deep vein thrombosis (DVT) is the medical term for this condition. As more people take chemotherapy or have a family history of pulmonary embolism, there will likely be an increase in the need for clot-busting medications.
Regional Outlook
Region wise, the drugs market is analyzed across North America, Europe, Asia Pacific, and LAMEA. In 2022, the North America region led the market by generating the highest revenue share. The consistently high demand for clot-busting drugs in this region results from the increasing prevalence of cardiovascular disease and the geriatric population. Clot-busting medication is necessary because older people are more susceptible to developing blood clots. This demographic trend probably drives the regional demand for these drugs.
The market research report covers the analysis of key stake holders of the market. Key companies profiled in the report include Sanofi S.A., Dr. Reddy's Laboratories Ltd., Bayer AG, Boehringer Ingelheim International GmbH, Sun Pharmaceutical Industries Ltd., Bristol Myers Squibb Company, Eli Lilly And Company, Johnson & Johnson (Johnson & Johnson Services, Inc.), Pfizer, Inc., Merck & Co., Inc.
Scope of the Study
Market Segments covered in the Report:
By Distribution Channel
- Hospital Pharmacy
- Retail Pharmacy
- Online Pharmacy
By Product
- Anticoagulants
- Thrombolytic Drugs
- Anti-Platelet Drugs
- Others
By Route of Administration
- Injectable
- Oral
By Indication
- Pulmonary Embolism
- Atrial Fibrillation
- Deep Vein Thrombosis
- Others
By Geography
- North America
- US
- Canada
- Mexico
- Rest of North America
- Europe
- Germany
- UK
- France
- Russia
- Spain
- Italy
- Rest of Europe
- Asia Pacific
- China
- Japan
- India
- South Korea
- Singapore
- Malaysia
- Rest of Asia Pacific
- LAMEA
- Brazil
- Argentina
- UAE
- Saudi Arabia
- South Africa
- Nigeria
- Rest of LAMEA
Companies Profiled
- Sanofi S.A.
- Dr. Reddy's Laboratories Ltd.
- Bayer AG
- Boehringer Ingelheim International GmbH
- Sun Pharmaceutical Industries Ltd.
- Bristol Myers Squibb Company
- Eli Lilly And Company
- Johnson & Johnson (Johnson & Johnson Services, Inc.)
- Pfizer, Inc.
- Merck & Co., Inc.
Unique Offerings from KBV Research
- Exhaustive coverage
- Highest number of market tables and figures
- Subscription based model available
- Guaranteed best price
- Assured post sales research support with 10% customization free
Table of Contents
Chapter 1. Market Scope & Methodology
- 1.1 Market Definition
- 1.2 Objectives
- 1.3 Market Scope
- 1.4 Segmentation
- 1.4.1 Global Clot Busting Drugs Market, by Distribution Channel
- 1.4.2 Global Clot Busting Drugs Market, by Product
- 1.4.3 Global Clot Busting Drugs Market, by Route of Administration
- 1.4.4 Global Clot Busting Drugs Market, by Indication
- 1.4.5 Global Clot Busting Drugs Market, by Geography
- 1.5 Methodology for the research
Chapter 2. Market at a Glance
- 2.1 Key Highlights
Chapter 3. Market Overview
- 3.1 Introduction
- 3.1.1 Overview
- 3.1.1.1 Market Composition and Scenario
- 3.1.1 Overview
- 3.2 Key Factors Impacting the Market
- 3.2.1 Market Drivers
- 3.2.2 Market Restraints
- 3.3 Porter's Five Forces Analysis
Chapter 4. Global Clot Busting Drugs Market by Distribution Channel
- 4.1 Global Hospital Pharmacy Market by Region
- 4.2 Global Retail Pharmacy Market by Region
- 4.3 Global Online Pharmacy Market by Region
Chapter 5. Global Clot Busting Drugs Market by Product
- 5.1 Global Anticoagulants Market by Region
- 5.2 Global Thrombolytic Drugs Market by Region
- 5.3 Global Anti-Platelet Drugs Market by Region
- 5.4 Global Others Market by Region
Chapter 6. Global Clot Busting Drugs Market by Route of Administration
- 6.1 Global Injectable Market by Region
- 6.2 Global Oral Market by Region
Chapter 7. Global Clot Busting Drugs Market by Indication
- 7.1 Global Pulmonary Embolism Market by Region
- 7.2 Global Atrial Fibrillation Market by Region
- 7.3 Global Deep Vein Thrombosis Market by Region
- 7.4 Global Others Market by Region
Chapter 8. Global Clot Busting Drugs Market by Region
- 8.1 North America Clot Busting Drugs Market
- 8.1.1 North America Clot Busting Drugs Market by Distribution Channel
- 8.1.1.1 North America Hospital Pharmacy Market by Country
- 8.1.1.2 North America Retail Pharmacy Market by Country
- 8.1.1.3 North America Online Pharmacy Market by Country
- 8.1.2 North America Clot Busting Drugs Market by Product
- 8.1.2.1 North America Anticoagulants Market by Country
- 8.1.2.2 North America Thrombolytic Drugs Market by Country
- 8.1.2.3 North America Anti-Platelet Drugs Market by Country
- 8.1.2.4 North America Others Market by Country
- 8.1.3 North America Clot Busting Drugs Market by Route of Administration
- 8.1.3.1 North America Injectable Market by Country
- 8.1.3.2 North America Oral Market by Country
- 8.1.4 North America Clot Busting Drugs Market by Indication
- 8.1.4.1 North America Pulmonary Embolism Market by Country
- 8.1.4.2 North America Atrial Fibrillation Market by Country
- 8.1.4.3 North America Deep Vein Thrombosis Market by Country
- 8.1.4.4 North America Others Market by Country
- 8.1.5 North America Clot Busting Drugs Market by Country
- 8.1.5.1 US Clot Busting Drugs Market
- 8.1.5.1.1 US Clot Busting Drugs Market by Distribution Channel
- 8.1.5.1.2 US Clot Busting Drugs Market by Product
- 8.1.5.1.3 US Clot Busting Drugs Market by Route of Administration
- 8.1.5.1.4 US Clot Busting Drugs Market by Indication
- 8.1.5.2 Canada Clot Busting Drugs Market
- 8.1.5.2.1 Canada Clot Busting Drugs Market by Distribution Channel
- 8.1.5.2.2 Canada Clot Busting Drugs Market by Product
- 8.1.5.2.3 Canada Clot Busting Drugs Market by Route of Administration
- 8.1.5.2.4 Canada Clot Busting Drugs Market by Indication
- 8.1.5.3 Mexico Clot Busting Drugs Market
- 8.1.5.3.1 Mexico Clot Busting Drugs Market by Distribution Channel
- 8.1.5.3.2 Mexico Clot Busting Drugs Market by Product
- 8.1.5.3.3 Mexico Clot Busting Drugs Market by Route of Administration
- 8.1.5.3.4 Mexico Clot Busting Drugs Market by Indication
- 8.1.5.4 Rest of North America Clot Busting Drugs Market
- 8.1.5.4.1 Rest of North America Clot Busting Drugs Market by Distribution Channel
- 8.1.5.4.2 Rest of North America Clot Busting Drugs Market by Product
- 8.1.5.4.3 Rest of North America Clot Busting Drugs Market by Route of Administration
- 8.1.5.4.4 Rest of North America Clot Busting Drugs Market by Indication
- 8.1.5.1 US Clot Busting Drugs Market
- 8.1.1 North America Clot Busting Drugs Market by Distribution Channel
- 8.2 Europe Clot Busting Drugs Market
- 8.2.1 Europe Clot Busting Drugs Market by Distribution Channel
- 8.2.1.1 Europe Hospital Pharmacy Market by Country
- 8.2.1.2 Europe Retail Pharmacy Market by Country
- 8.2.1.3 Europe Online Pharmacy Market by Country
- 8.2.2 Europe Clot Busting Drugs Market by Product
- 8.2.2.1 Europe Anticoagulants Market by Country
- 8.2.2.2 Europe Thrombolytic Drugs Market by Country
- 8.2.2.3 Europe Anti-Platelet Drugs Market by Country
- 8.2.2.4 Europe Others Market by Country
- 8.2.3 Europe Clot Busting Drugs Market by Route of Administration
- 8.2.3.1 Europe Injectable Market by Country
- 8.2.3.2 Europe Oral Market by Country
- 8.2.4 Europe Clot Busting Drugs Market by Indication
- 8.2.4.1 Europe Pulmonary Embolism Market by Country
- 8.2.4.2 Europe Atrial Fibrillation Market by Country
- 8.2.4.3 Europe Deep Vein Thrombosis Market by Country
- 8.2.4.4 Europe Others Market by Country
- 8.2.5 Europe Clot Busting Drugs Market by Country
- 8.2.5.1 Germany Clot Busting Drugs Market
- 8.2.5.1.1 Germany Clot Busting Drugs Market by Distribution Channel
- 8.2.5.1.2 Germany Clot Busting Drugs Market by Product
- 8.2.5.1.3 Germany Clot Busting Drugs Market by Route of Administration
- 8.2.5.1.4 Germany Clot Busting Drugs Market by Indication
- 8.2.5.2 UK Clot Busting Drugs Market
- 8.2.5.2.1 UK Clot Busting Drugs Market by Distribution Channel
- 8.2.5.2.2 UK Clot Busting Drugs Market by Product
- 8.2.5.2.3 UK Clot Busting Drugs Market by Route of Administration
- 8.2.5.2.4 UK Clot Busting Drugs Market by Indication
- 8.2.5.3 France Clot Busting Drugs Market
- 8.2.5.3.1 France Clot Busting Drugs Market by Distribution Channel
- 8.2.5.3.2 France Clot Busting Drugs Market by Product
- 8.2.5.3.3 France Clot Busting Drugs Market by Route of Administration
- 8.2.5.3.4 France Clot Busting Drugs Market by Indication
- 8.2.5.4 Russia Clot Busting Drugs Market
- 8.2.5.4.1 Russia Clot Busting Drugs Market by Distribution Channel
- 8.2.5.4.2 Russia Clot Busting Drugs Market by Product
- 8.2.5.4.3 Russia Clot Busting Drugs Market by Route of Administration
- 8.2.5.4.4 Russia Clot Busting Drugs Market by Indication
- 8.2.5.5 Spain Clot Busting Drugs Market
- 8.2.5.5.1 Spain Clot Busting Drugs Market by Distribution Channel
- 8.2.5.5.2 Spain Clot Busting Drugs Market by Product
- 8.2.5.5.3 Spain Clot Busting Drugs Market by Route of Administration
- 8.2.5.5.4 Spain Clot Busting Drugs Market by Indication
- 8.2.5.6 Italy Clot Busting Drugs Market
- 8.2.5.6.1 Italy Clot Busting Drugs Market by Distribution Channel
- 8.2.5.6.2 Italy Clot Busting Drugs Market by Product
- 8.2.5.6.3 Italy Clot Busting Drugs Market by Route of Administration
- 8.2.5.6.4 Italy Clot Busting Drugs Market by Indication
- 8.2.5.7 Rest of Europe Clot Busting Drugs Market
- 8.2.5.7.1 Rest of Europe Clot Busting Drugs Market by Distribution Channel
- 8.2.5.7.2 Rest of Europe Clot Busting Drugs Market by Product
- 8.2.5.7.3 Rest of Europe Clot Busting Drugs Market by Route of Administration
- 8.2.5.7.4 Rest of Europe Clot Busting Drugs Market by Indication
- 8.2.5.1 Germany Clot Busting Drugs Market
- 8.2.1 Europe Clot Busting Drugs Market by Distribution Channel
- 8.3 Asia Pacific Clot Busting Drugs Market
- 8.3.1 Asia Pacific Clot Busting Drugs Market by Distribution Channel
- 8.3.1.1 Asia Pacific Hospital Pharmacy Market by Country
- 8.3.1.2 Asia Pacific Retail Pharmacy Market by Country
- 8.3.1.3 Asia Pacific Online Pharmacy Market by Country
- 8.3.2 Asia Pacific Clot Busting Drugs Market by Product
- 8.3.2.1 Asia Pacific Anticoagulants Market by Country
- 8.3.2.2 Asia Pacific Thrombolytic Drugs Market by Country
- 8.3.2.3 Asia Pacific Anti-Platelet Drugs Market by Country
- 8.3.2.4 Asia Pacific Others Market by Country
- 8.3.3 Asia Pacific Clot Busting Drugs Market by Route of Administration
- 8.3.3.1 Asia Pacific Injectable Market by Country
- 8.3.3.2 Asia Pacific Oral Market by Country
- 8.3.4 Asia Pacific Clot Busting Drugs Market by Indication
- 8.3.4.1 Asia Pacific Pulmonary Embolism Market by Country
- 8.3.4.2 Asia Pacific Atrial Fibrillation Market by Country
- 8.3.4.3 Asia Pacific Deep Vein Thrombosis Market by Country
- 8.3.4.4 Asia Pacific Others Market by Country
- 8.3.5 Asia Pacific Clot Busting Drugs Market by Country
- 8.3.5.1 China Clot Busting Drugs Market
- 8.3.5.1.1 China Clot Busting Drugs Market by Distribution Channel
- 8.3.5.1.2 China Clot Busting Drugs Market by Product
- 8.3.5.1.3 China Clot Busting Drugs Market by Route of Administration
- 8.3.5.1.4 China Clot Busting Drugs Market by Indication
- 8.3.5.2 Japan Clot Busting Drugs Market
- 8.3.5.2.1 Japan Clot Busting Drugs Market by Distribution Channel
- 8.3.5.2.2 Japan Clot Busting Drugs Market by Product
- 8.3.5.2.3 Japan Clot Busting Drugs Market by Route of Administration
- 8.3.5.2.4 Japan Clot Busting Drugs Market by Indication
- 8.3.5.3 India Clot Busting Drugs Market
- 8.3.5.3.1 India Clot Busting Drugs Market by Distribution Channel
- 8.3.5.3.2 India Clot Busting Drugs Market by Product
- 8.3.5.3.3 India Clot Busting Drugs Market by Route of Administration
- 8.3.5.3.4 India Clot Busting Drugs Market by Indication
- 8.3.5.4 South Korea Clot Busting Drugs Market
- 8.3.5.4.1 South Korea Clot Busting Drugs Market by Distribution Channel
- 8.3.5.4.2 South Korea Clot Busting Drugs Market by Product
- 8.3.5.4.3 South Korea Clot Busting Drugs Market by Route of Administration
- 8.3.5.4.4 South Korea Clot Busting Drugs Market by Indication
- 8.3.5.5 Singapore Clot Busting Drugs Market
- 8.3.5.5.1 Singapore Clot Busting Drugs Market by Distribution Channel
- 8.3.5.5.2 Singapore Clot Busting Drugs Market by Product
- 8.3.5.5.3 Singapore Clot Busting Drugs Market by Route of Administration
- 8.3.5.5.4 Singapore Clot Busting Drugs Market by Indication
- 8.3.5.6 Malaysia Clot Busting Drugs Market
- 8.3.5.6.1 Malaysia Clot Busting Drugs Market by Distribution Channel
- 8.3.5.6.2 Malaysia Clot Busting Drugs Market by Product
- 8.3.5.6.3 Malaysia Clot Busting Drugs Market by Route of Administration
- 8.3.5.6.4 Malaysia Clot Busting Drugs Market by Indication
- 8.3.5.7 Rest of Asia Pacific Clot Busting Drugs Market
- 8.3.5.7.1 Rest of Asia Pacific Clot Busting Drugs Market by Distribution Channel
- 8.3.5.7.2 Rest of Asia Pacific Clot Busting Drugs Market by Product
- 8.3.5.7.3 Rest of Asia Pacific Clot Busting Drugs Market by Route of Administration
- 8.3.5.7.4 Rest of Asia Pacific Clot Busting Drugs Market by Indication
- 8.3.5.1 China Clot Busting Drugs Market
- 8.3.1 Asia Pacific Clot Busting Drugs Market by Distribution Channel
- 8.4 LAMEA Clot Busting Drugs Market
- 8.4.1 LAMEA Clot Busting Drugs Market by Distribution Channel
- 8.4.1.1 LAMEA Hospital Pharmacy Market by Country
- 8.4.1.2 LAMEA Retail Pharmacy Market by Country
- 8.4.1.3 LAMEA Online Pharmacy Market by Country
- 8.4.2 LAMEA Clot Busting Drugs Market by Product
- 8.4.2.1 LAMEA Anticoagulants Market by Country
- 8.4.2.2 LAMEA Thrombolytic Drugs Market by Country
- 8.4.2.3 LAMEA Anti-Platelet Drugs Market by Country
- 8.4.2.4 LAMEA Others Market by Country
- 8.4.3 LAMEA Clot Busting Drugs Market by Route of Administration
- 8.4.3.1 LAMEA Injectable Market by Country
- 8.4.3.2 LAMEA Oral Market by Country
- 8.4.4 LAMEA Clot Busting Drugs Market by Indication
- 8.4.4.1 LAMEA Pulmonary Embolism Market by Country
- 8.4.4.2 LAMEA Atrial Fibrillation Market by Country
- 8.4.4.3 LAMEA Deep Vein Thrombosis Market by Country
- 8.4.4.4 LAMEA Others Market by Country
- 8.4.5 LAMEA Clot Busting Drugs Market by Country
- 8.4.5.1 Brazil Clot Busting Drugs Market
- 8.4.5.1.1 Brazil Clot Busting Drugs Market by Distribution Channel
- 8.4.5.1.2 Brazil Clot Busting Drugs Market by Product
- 8.4.5.1.3 Brazil Clot Busting Drugs Market by Route of Administration
- 8.4.5.1.4 Brazil Clot Busting Drugs Market by Indication
- 8.4.5.2 Argentina Clot Busting Drugs Market
- 8.4.5.2.1 Argentina Clot Busting Drugs Market by Distribution Channel
- 8.4.5.2.2 Argentina Clot Busting Drugs Market by Product
- 8.4.5.2.3 Argentina Clot Busting Drugs Market by Route of Administration
- 8.4.5.2.4 Argentina Clot Busting Drugs Market by Indication
- 8.4.5.3 UAE Clot Busting Drugs Market
- 8.4.5.3.1 UAE Clot Busting Drugs Market by Distribution Channel
- 8.4.5.3.2 UAE Clot Busting Drugs Market by Product
- 8.4.5.3.3 UAE Clot Busting Drugs Market by Route of Administration
- 8.4.5.3.4 UAE Clot Busting Drugs Market by Indication
- 8.4.5.4 Saudi Arabia Clot Busting Drugs Market
- 8.4.5.4.1 Saudi Arabia Clot Busting Drugs Market by Distribution Channel
- 8.4.5.4.2 Saudi Arabia Clot Busting Drugs Market by Product
- 8.4.5.4.3 Saudi Arabia Clot Busting Drugs Market by Route of Administration
- 8.4.5.4.4 Saudi Arabia Clot Busting Drugs Market by Indication
- 8.4.5.5 South Africa Clot Busting Drugs Market
- 8.4.5.5.1 South Africa Clot Busting Drugs Market by Distribution Channel
- 8.4.5.5.2 South Africa Clot Busting Drugs Market by Product
- 8.4.5.5.3 South Africa Clot Busting Drugs Market by Route of Administration
- 8.4.5.5.4 South Africa Clot Busting Drugs Market by Indication
- 8.4.5.6 Nigeria Clot Busting Drugs Market
- 8.4.5.6.1 Nigeria Clot Busting Drugs Market by Distribution Channel
- 8.4.5.6.2 Nigeria Clot Busting Drugs Market by Product
- 8.4.5.6.3 Nigeria Clot Busting Drugs Market by Route of Administration
- 8.4.5.6.4 Nigeria Clot Busting Drugs Market by Indication
- 8.4.5.7 Rest of LAMEA Clot Busting Drugs Market
- 8.4.5.7.1 Rest of LAMEA Clot Busting Drugs Market by Distribution Channel
- 8.4.5.7.2 Rest of LAMEA Clot Busting Drugs Market by Product
- 8.4.5.7.3 Rest of LAMEA Clot Busting Drugs Market by Route of Administration
- 8.4.5.7.4 Rest of LAMEA Clot Busting Drugs Market by Indication
- 8.4.5.1 Brazil Clot Busting Drugs Market
- 8.4.1 LAMEA Clot Busting Drugs Market by Distribution Channel
Chapter 9. Company Profiles
- 9.1 Sanofi S.A.
- 9.1.1 Company Overview
- 9.1.2 Financial Analysis
- 9.1.3 Segmental and Regional Analysis
- 9.1.4 Research & Development Expense
- 9.1.5 Recent strategies and developments:
- 9.1.5.1 Trials and Approvals:
- 9.1.6 SWOT Analysis
- 9.2 Dr. Reddy's Laboratories Ltd.
- 9.2.1 Company Overview
- 9.2.2 Financial Analysis
- 9.2.3 Segmental and Regional Analysis
- 9.2.4 Research & Development Expense
- 9.2.5 SWOT Analysis
- 9.3 Bayer AG
- 9.3.1 Company Overview
- 9.3.2 Financial Analysis
- 9.3.3 Segmental and Regional Analysis
- 9.3.4 Research & Development Expense
- 9.3.5 SWOT Analysis
- 9.4 Boehringer Ingelheim International Gmbh
- 9.4.1 Company Overview
- 9.4.2 Financial Analysis
- 9.4.3 Regional & Segmental Analysis
- 9.4.4 Research & Development Expenses
- 9.4.5 Recent strategies and developments:
- 9.4.5.1 Partnerships, Collaborations, and Agreements:
- 9.4.6 SWOT Analysis
- 9.5 Sun Pharmaceutical Industries Ltd.
- 9.5.1 Company Overview
- 9.5.2 Financial Analysis
- 9.5.3 Regional Analysis
- 9.5.4 Research & Development Expenses
- 9.5.5 SWOT Analysis
- 9.6 Bristol Myers Squibb Company
- 9.6.1 Company Overview
- 9.6.2 Financial Analysis
- 9.6.3 Regional Analysis
- 9.6.4 Research & Development Expenses
- 9.6.5 Recent strategies and developments:
- 9.6.5.1 Partnerships, Collaborations, and Agreements:
- 9.6.6 SWOT Analysis
- 9.7 Eli Lilly And Company
- 9.7.1 Company Overview
- 9.7.2 Financial Analysis
- 9.7.3 Regional Analysis
- 9.7.4 Research & Development Expenses
- 9.7.5 SWOT Analysis
- 9.8 Johnson & Johnson (Johnson & Johnson Services, Inc.)
- 9.8.1 Company Overview
- 9.8.2 Financial Analysis
- 9.8.3 Segmental &Regional Analysis
- 9.8.4 Research & Development Expenses
- 9.8.5 SWOT Analysis
- 9.9 Pfizer, Inc.
- 9.9.1 Company Overview
- 9.9.2 Financial Analysis
- 9.9.3 SWOT Analysis
- 9.9.4 Regional & Segmental Analysis
- 9.9.5 Research & Development Expense
- 9.9.6 SWOT Analysis
- 9.10. Merck & Co., Inc.
- 9.10.1 Company Overview
- 9.10.2 Financial Analysis
- 9.10.3 Segmental and Regional Analysis
- 9.10.4 Research & Development Expenses
- 9.10.5 SWOT Analysis
