|
|
市場調査レポート
商品コード
1335486
キャプティブポータルの世界市場規模、シェア、産業動向分析レポート:オファリング別(プラットフォームとサービス)、最終用途別、地域別展望と予測、2023年~2030年Global Captive Portal Market Size, Share & Industry Trends Analysis Report By Offering (Platform and Services), By End-Use, By Regional Outlook and Forecast, 2023 - 2030 |
||||||
|
|
|||||||
|
|||||||


| キャプティブポータルの世界市場規模、シェア、産業動向分析レポート:オファリング別(プラットフォームとサービス)、最終用途別、地域別展望と予測、2023年~2030年 |
|
出版日: 2023年07月31日
発行: KBV Research
ページ情報: 英文 217 Pages
納期: 即納可能
|

- 全表示
- 概要
- 図表
- 目次
キャプティブポータルの市場規模は、2030年までに23億米ドルに達すると予測され、予測期間中のCAGRは13.8%の市場成長率で上昇します。
しかし、キャプティブポータルにはセキュリティ上の脆弱性が存在する可能性があります。ユーザーは、信頼できるキャプティブポータルになりすまして有害なネットワークや詐欺的ネットワークに接続する誘惑に駆られ、データを危険にさらす可能性があります。さらに、消費者が保護されていないキャプティブポータルに重要な情報を入力すると、データ漏洩の危険性があります。このような構成の結果、攻撃者は中間者(MITM)攻撃を行うことができ、ユーザーとポータルが交換するデータを監視し、場合によっては変更することができます。ユーザーは速やかに同意を与えなければならず、企業はデータを安全に扱い、保管しなければならず、データの処理について明確で透明性のある情報をユーザーに提供しなければならないです。したがって、プライバシーに関する懸念が考慮された結果、市場は衰退を経験すると思われます。
サービスの展望
市場セグメンテーションでは、市場はプラットフォームとサービスに区分されます。サービス分野は、2022年の市場で顕著な収益シェアを記録しました。サービスには、マネージド・サービスとプロフェッショナル・サービスが含まれます。キャプティブポータル・ソリューションに特化した専門事業者は、キャプティブポータルのプロフェッショナル・サービスやマネージド・サービスも提供しています。これらのサービスは、企業がキャプティブポータルをうまく立ち上げ、運営し、最大限に活用できるようサポートすることを目的としています。プロフェッショナル・サービスとは、専門家、スペシャリスト、エキスパートが企業をサポートするために提供するサービスです。
用途別展望
最終用途別では、旅行・運輸、ホスピタリティ・レジャー、ショッピングモール・小売店、エンターテインメント、ISP、その他のエンドユーザーに分類されます。2022年には、ホスピタリティ&レジャー分野が最大の売上シェアで市場を独占しました。キャプティブポータルの魅力的な用途により、多くのホテル、チェーン店、独立系ホテルが、宿泊客にWi-Fi接続を提供するためにキャプティブポータルの利用を決定しています。宿泊客は滞在中、趣味や仕事のためにインターネット接続を求めることが多いです。
地域別展望
地域別に見ると、市場は北米、欧州、アジア太平洋、ラテンアメリカ・中東・アフリカで分析されます。2022年には、北米地域が市場で最大の収益シェアを占めました。キャプティブポータルは、Wi-Fiネットワーク上のIoTデバイスの安全な接続と管理に貢献しました。北米では、ショッピングモール、スタジアム、空港、交通ハブなどの公共スペースが増加しているため、訪問者にWi-Fiサービスを提供するこれらのソリューションの需要が高まっています。
目次
第1章 市場範囲と調査手法
- 市場の定義
- 目的
- 市場範囲
- セグメンテーション
- 調査手法
第2章 市場の概要
- 主なハイライト
第3章 市場概要
- イントロダクション
- 概要
- 市場構成とシナリオ
- 概要
- 市場に影響を与える主な要因
- 市場促進要因
- 市場抑制要因
第4章 競合分析- 世界
- 市場シェア分析(2021年)
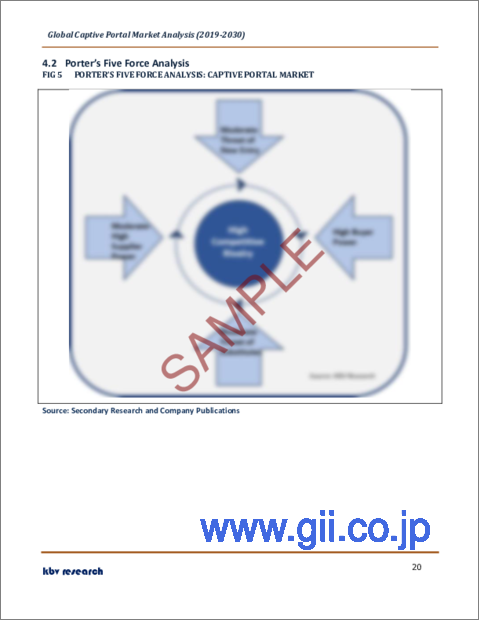
- ポーターのファイブフォース分析
- キャプティブポータル市場で展開される戦略
第5章 世界のキャプティブポータル市場:オファリング別
- 世界のプラットフォーム市場:地域別
- 世界のサービス市場:地域別
第6章 世界のキャプティブポータル市場:最終用途別
- 世界のホスピタリティ&レジャー市場:地域別
- 世界の旅行および交通市場:地域別
- 世界のエンターテインメント市場:地域別
- 世界のコワーキングスペース市場:地域別
- 世界のISP市場:地域別
- 世界のショッピングモールおよび小売アウトレット市場:地域別
- 世界のその他の市場:地域別
第7章 世界のキャプティブポータル市場:地域別
- 北米
- 北米の市場:国別
- 米国
- カナダ
- メキシコ
- その他北米地域
- 北米の市場:国別
- 欧州
- 欧州の市場:国別
- ドイツ
- 英国
- フランス
- ロシア
- スペイン
- イタリア
- その他欧州地域
- 欧州の市場:国別
- アジア太平洋
- アジア太平洋の市場:国別
- 中国
- 日本
- インド
- 韓国
- シンガポール
- マレーシア
- その他アジア太平洋地域
- アジア太平洋の市場:国別
- ラテンアメリカ・中東・アフリカ
- ラテンアメリカ・中東・アフリカの市場:国別
- ブラジル
- アルゼンチン
- アラブ首長国連邦
- サウジアラビア
- 南アフリカ
- ナイジェリア
- その他ラテンアメリカ・中東・アフリカ地域
- ラテンアメリカ・中東・アフリカの市場:国別
第8章 企業プロファイル
- Cisco Systems, Inc
- Aruba Networks(Hewlett Packard Enterprise Company)
- Juniper Networks, Inc
- Arista Networks, Inc
- Extreme Networks, Inc
- Enea AB
- Netgear, Inc
- WatchGuard Technologies, Inc(Vector Capital Plc)
- Boingo Wireless, Inc(DigitalBridge Group, Inc.)
- Grandstream Networks, Inc
第9章 キャプティブポータル市場の獲得必須条件
LIST OF TABLES
- TABLE 1 Global Captive Portal Market, 2019 - 2022, USD Million
- TABLE 2 Global Captive Portal Market, 2023 - 2030, USD Million
- TABLE 3 Global Captive Portal Market by Offering, 2019 - 2022, USD Million
- TABLE 4 Global Captive Portal Market by Offering, 2023 - 2030, USD Million
- TABLE 5 Global Platform Market by Region, 2019 - 2022, USD Million
- TABLE 6 Global Platform Market by Region, 2023 - 2030, USD Million
- TABLE 7 Global Services Market by Region, 2019 - 2022, USD Million
- TABLE 8 Global Services Market by Region, 2023 - 2030, USD Million
- TABLE 9 Global Captive Portal Market by End-use, 2019 - 2022, USD Million
- TABLE 10 Global Captive Portal Market by End-use, 2023 - 2030, USD Million
- TABLE 11 Global Hospitality & Leisure Market by Region, 2019 - 2022, USD Million
- TABLE 12 Global Hospitality & Leisure Market by Region, 2023 - 2030, USD Million
- TABLE 13 Global Travel & Transportation Market by Region, 2019 - 2022, USD Million
- TABLE 14 Global Travel & Transportation Market by Region, 2023 - 2030, USD Million
- TABLE 15 Global Entertainment Market by Region, 2019 - 2022, USD Million
- TABLE 16 Global Entertainment Market by Region, 2023 - 2030, USD Million
- TABLE 17 Global Coworking Spaces Market by Region, 2019 - 2022, USD Million
- TABLE 18 Global Coworking Spaces Market by Region, 2023 - 2030, USD Million
- TABLE 19 Global ISPs Market by Region, 2019 - 2022, USD Million
- TABLE 20 Global ISPs Market by Region, 2023 - 2030, USD Million
- TABLE 21 Global Shopping Malls & Retail Outlets Market by Region, 2019 - 2022, USD Million
- TABLE 22 Global Shopping Malls & Retail Outlets Market by Region, 2023 - 2030, USD Million
- TABLE 23 Global Others Market by Region, 2019 - 2022, USD Million
- TABLE 24 Global Others Market by Region, 2023 - 2030, USD Million
- TABLE 25 Global Captive Portal Market by Region, 2019 - 2022, USD Million
- TABLE 26 Global Captive Portal Market by Region, 2023 - 2030, USD Million
- TABLE 27 North America Captive Portal Market, 2019 - 2022, USD Million
- TABLE 28 North America Captive Portal Market, 2023 - 2030, USD Million
- TABLE 29 North America Captive Portal Market by Offering, 2019 - 2022, USD Million
- TABLE 30 North America Captive Portal Market by Offering, 2023 - 2030, USD Million
- TABLE 31 North America Platform Market by Country, 2019 - 2022, USD Million
- TABLE 32 North America Platform Market by Country, 2023 - 2030, USD Million
- TABLE 33 North America Services Market by Country, 2019 - 2022, USD Million
- TABLE 34 North America Services Market by Country, 2023 - 2030, USD Million
- TABLE 35 North America Captive Portal Market by End-use, 2019 - 2022, USD Million
- TABLE 36 North America Captive Portal Market by End-use, 2023 - 2030, USD Million
- TABLE 37 North America Hospitality & Leisure Market by Country, 2019 - 2022, USD Million
- TABLE 38 North America Hospitality & Leisure Market by Country, 2023 - 2030, USD Million
- TABLE 39 North America Travel & Transportation Market by Country, 2019 - 2022, USD Million
- TABLE 40 North America Travel & Transportation Market by Country, 2023 - 2030, USD Million
- TABLE 41 North America Entertainment Market by Country, 2019 - 2022, USD Million
- TABLE 42 North America Entertainment Market by Country, 2023 - 2030, USD Million
- TABLE 43 North America Coworking Spaces Market by Country, 2019 - 2022, USD Million
- TABLE 44 North America Coworking Spaces Market by Country, 2023 - 2030, USD Million
- TABLE 45 North America ISPs Market by Country, 2019 - 2022, USD Million
- TABLE 46 North America ISPs Market by Country, 2023 - 2030, USD Million
- TABLE 47 North America Shopping Malls & Retail Outlets Market by Country, 2019 - 2022, USD Million
- TABLE 48 North America Shopping Malls & Retail Outlets Market by Country, 2023 - 2030, USD Million
- TABLE 49 North America Others Market by Country, 2019 - 2022, USD Million
- TABLE 50 North America Others Market by Country, 2023 - 2030, USD Million
- TABLE 51 North America Captive Portal Market by Country, 2019 - 2022, USD Million
- TABLE 52 North America Captive Portal Market by Country, 2023 - 2030, USD Million
- TABLE 53 US Captive Portal Market, 2019 - 2022, USD Million
- TABLE 54 US Captive Portal Market, 2023 - 2030, USD Million
- TABLE 55 US Captive Portal Market by Offering, 2019 - 2022, USD Million
- TABLE 56 US Captive Portal Market by Offering, 2023 - 2030, USD Million
- TABLE 57 US Captive Portal Market by End-use, 2019 - 2022, USD Million
- TABLE 58 US Captive Portal Market by End-use, 2023 - 2030, USD Million
- TABLE 59 Canada Captive Portal Market, 2019 - 2022, USD Million
- TABLE 60 Canada Captive Portal Market, 2023 - 2030, USD Million
- TABLE 61 Canada Captive Portal Market by Offering, 2019 - 2022, USD Million
- TABLE 62 Canada Captive Portal Market by Offering, 2023 - 2030, USD Million
- TABLE 63 Canada Captive Portal Market by End-use, 2019 - 2022, USD Million
- TABLE 64 Canada Captive Portal Market by End-use, 2023 - 2030, USD Million
- TABLE 65 Mexico Captive Portal Market, 2019 - 2022, USD Million
- TABLE 66 Mexico Captive Portal Market, 2023 - 2030, USD Million
- TABLE 67 Mexico Captive Portal Market by Offering, 2019 - 2022, USD Million
- TABLE 68 Mexico Captive Portal Market by Offering, 2023 - 2030, USD Million
- TABLE 69 Mexico Captive Portal Market by End-use, 2019 - 2022, USD Million
- TABLE 70 Mexico Captive Portal Market by End-use, 2023 - 2030, USD Million
- TABLE 71 Rest of North America Captive Portal Market, 2019 - 2022, USD Million
- TABLE 72 Rest of North America Captive Portal Market, 2023 - 2030, USD Million
- TABLE 73 Rest of North America Captive Portal Market by Offering, 2019 - 2022, USD Million
- TABLE 74 Rest of North America Captive Portal Market by Offering, 2023 - 2030, USD Million
- TABLE 75 Rest of North America Captive Portal Market by End-use, 2019 - 2022, USD Million
- TABLE 76 Rest of North America Captive Portal Market by End-use, 2023 - 2030, USD Million
- TABLE 77 Europe Captive Portal Market, 2019 - 2022, USD Million
- TABLE 78 Europe Captive Portal Market, 2023 - 2030, USD Million
- TABLE 79 Europe Captive Portal Market by Offering, 2019 - 2022, USD Million
- TABLE 80 Europe Captive Portal Market by Offering, 2023 - 2030, USD Million
- TABLE 81 Europe Platform Market by Country, 2019 - 2022, USD Million
- TABLE 82 Europe Platform Market by Country, 2023 - 2030, USD Million
- TABLE 83 Europe Services Market by Country, 2019 - 2022, USD Million
- TABLE 84 Europe Services Market by Country, 2023 - 2030, USD Million
- TABLE 85 Europe Captive Portal Market by End-use, 2019 - 2022, USD Million
- TABLE 86 Europe Captive Portal Market by End-use, 2023 - 2030, USD Million
- TABLE 87 Europe Hospitality & Leisure Market by Country, 2019 - 2022, USD Million
- TABLE 88 Europe Hospitality & Leisure Market by Country, 2023 - 2030, USD Million
- TABLE 89 Europe Travel & Transportation Market by Country, 2019 - 2022, USD Million
- TABLE 90 Europe Travel & Transportation Market by Country, 2023 - 2030, USD Million
- TABLE 91 Europe Entertainment Market by Country, 2019 - 2022, USD Million
- TABLE 92 Europe Entertainment Market by Country, 2023 - 2030, USD Million
- TABLE 93 Europe Coworking Spaces Market by Country, 2019 - 2022, USD Million
- TABLE 94 Europe Coworking Spaces Market by Country, 2023 - 2030, USD Million
- TABLE 95 Europe ISPs Market by Country, 2019 - 2022, USD Million
- TABLE 96 Europe ISPs Market by Country, 2023 - 2030, USD Million
- TABLE 97 Europe Shopping Malls & Retail Outlets Market by Country, 2019 - 2022, USD Million
- TABLE 98 Europe Shopping Malls & Retail Outlets Market by Country, 2023 - 2030, USD Million
- TABLE 99 Europe Others Market by Country, 2019 - 2022, USD Million
- TABLE 100 Europe Others Market by Country, 2023 - 2030, USD Million
- TABLE 101 Europe Captive Portal Market by Country, 2019 - 2022, USD Million
- TABLE 102 Europe Captive Portal Market by Country, 2023 - 2030, USD Million
- TABLE 103 Germany Captive Portal Market, 2019 - 2022, USD Million
- TABLE 104 Germany Captive Portal Market, 2023 - 2030, USD Million
- TABLE 105 Germany Captive Portal Market by Offering, 2019 - 2022, USD Million
- TABLE 106 Germany Captive Portal Market by Offering, 2023 - 2030, USD Million
- TABLE 107 Germany Captive Portal Market by End-use, 2019 - 2022, USD Million
- TABLE 108 Germany Captive Portal Market by End-use, 2023 - 2030, USD Million
- TABLE 109 UK Captive Portal Market, 2019 - 2022, USD Million
- TABLE 110 UK Captive Portal Market, 2023 - 2030, USD Million
- TABLE 111 UK Captive Portal Market by Offering, 2019 - 2022, USD Million
- TABLE 112 UK Captive Portal Market by Offering, 2023 - 2030, USD Million
- TABLE 113 UK Captive Portal Market by End-use, 2019 - 2022, USD Million
- TABLE 114 UK Captive Portal Market by End-use, 2023 - 2030, USD Million
- TABLE 115 France Captive Portal Market, 2019 - 2022, USD Million
- TABLE 116 France Captive Portal Market, 2023 - 2030, USD Million
- TABLE 117 France Captive Portal Market by Offering, 2019 - 2022, USD Million
- TABLE 118 France Captive Portal Market by Offering, 2023 - 2030, USD Million
- TABLE 119 France Captive Portal Market by End-use, 2019 - 2022, USD Million
- TABLE 120 France Captive Portal Market by End-use, 2023 - 2030, USD Million
- TABLE 121 Russia Captive Portal Market, 2019 - 2022, USD Million
- TABLE 122 Russia Captive Portal Market, 2023 - 2030, USD Million
- TABLE 123 Russia Captive Portal Market by Offering, 2019 - 2022, USD Million
- TABLE 124 Russia Captive Portal Market by Offering, 2023 - 2030, USD Million
- TABLE 125 Russia Captive Portal Market by End-use, 2019 - 2022, USD Million
- TABLE 126 Russia Captive Portal Market by End-use, 2023 - 2030, USD Million
- TABLE 127 Spain Captive Portal Market, 2019 - 2022, USD Million
- TABLE 128 Spain Captive Portal Market, 2023 - 2030, USD Million
- TABLE 129 Spain Captive Portal Market by Offering, 2019 - 2022, USD Million
- TABLE 130 Spain Captive Portal Market by Offering, 2023 - 2030, USD Million
- TABLE 131 Spain Captive Portal Market by End-use, 2019 - 2022, USD Million
- TABLE 132 Spain Captive Portal Market by End-use, 2023 - 2030, USD Million
- TABLE 133 Italy Captive Portal Market, 2019 - 2022, USD Million
- TABLE 134 Italy Captive Portal Market, 2023 - 2030, USD Million
- TABLE 135 Italy Captive Portal Market by Offering, 2019 - 2022, USD Million
- TABLE 136 Italy Captive Portal Market by Offering, 2023 - 2030, USD Million
- TABLE 137 Italy Captive Portal Market by End-use, 2019 - 2022, USD Million
- TABLE 138 Italy Captive Portal Market by End-use, 2023 - 2030, USD Million
- TABLE 139 Rest of Europe Captive Portal Market, 2019 - 2022, USD Million
- TABLE 140 Rest of Europe Captive Portal Market, 2023 - 2030, USD Million
- TABLE 141 Rest of Europe Captive Portal Market by Offering, 2019 - 2022, USD Million
- TABLE 142 Rest of Europe Captive Portal Market by Offering, 2023 - 2030, USD Million
- TABLE 143 Rest of Europe Captive Portal Market by End-use, 2019 - 2022, USD Million
- TABLE 144 Rest of Europe Captive Portal Market by End-use, 2023 - 2030, USD Million
- TABLE 145 Asia Pacific Captive Portal Market, 2019 - 2022, USD Million
- TABLE 146 Asia Pacific Captive Portal Market, 2023 - 2030, USD Million
- TABLE 147 Asia Pacific Captive Portal Market by Offering, 2019 - 2022, USD Million
- TABLE 148 Asia Pacific Captive Portal Market by Offering, 2023 - 2030, USD Million
- TABLE 149 Asia Pacific Platform Market by Country, 2019 - 2022, USD Million
- TABLE 150 Asia Pacific Platform Market by Country, 2023 - 2030, USD Million
- TABLE 151 Asia Pacific Services Market by Country, 2019 - 2022, USD Million
- TABLE 152 Asia Pacific Services Market by Country, 2023 - 2030, USD Million
- TABLE 153 Asia Pacific Captive Portal Market by End-use, 2019 - 2022, USD Million
- TABLE 154 Asia Pacific Captive Portal Market by End-use, 2023 - 2030, USD Million
- TABLE 155 Asia Pacific Hospitality & Leisure Market by Country, 2019 - 2022, USD Million
- TABLE 156 Asia Pacific Hospitality & Leisure Market by Country, 2023 - 2030, USD Million
- TABLE 157 Asia Pacific Travel & Transportation Market by Country, 2019 - 2022, USD Million
- TABLE 158 Asia Pacific Travel & Transportation Market by Country, 2023 - 2030, USD Million
- TABLE 159 Asia Pacific Entertainment Market by Country, 2019 - 2022, USD Million
- TABLE 160 Asia Pacific Entertainment Market by Country, 2023 - 2030, USD Million
- TABLE 161 Asia Pacific Coworking Spaces Market by Country, 2019 - 2022, USD Million
- TABLE 162 Asia Pacific Coworking Spaces Market by Country, 2023 - 2030, USD Million
- TABLE 163 Asia Pacific ISPs Market by Country, 2019 - 2022, USD Million
- TABLE 164 Asia Pacific ISPs Market by Country, 2023 - 2030, USD Million
- TABLE 165 Asia Pacific Shopping Malls & Retail Outlets Market by Country, 2019 - 2022, USD Million
- TABLE 166 Asia Pacific Shopping Malls & Retail Outlets Market by Country, 2023 - 2030, USD Million
- TABLE 167 Asia Pacific Others Market by Country, 2019 - 2022, USD Million
- TABLE 168 Asia Pacific Others Market by Country, 2023 - 2030, USD Million
- TABLE 169 Asia Pacific Captive Portal Market by Country, 2019 - 2022, USD Million
- TABLE 170 Asia Pacific Captive Portal Market by Country, 2023 - 2030, USD Million
- TABLE 171 China Captive Portal Market, 2019 - 2022, USD Million
- TABLE 172 China Captive Portal Market, 2023 - 2030, USD Million
- TABLE 173 China Captive Portal Market by Offering, 2019 - 2022, USD Million
- TABLE 174 China Captive Portal Market by Offering, 2023 - 2030, USD Million
- TABLE 175 China Captive Portal Market by End-use, 2019 - 2022, USD Million
- TABLE 176 China Captive Portal Market by End-use, 2023 - 2030, USD Million
- TABLE 177 Japan Captive Portal Market, 2019 - 2022, USD Million
- TABLE 178 Japan Captive Portal Market, 2023 - 2030, USD Million
- TABLE 179 Japan Captive Portal Market by Offering, 2019 - 2022, USD Million
- TABLE 180 Japan Captive Portal Market by Offering, 2023 - 2030, USD Million
- TABLE 181 Japan Captive Portal Market by End-use, 2019 - 2022, USD Million
- TABLE 182 Japan Captive Portal Market by End-use, 2023 - 2030, USD Million
- TABLE 183 India Captive Portal Market, 2019 - 2022, USD Million
- TABLE 184 India Captive Portal Market, 2023 - 2030, USD Million
- TABLE 185 India Captive Portal Market by Offering, 2019 - 2022, USD Million
- TABLE 186 India Captive Portal Market by Offering, 2023 - 2030, USD Million
- TABLE 187 India Captive Portal Market by End-use, 2019 - 2022, USD Million
- TABLE 188 India Captive Portal Market by End-use, 2023 - 2030, USD Million
- TABLE 189 South Korea Captive Portal Market, 2019 - 2022, USD Million
- TABLE 190 South Korea Captive Portal Market, 2023 - 2030, USD Million
- TABLE 191 South Korea Captive Portal Market by Offering, 2019 - 2022, USD Million
- TABLE 192 South Korea Captive Portal Market by Offering, 2023 - 2030, USD Million
- TABLE 193 South Korea Captive Portal Market by End-use, 2019 - 2022, USD Million
- TABLE 194 South Korea Captive Portal Market by End-use, 2023 - 2030, USD Million
- TABLE 195 Singapore Captive Portal Market, 2019 - 2022, USD Million
- TABLE 196 Singapore Captive Portal Market, 2023 - 2030, USD Million
- TABLE 197 Singapore Captive Portal Market by Offering, 2019 - 2022, USD Million
- TABLE 198 Singapore Captive Portal Market by Offering, 2023 - 2030, USD Million
- TABLE 199 Singapore Captive Portal Market by End-use, 2019 - 2022, USD Million
- TABLE 200 Singapore Captive Portal Market by End-use, 2023 - 2030, USD Million
- TABLE 201 Malaysia Captive Portal Market, 2019 - 2022, USD Million
- TABLE 202 Malaysia Captive Portal Market, 2023 - 2030, USD Million
- TABLE 203 Malaysia Captive Portal Market by Offering, 2019 - 2022, USD Million
- TABLE 204 Malaysia Captive Portal Market by Offering, 2023 - 2030, USD Million
- TABLE 205 Malaysia Captive Portal Market by End-use, 2019 - 2022, USD Million
- TABLE 206 Malaysia Captive Portal Market by End-use, 2023 - 2030, USD Million
- TABLE 207 Rest of Asia Pacific Captive Portal Market, 2019 - 2022, USD Million
- TABLE 208 Rest of Asia Pacific Captive Portal Market, 2023 - 2030, USD Million
- TABLE 209 Rest of Asia Pacific Captive Portal Market by Offering, 2019 - 2022, USD Million
- TABLE 210 Rest of Asia Pacific Captive Portal Market by Offering, 2023 - 2030, USD Million
- TABLE 211 Rest of Asia Pacific Captive Portal Market by End-use, 2019 - 2022, USD Million
- TABLE 212 Rest of Asia Pacific Captive Portal Market by End-use, 2023 - 2030, USD Million
- TABLE 213 LAMEA Captive Portal Market, 2019 - 2022, USD Million
- TABLE 214 LAMEA Captive Portal Market, 2023 - 2030, USD Million
- TABLE 215 LAMEA Captive Portal Market by Offering, 2019 - 2022, USD Million
- TABLE 216 LAMEA Captive Portal Market by Offering, 2023 - 2030, USD Million
- TABLE 217 LAMEA Platform Market by Country, 2019 - 2022, USD Million
- TABLE 218 LAMEA Platform Market by Country, 2023 - 2030, USD Million
- TABLE 219 LAMEA Services Market by Country, 2019 - 2022, USD Million
- TABLE 220 LAMEA Services Market by Country, 2023 - 2030, USD Million
- TABLE 221 LAMEA Captive Portal Market by End-use, 2019 - 2022, USD Million
- TABLE 222 LAMEA Captive Portal Market by End-use, 2023 - 2030, USD Million
- TABLE 223 LAMEA Hospitality & Leisure Market by Country, 2019 - 2022, USD Million
- TABLE 224 LAMEA Hospitality & Leisure Market by Country, 2023 - 2030, USD Million
- TABLE 225 LAMEA Travel & Transportation Market by Country, 2019 - 2022, USD Million
- TABLE 226 LAMEA Travel & Transportation Market by Country, 2023 - 2030, USD Million
- TABLE 227 LAMEA Entertainment Market by Country, 2019 - 2022, USD Million
- TABLE 228 LAMEA Entertainment Market by Country, 2023 - 2030, USD Million
- TABLE 229 LAMEA Coworking Spaces Market by Country, 2019 - 2022, USD Million
- TABLE 230 LAMEA Coworking Spaces Market by Country, 2023 - 2030, USD Million
- TABLE 231 LAMEA ISPs Market by Country, 2019 - 2022, USD Million
- TABLE 232 LAMEA ISPs Market by Country, 2023 - 2030, USD Million
- TABLE 233 LAMEA Shopping Malls & Retail Outlets Market by Country, 2019 - 2022, USD Million
- TABLE 234 LAMEA Shopping Malls & Retail Outlets Market by Country, 2023 - 2030, USD Million
- TABLE 235 LAMEA Others Market by Country, 2019 - 2022, USD Million
- TABLE 236 LAMEA Others Market by Country, 2023 - 2030, USD Million
- TABLE 237 LAMEA Captive Portal Market by Country, 2019 - 2022, USD Million
- TABLE 238 LAMEA Captive Portal Market by Country, 2023 - 2030, USD Million
- TABLE 239 Brazil Captive Portal Market, 2019 - 2022, USD Million
- TABLE 240 Brazil Captive Portal Market, 2023 - 2030, USD Million
- TABLE 241 Brazil Captive Portal Market by Offering, 2019 - 2022, USD Million
- TABLE 242 Brazil Captive Portal Market by Offering, 2023 - 2030, USD Million
- TABLE 243 Brazil Captive Portal Market by End-use, 2019 - 2022, USD Million
- TABLE 244 Brazil Captive Portal Market by End-use, 2023 - 2030, USD Million
- TABLE 245 Argentina Captive Portal Market, 2019 - 2022, USD Million
- TABLE 246 Argentina Captive Portal Market, 2023 - 2030, USD Million
- TABLE 247 Argentina Captive Portal Market by Offering, 2019 - 2022, USD Million
- TABLE 248 Argentina Captive Portal Market by Offering, 2023 - 2030, USD Million
- TABLE 249 Argentina Captive Portal Market by End-use, 2019 - 2022, USD Million
- TABLE 250 Argentina Captive Portal Market by End-use, 2023 - 2030, USD Million
- TABLE 251 UAE Captive Portal Market, 2019 - 2022, USD Million
- TABLE 252 UAE Captive Portal Market, 2023 - 2030, USD Million
- TABLE 253 UAE Captive Portal Market by Offering, 2019 - 2022, USD Million
- TABLE 254 UAE Captive Portal Market by Offering, 2023 - 2030, USD Million
- TABLE 255 UAE Captive Portal Market by End-use, 2019 - 2022, USD Million
- TABLE 256 UAE Captive Portal Market by End-use, 2023 - 2030, USD Million
- TABLE 257 Saudi Arabia Captive Portal Market, 2019 - 2022, USD Million
- TABLE 258 Saudi Arabia Captive Portal Market, 2023 - 2030, USD Million
- TABLE 259 Saudi Arabia Captive Portal Market by Offering, 2019 - 2022, USD Million
- TABLE 260 Saudi Arabia Captive Portal Market by Offering, 2023 - 2030, USD Million
- TABLE 261 Saudi Arabia Captive Portal Market by End-use, 2019 - 2022, USD Million
- TABLE 262 Saudi Arabia Captive Portal Market by End-use, 2023 - 2030, USD Million
- TABLE 263 South Africa Captive Portal Market, 2019 - 2022, USD Million
- TABLE 264 South Africa Captive Portal Market, 2023 - 2030, USD Million
- TABLE 265 South Africa Captive Portal Market by Offering, 2019 - 2022, USD Million
- TABLE 266 South Africa Captive Portal Market by Offering, 2023 - 2030, USD Million
- TABLE 267 South Africa Captive Portal Market by End-use, 2019 - 2022, USD Million
- TABLE 268 South Africa Captive Portal Market by End-use, 2023 - 2030, USD Million
- TABLE 269 Nigeria Captive Portal Market, 2019 - 2022, USD Million
- TABLE 270 Nigeria Captive Portal Market, 2023 - 2030, USD Million
- TABLE 271 Nigeria Captive Portal Market by Offering, 2019 - 2022, USD Million
- TABLE 272 Nigeria Captive Portal Market by Offering, 2023 - 2030, USD Million
- TABLE 273 Nigeria Captive Portal Market by End-use, 2019 - 2022, USD Million
- TABLE 274 Nigeria Captive Portal Market by End-use, 2023 - 2030, USD Million
- TABLE 275 Rest of LAMEA Captive Portal Market, 2019 - 2022, USD Million
- TABLE 276 Rest of LAMEA Captive Portal Market, 2023 - 2030, USD Million
- TABLE 277 Rest of LAMEA Captive Portal Market by Offering, 2019 - 2022, USD Million
- TABLE 278 Rest of LAMEA Captive Portal Market by Offering, 2023 - 2030, USD Million
- TABLE 279 Rest of LAMEA Captive Portal Market by End-use, 2019 - 2022, USD Million
- TABLE 280 Rest of LAMEA Captive Portal Market by End-use, 2023 - 2030, USD Million
- TABLE 281 Key Information - Cisco Systems, Inc.
- TABLE 282 Key Information - Aruba Networks
- TABLE 283 Key Information - Juniper Networks, Inc.
- TABLE 284 Key information - Arista Networks, Inc.
- TABLE 285 Key Information - Extreme Networks, Inc.
- TABLE 286 Key Information - Enea AB
- TABLE 287 Key information - Netgear, Inc.
- TABLE 288 Key Information - WatchGuard Technologies, Inc.
- TABLE 289 Key Information - Boingo Wireless, Inc.
- TABLE 290 Key Information - Grandstream Networks, Inc.
List of Figures
- FIG 1 Methodology for the research
- FIG 2 Global Captive Portal Market, 2019 - 2030, USD Million
- FIG 3 Key Factors Impacting Captive Portal Market
- FIG 4 Market Share Analysis, 2021
- FIG 5 Porter's Five Force Analysis: Captive Portal Market
- FIG 6 Global Captive Portal Market share by Offering, 2022
- FIG 7 Global Captive Portal Market share by Offering, 2030
- FIG 8 Global Captive Portal Market by Offering, 2019 - 2030, USD Million
- FIG 9 Global Captive Portal Market share by End-use, 2022
- FIG 10 Global Captive Portal Market share by End-use, 2030
- FIG 11 Global Captive Portal Market by End-use, 2019 - 2030, USD Million
- FIG 12 Global Captive Portal Market share by Region, 2022
- FIG 13 Global Captive Portal Market share by Region, 2030
- FIG 14 Global Captive Portal Market by Region, 2019 - 2030, USD Million
- FIG 15 SWOT Analysis: Cisco Systems, Inc.
- FIG 16 Recent strategies and developments: Aruba Networks
- FIG 17 SWOT Analysis: Aruba Networks
- FIG 18 SWOT Analysis: Juniper Networks, Inc.
- FIG 19 SWOT Analysis: Arista Networks, Inc.
- FIG 20 SWOT Analysis: EXTREME NETWORKS, INC.
- FIG 21 Recent strategies and developments: Enea AB
- FIG 22 SWOT Analysis: Enea AB
- FIG 23 SWOT Analysis: Netgear, Inc.
- FIG 24 SWOT Analysis: WatchGuard Technologies, Inc.
- FIG 25 Recent strategies and developments: Boingo Wireless, Inc.
- FIG 26 SWOT Analysis: Boingo Wireless, Inc.
- FIG 27 SWOT Analysis: Grandstream Networks, Inc.
The Global Captive Portal Market size is expected to reach $2.3 billion by 2030, rising at a market growth of 13.8% CAGR during the forecast period.
As hotels or restaurants render Wi-Fi access simple, give personalized experiences, make communication easier, collect visitor feedback, provide data insights, and open prospects for monetization, captive portals are widely sought in the hospitality sector. The Hospitality & Leisure segment will capture more than 25% share in the market by 2030. The event's guest WiFi network is immediately made more secure by the presence of a captive portal. Users may be configured to provide a passcode or other personal information on captive portal authentication pages before being granted network access. Wi-Fi networks can be simply maintained by hotel or restaurant personnel due to reliable Wi-Fi solutions and services' consistent, affordable, and centrally managed networking. Some of the factors impacting the market are Increasing marketing activities via the captive portal, Wi-Fi analytics will benefit from a captive portal's increased customer insights, and Ensuring compliance with privacy laws.
Through gathering client information, the presentation of tailored advertising, promotion of special offers, administration of surveys, integration with social media, and the implementation of loyalty programs, captive portals can be a potent instrument for enhancing marketing initiatives. Captive portals let organizations provide users with a branded and immersive experience by utilizing brand colors, logos, and messaging. This delivers a consistent and memorable user experience while supporting brand identity. Moreover, Wi-Fi analytics employ Wi-Fi networks to gather information on gadgets like laptops and smartphones and provide in-depth insight into how the devices behave. Such device behavior data contains details about the Wi-Fi network's coverage area and the activities carried out when connected to the internet via the Wi-Fi network. By obtaining user data during authentication, captive portals present considerable prospects for Wi-Fi analytics. Thus, the market will grow as a result of the benefit of sending users specific messages and the growing acceptance of Wi-Fi analytics in public Wi-Fi and the user-friendliness of its data collection.
However, Security vulnerabilities may be present on captive portals. Users may be tempted to connect with harmful or fraudulent networks that impersonate trustworthy captive portals, putting their data at risk. Additionally, consumers risk data breaches when they enter critical information on an unprotected captive portal. As a result of this configuration, attackers can conduct man-in-the-middle (MITM) attacks, monitoring and maybe changing the data that users and the portal exchange. Users must give their consent promptly, businesses must handle and keep their data securely, and they must provide users with clear and transparent information about the processing of their data. Thus, the market will experience a decline as a result of the privacy concerns considerations.
Offering Outlook
Based on offering, the market is segmented into platform, and services. The services segment recorded a remarkable revenue share in the market in 2022. Services include managed and professional services. Specialized businesses that concentrate on captive portal solutions also offer professional and managed services for captive portals. These services are intended to support companies in successfully setting up, running, and maximizing their captive portal. Professional services are those provided to support enterprises by professionals, specialists, or experts.
End-Use Outlook
By end-use, the market is classified into travel & transportation, hospitality & leisure, shopping malls & retail outlets, entertainment, ISPs, and other end-use. In 2022, the hospitality & leisure segment dominated the market with the maximum revenue share. Due to the captive portal's compelling applications, many hotels, chains, and independent properties have decided to use it to provide guest Wi-Fi connections. During their stay, guests often ask for internet connectivity for pleasure or business needs if they are on the road for work.
Regional Outlook
Region wise, the market is analyzed across North America, Europe, Asia Pacific, and LAMEA. In 2022, the North America region witnessed the largest revenue share in the market. Captive portals contributed to the safe connection and management of IoT devices on Wi-Fi networks as their usage spread across numerous industries in this region. The growth of public spaces like malls, stadiums, airports, and transportation hubs in North America has fueled a rise in demand for these solutions that provide Wi-Fi services to visitors.
The market research report covers the analysis of key stake holders of the market. Key companies profiled in the report include Cisco Systems, Inc., Aruba Networks (Hewlett Packard Enterprise Company), Juniper Networks, Inc., Arista Networks, Inc., Extreme Networks, Inc., Enea AB, Netgear, Inc., WatchGuard Technologies, Inc. (Vector Capital Plc), Boingo Wireless, Inc. (DigitalBridge Group, Inc.) and Grandstream Networks, Inc.
Strategies Deployed in Captive Portal Market
May-2023: Juniper Networks, Inc. made enhancement in the Juniper Mist Access Assurance service, an AI-driven enterprise portfolio. The enhanced service would further influence Mist AI and the latest microservices cloud to deliver a complete suite of network access control and policy management functions through the same adjustable and easy framework already consisting of Juniper's wired access, indoor location, wireless access, SD-WAN, and secure client-to-cloud suite.
Mar-2023: Netgear, Inc. introduced the NETGEAR Nighthawk RS700 Router, the first WiFi 7 router. The launched product poses unparalleled power and delivers up to 19Gbps-alpha blazing-fast WiFi, beyond double the speed of previous generations.
Mar-2023: Boingo Wireless, Inc. joined hands with Shopoff Realty Investments, a real estate investment company. With this collaboration, both companies would build, design and manage extensive DAS and Wi-Fi 6E networks at Dream Las Vegas.
Mar-2023: Arista Networks, Inc. announced the launch of the Arista WAN Routing System. This launch would further integrate three new networking portfolios which include enterprise-class routing platforms, the CloudVision Pathfinder Service, and carrier/cloud-neutral internet transit capabilities, to enhance and simplify customer broad area networks.
Jun-2023: Grandstream Networks, Inc. intoduced GWN7661, an 802.11ax Wi-Fi 6 access point. The launched product would offer an In-Wall Wi-Fi 6 Access Point ideal for hotels, homes, offices, and commercial facilities, etc.
Sep-2022: Grandstream Networks, Inc. unvieled GWN7624, an 802.11ac Wave-2 Wi-Fi access point. The launched product would allow advanced QoS, captive portals, mesh networks, and Wi-Fi speeds up to 2.03Gbps, Wi-Fi access points for hotels, commercial facilities, residential complexes and offices, etc.
Nov-2022: Aruba Networks, a subsidiary of Hewlett Packard Enterprise, collaborated with Lookout, Inc., the endpoint to the cloud security company. This collaboration aims to combine the HPE Aruba EdgeConnect Enterprise SD-WAN platform with Lookout's security service edge platform to deliver customers with a best-of-quality secure access service edge architecture that mixes network security with the combined security stack supporting secure web gateway, zero-trust network access, cloud access security broker and data loss protection.
May-2022: Extreme Networks partnered with Verizon Business for developing best-in-class network and connectivity insight solutions for stadiums and large venues across EMEA. Large venues and stadiums can create immersive, next-generation fan experiences while getting network insights for driving better business and operational decisions through utilizing the combination of Extreme's Wi-Fi and Wi-Fi Analytics solutions and Verizon's private 5G solution.
Jun-2022: Enea AB unveiled the Enea Aptilo Wi-Fi Service Management Platform as a Service (SMP-S). The service is launched to monetize Wi-Fi services for Communication Service Providers.
Dec-2022: Boingo Wireless, Inc. rolled out a property-wide Wi-Fi network at the Armed Forces Recreation Center Edelweiss Lodge and Resort situated in Germany's Bavarian Alps. The launched product would install, create, and manages the Wi-Fi network around the sprawling resort, including rooms, spa, restaurants, meeting spaces, etc.
Apr-2022: Netgear introduced WAX615 to its managed wireless access point offerings. The new product aimed to offer a robust WiFi 6 Release 2 technology-based WiFi solution. The new solution would deliver twice the output in contrast to WiFi 6 Release 1 at a more affordable to its immediate predecessor.
Oct-2020: Enea AB completed the acquisition of Aptilo, a provider of policy and access control solutions for carrier Wi-Fi and IoT. This acquisition aimed to empower Enea AB's data management suite which would further widen their range with new and existing customers and build interesting business opportunities in the area of 5G, SaaS, and Internet of Things.
Jun-2019: Aruba Networks, a subsidiary of Hewlett Packard Enterprise, released a wireless product portfolio completely focused on the requirement of SMB customers which would be aimed at the likes of Cisco's Meraki line and small business Wi-Fi vendors.
Jul-2019: Cisco Systems, Inc. partnered with Google LLC, an American multinational technology company. Under this partnership, both companies would launch free high-speed Wi-Fi zones around India through Google's gStation. Moreover, Cisco Systems, Inc. would enable free, open, high-quality public Wi-Fi to groups across the nation with the gStation platform.
Scope of the Study
Market Segments covered in the Report:
By Offering
- Platform
- Services
By End-Use
- Hospitality & Leisure
- Travel & Transportation
- Entertainment
- Coworking Spaces
- ISPs
- Shopping Malls & Retail Outlets
- Others
By Geography
- North America
- US
- Canada
- Mexico
- Rest of North America
- Europe
- Germany
- UK
- France
- Russia
- Spain
- Italy
- Rest of Europe
- Asia Pacific
- China
- Japan
- India
- South Korea
- Singapore
- Malaysia
- Rest of Asia Pacific
- LAMEA
- Brazil
- Argentina
- UAE
- Saudi Arabia
- South Africa
- Nigeria
- Rest of LAMEA
Companies Profiled
- Cisco Systems, Inc.
- Aruba Networks (Hewlett Packard Enterprise Company)
- Juniper Networks, Inc.
- Arista Networks, Inc.
- Extreme Networks, Inc.
- Enea AB
- Netgear, Inc.
- WatchGuard Technologies, Inc. (Vector Capital Plc)
- Boingo Wireless, Inc. (DigitalBridge Group, Inc.)
- Grandstream Networks, Inc.
Unique Offerings from KBV Research
- Exhaustive coverage
- Highest number of market tables and figures
- Subscription based model available
- Guaranteed best price
- Assured post sales research support with 10% customization free
Table of Contents
Chapter 1. Market Scope & Methodology
- 1.1 Market Definition
- 1.2 Objectives
- 1.3 Market Scope
- 1.4 Segmentation
- 1.4.1 Global Captive Portal Market, by Offering
- 1.4.2 Global Captive Portal Market, by End-Use
- 1.4.3 Global Captive Portal Market, by Geography
- 1.5 Methodology for the research
Chapter 2. Market at a Glance
- 2.1 Key highlights
Chapter 3. Market Overview
- 3.1 Introduction
- 3.1.1 Overview
- 3.1.1.1 Market Composition and Scenario
- 3.1.1 Overview
- 3.2 Key Factors Impacting the Market
- 3.2.1 Market Drivers
- 3.2.2 Market Restraints
Chapter 4. Competition Analysis - Global
- 4.1 Market Share Analysis, 2021
- 4.2 Porter's Five Force Analysis
- 4.3 Strategies Deployed in Captive Portal Market
Chapter 5. Global Captive Portal Market by Offering
- 5.1 Global Platform Market by Region
- 5.2 Global Services Market by Region
Chapter 6. Global Captive Portal Market by End-use
- 6.1 Global Hospitality & Leisure Market by Region
- 6.2 Global Travel & Transportation Market by Region
- 6.3 Global Entertainment Market by Region
- 6.4 Global Coworking Spaces Market by Region
- 6.5 Global ISPs Market by Region
- 6.6 Global Shopping Malls & Retail Outlets Market by Region
- 6.7 Global Others Market by Region
Chapter 7. Global Captive Portal Market by Region
- 7.1 North America Captive Portal Market
- 7.1.1 North America Captive Portal Market by Offering
- 7.1.1.1 North America Platform Market by Country
- 7.1.1.2 North America Services Market by Country
- 7.1.2 North America Captive Portal Market by End-use
- 7.1.2.1 North America Hospitality & Leisure Market by Country
- 7.1.2.2 North America Travel & Transportation Market by Country
- 7.1.2.3 North America Entertainment Market by Country
- 7.1.2.4 North America Coworking Spaces Market by Country
- 7.1.2.5 North America ISPs Market by Country
- 7.1.2.6 North America Shopping Malls & Retail Outlets Market by Country
- 7.1.2.7 North America Others Market by Country
- 7.1.3 North America Captive Portal Market by Country
- 7.1.3.1 US Captive Portal Market
- 7.1.3.1.1 US Captive Portal Market by Offering
- 7.1.3.1.2 US Captive Portal Market by End-use
- 7.1.3.2 Canada Captive Portal Market
- 7.1.3.2.1 Canada Captive Portal Market by Offering
- 7.1.3.2.2 Canada Captive Portal Market by End-use
- 7.1.3.3 Mexico Captive Portal Market
- 7.1.3.3.1 Mexico Captive Portal Market by Offering
- 7.1.3.3.2 Mexico Captive Portal Market by End-use
- 7.1.3.4 Rest of North America Captive Portal Market
- 7.1.3.4.1 Rest of North America Captive Portal Market by Offering
- 7.1.3.4.2 Rest of North America Captive Portal Market by End-use
- 7.1.3.1 US Captive Portal Market
- 7.1.1 North America Captive Portal Market by Offering
- 7.2 Europe Captive Portal Market
- 7.2.1 Europe Captive Portal Market by Offering
- 7.2.1.1 Europe Platform Market by Country
- 7.2.1.2 Europe Services Market by Country
- 7.2.2 Europe Captive Portal Market by End-use
- 7.2.2.1 Europe Hospitality & Leisure Market by Country
- 7.2.2.2 Europe Travel & Transportation Market by Country
- 7.2.2.3 Europe Entertainment Market by Country
- 7.2.2.4 Europe Coworking Spaces Market by Country
- 7.2.2.5 Europe ISPs Market by Country
- 7.2.2.6 Europe Shopping Malls & Retail Outlets Market by Country
- 7.2.2.7 Europe Others Market by Country
- 7.2.3 Europe Captive Portal Market by Country
- 7.2.3.1 Germany Captive Portal Market
- 7.2.3.1.1 Germany Captive Portal Market by Offering
- 7.2.3.1.2 Germany Captive Portal Market by End-use
- 7.2.3.2 UK Captive Portal Market
- 7.2.3.2.1 UK Captive Portal Market by Offering
- 7.2.3.2.2 UK Captive Portal Market by End-use
- 7.2.3.3 France Captive Portal Market
- 7.2.3.3.1 France Captive Portal Market by Offering
- 7.2.3.3.2 France Captive Portal Market by End-use
- 7.2.3.4 Russia Captive Portal Market
- 7.2.3.4.1 Russia Captive Portal Market by Offering
- 7.2.3.4.2 Russia Captive Portal Market by End-use
- 7.2.3.5 Spain Captive Portal Market
- 7.2.3.5.1 Spain Captive Portal Market by Offering
- 7.2.3.5.2 Spain Captive Portal Market by End-use
- 7.2.3.6 Italy Captive Portal Market
- 7.2.3.6.1 Italy Captive Portal Market by Offering
- 7.2.3.6.2 Italy Captive Portal Market by End-use
- 7.2.3.7 Rest of Europe Captive Portal Market
- 7.2.3.7.1 Rest of Europe Captive Portal Market by Offering
- 7.2.3.7.2 Rest of Europe Captive Portal Market by End-use
- 7.2.3.1 Germany Captive Portal Market
- 7.2.1 Europe Captive Portal Market by Offering
- 7.3 Asia Pacific Captive Portal Market
- 7.3.1 Asia Pacific Captive Portal Market by Offering
- 7.3.1.1 Asia Pacific Platform Market by Country
- 7.3.1.2 Asia Pacific Services Market by Country
- 7.3.2 Asia Pacific Captive Portal Market by End-use
- 7.3.2.1 Asia Pacific Hospitality & Leisure Market by Country
- 7.3.2.2 Asia Pacific Travel & Transportation Market by Country
- 7.3.2.3 Asia Pacific Entertainment Market by Country
- 7.3.2.4 Asia Pacific Coworking Spaces Market by Country
- 7.3.2.5 Asia Pacific ISPs Market by Country
- 7.3.2.6 Asia Pacific Shopping Malls & Retail Outlets Market by Country
- 7.3.2.7 Asia Pacific Others Market by Country
- 7.3.3 Asia Pacific Captive Portal Market by Country
- 7.3.3.1 China Captive Portal Market
- 7.3.3.1.1 China Captive Portal Market by Offering
- 7.3.3.1.2 China Captive Portal Market by End-use
- 7.3.3.2 Japan Captive Portal Market
- 7.3.3.2.1 Japan Captive Portal Market by Offering
- 7.3.3.2.2 Japan Captive Portal Market by End-use
- 7.3.3.3 India Captive Portal Market
- 7.3.3.3.1 India Captive Portal Market by Offering
- 7.3.3.3.2 India Captive Portal Market by End-use
- 7.3.3.4 South Korea Captive Portal Market
- 7.3.3.4.1 South Korea Captive Portal Market by Offering
- 7.3.3.4.2 South Korea Captive Portal Market by End-use
- 7.3.3.5 Singapore Captive Portal Market
- 7.3.3.5.1 Singapore Captive Portal Market by Offering
- 7.3.3.5.2 Singapore Captive Portal Market by End-use
- 7.3.3.6 Malaysia Captive Portal Market
- 7.3.3.6.1 Malaysia Captive Portal Market by Offering
- 7.3.3.6.2 Malaysia Captive Portal Market by End-use
- 7.3.3.7 Rest of Asia Pacific Captive Portal Market
- 7.3.3.7.1 Rest of Asia Pacific Captive Portal Market by Offering
- 7.3.3.7.2 Rest of Asia Pacific Captive Portal Market by End-use
- 7.3.3.1 China Captive Portal Market
- 7.3.1 Asia Pacific Captive Portal Market by Offering
- 7.4 LAMEA Captive Portal Market
- 7.4.1 LAMEA Captive Portal Market by Offering
- 7.4.1.1 LAMEA Platform Market by Country
- 7.4.1.2 LAMEA Services Market by Country
- 7.4.2 LAMEA Captive Portal Market by End-use
- 7.4.2.1 LAMEA Hospitality & Leisure Market by Country
- 7.4.2.2 LAMEA Travel & Transportation Market by Country
- 7.4.2.3 LAMEA Entertainment Market by Country
- 7.4.2.4 LAMEA Coworking Spaces Market by Country
- 7.4.2.5 LAMEA ISPs Market by Country
- 7.4.2.6 LAMEA Shopping Malls & Retail Outlets Market by Country
- 7.4.2.7 LAMEA Others Market by Country
- 7.4.3 LAMEA Captive Portal Market by Country
- 7.4.3.1 Brazil Captive Portal Market
- 7.4.3.1.1 Brazil Captive Portal Market by Offering
- 7.4.3.1.2 Brazil Captive Portal Market by End-use
- 7.4.3.2 Argentina Captive Portal Market
- 7.4.3.2.1 Argentina Captive Portal Market by Offering
- 7.4.3.2.2 Argentina Captive Portal Market by End-use
- 7.4.3.3 UAE Captive Portal Market
- 7.4.3.3.1 UAE Captive Portal Market by Offering
- 7.4.3.3.2 UAE Captive Portal Market by End-use
- 7.4.3.4 Saudi Arabia Captive Portal Market
- 7.4.3.4.1 Saudi Arabia Captive Portal Market by Offering
- 7.4.3.4.2 Saudi Arabia Captive Portal Market by End-use
- 7.4.3.5 South Africa Captive Portal Market
- 7.4.3.5.1 South Africa Captive Portal Market by Offering
- 7.4.3.5.2 South Africa Captive Portal Market by End-use
- 7.4.3.6 Nigeria Captive Portal Market
- 7.4.3.6.1 Nigeria Captive Portal Market by Offering
- 7.4.3.6.2 Nigeria Captive Portal Market by End-use
- 7.4.3.7 Rest of LAMEA Captive Portal Market
- 7.4.3.7.1 Rest of LAMEA Captive Portal Market by Offering
- 7.4.3.7.2 Rest of LAMEA Captive Portal Market by End-use
- 7.4.3.1 Brazil Captive Portal Market
- 7.4.1 LAMEA Captive Portal Market by Offering
Chapter 8. Company Profiles
- 8.1 Cisco Systems, Inc.
- 8.1.1 Company Overview
- 8.1.2 Financial Analysis
- 8.1.3 Regional Analysis
- 8.1.4 Research & Development Expense
- 8.1.5 Recent strategies and developments:
- 8.1.5.1 Partnerships, Collaborations, and Agreements:
- 8.1.6 SWOT Analysis
- 8.2 Aruba Networks (Hewlett Packard Enterprise Company)
- 8.2.1 Company Overview
- 8.2.2 Financial Analysis
- 8.2.3 Segmental and Regional Analysis
- 8.2.4 Research & Development Expenses
- 8.2.5 Recent strategies and developments:
- 8.2.5.1 Partnerships, Collaborations & Agreements:
- 8.2.5.1 Product Launches and Product Expansions:
- 8.2.6 SWOT Analysis
- 8.3 Juniper Networks, Inc.
- 8.3.1 Company Overview
- 8.3.2 Financial Analysis
- 8.3.3 Regional Analysis
- 8.3.4 Research & Development Expenses
- 8.3.5 Recent strategies and developments:
- 8.3.5.1 Product Launches and Product Expansions:
- 8.3.6 SWOT Analysis
- 8.4 Arista Networks, Inc.
- 8.4.1 Company Overview
- 8.4.2 Financial Analysis
- 8.4.3 Regional Analysis
- 8.4.4 Research & Development Expense
- 8.4.5 Recent strategies and developments:
- 8.4.5.1 Product Launches and Product Expansions:
- 8.4.6 SWOT Analysis
- 8.5 Extreme Networks, Inc.
- 8.5.1 Company Overview
- 8.5.1 Financial Analysis
- 8.5.2 Regional Analysis
- 8.5.3 Research & Development Expense
- 8.5.4 Recent strategies and developments:
- 8.5.4.1 Partnerships, Collaborations, and Agreements:
- 8.5.5 SWOT Analysis
- 8.6 Enea AB
- 8.6.1 Company Overview
- 8.6.2 Financial Analysis
- 8.6.3 Product Group and Regional Analysis
- 8.6.4 Research & Development Expenses
- 8.6.5 Recent strategies and developments:
- 8.6.5.1 Acquisition and Mergers:
- 8.6.5.2 Product Launches and Product Expansions:
- 8.6.6 SWOT Analysis
- 8.7 Netgear, Inc.
- 8.7.1 Company Overview
- 8.7.2 Financial Analysis
- 8.7.3 Segment and Regional Analysis
- 8.7.4 Research & Development Expenses
- 8.7.5 Recent strategies and developments:
- 8.7.5.1 Product Launches and Product Expansions:
- 8.7.6 SWOT Analysis
- 8.8 WatchGuard Technologies, Inc. (Vector Capital Plc)
- 8.8.1 Company Overview
- 8.8.2 Financial Analysis
- 8.8.3 SWOT Analysis
- 8.9 Boingo Wireless, Inc. (DigitalBridge Group, Inc.)
- 8.9.1 Company Overview
- 8.9.2 Financial Analysis
- 8.9.3 Segment Analysis
- 8.9.4 Recent strategies and developments:
- 8.9.4.1 Partnerships, Collaborations, and Agreements:
- 8.9.4.2 Product Launches and Product Expansions:
- 8.9.5 SWOT Analysis
- 8.10. Grandstream Networks, Inc.
- 8.10.1 Company Overview
- 8.10.2 Recent strategies and developments:
- 8.10.2.1 Product Launches and Product Expansions:
- 8.10.3 SWOT Analysis