|
|
市場調査レポート
商品コード
1292484
カーボンフットプリント管理の世界市場規模、シェア、産業動向分析レポート配備別、組織規模別、コンポーネント別(ソリューションとサービス)、業種別、地域別展望と予測、2023~2029年Global Carbon Footprint Management Market Size, Share & Industry Trends Analysis Report By Deployment, By Organization Size, By Component (Solution and Services), By Vertical, By Regional Outlook and Forecast, 2023 - 2029 |
||||||
|
|
|||||||


| カーボンフットプリント管理の世界市場規模、シェア、産業動向分析レポート配備別、組織規模別、コンポーネント別(ソリューションとサービス)、業種別、地域別展望と予測、2023~2029年 |
|
出版日: 2023年05月31日
発行: KBV Research
ページ情報: 英文 277 Pages
納期: 即納可能
|
- 全表示
- 概要
- 図表
- 目次
カーボンフットプリント管理の市場規模は、2029年までに337億米ドルに達すると予測され、予測期間中のCAGRは21.0%の市場成長率で上昇すると予想されています。
カーディナルマトリックスに記載された分析によると、Schneider Electric SEが本市場における先駆者です。2022年4月、シュナイダーの子会社であるAVEVAは、鉱業にデジタルサービスやソリューションを提供するためにFLSmidthと提携しました。さらに、両社は、各レベルでより良い資産パフォーマンスを実現するために、世界をリードするプロセスとエネルギー技術を組み合わせることで、高度に持続可能な事業への転換を後押しします。SAP SE、Salesforce, Inc.、IBM Corporationなどの企業は、本市場における主要なイノベーターです。
市場の成長要因
低炭素化政策を実施するための政府の取り組みが活発化
政府のプログラムでは、カーボンフットプリント管理ツールを使用して、住宅や企業で発生する排出物を追跡、監視、削減することを支援しています。気候変動を懸念する多くの政府や利害関係者は、環境中の温室効果ガスや排出量を削減するための政策を常に策定し、変更を加えています。国連環境計画(UNEP)によると、120カ国以上が2030年までに排出量を削減するための新しいNDC目標を設定しています。世界のCO2排出量の約70%を占める各国政府は、2050年までにネットゼロエミッションを達成することを宣言しています。このように、政府による排出量削減への取り組みが、市場の成長を後押ししています。
クラウドコンピューティングの利用拡大、ペーパーレス化の推進
世界の経済は、ペーパーレス経済とクラウドコンピューティングを大規模に導入しています。これらの戦略や環境に配慮したプラットフォームを採用し、GHGやその他の炭素ガスの排出を止めるために、各国はさまざまな補助金を提供しています。工場などの産業現場では、ろ過キャップだけでなく、機器を使用することも、二酸化炭素排出量を減らすために、その導入には必要かもしれません。カーボンフットプリント管理アプリケーションは、これらのソリューションを使用する前に、クラウドまたはオンプレミスの展開を通じて、排出レベルの確認やデータの文書化に使用され、ソフトウェア全体の売上を促進します。その結果、ペーパーレス化のためのクラウドコンピューティングの導入と利用によって、市場はまもなく活性化すると考えられます。
市場の抑制要因
高い初期支出
このビジネスは、最先端の技術を使って自動車の環境負荷を低減するグリーンテクノロジーを生み出し、気候変動に対抗するためのカーボンオフセットを行ってきました。しかし、小規模な企業による低炭素排出インフラの導入は課題として阻まれています。また、低炭素インフラに資金を投入するメリットについての知識不足も、需要を鈍らせています。環境への害が少なく、温室効果ガスの発生が少ない、より近代的なインフラへのアップグレードに伴う高いコストが、市場の拡大を制限しています。
コンポーネントの展望
コンポーネントに基づき、市場はソリューションとサービスに分類されます。2022年の市場では、ソリューションセグメントが最も高い収益シェアを獲得しました。設置の容易さ、応答性の向上、大企業や中小企業における正確なデータ追跡が、この分野の急拡大の原動力となっています。サプライチェーンの活性化も、カーボンフットプリント管理技術の採用を後押しする要素です。消費者の環境意識はますます高まり、持続可能性への取り組みを示す企業を支持する傾向が強くなっています。
展開の見通し
導入形態によって、市場はクラウドとオンプレミスに分類されます。2022年の市場では、クラウドセグメントが最大の収益シェアを占めています。クラウド上でカーボンフットプリント管理プログラムを実行、維持、アップグレードすることは、より安価で、より拡張性が高く、容易です。さらに、セキュリティ、データ管理、スピード、24時間サポートなどの利点があり、クライアントにとって最良の選択肢となります。クラウド展開では、アプリケーションのカスタマイズや構成が容易に行えるため、組織はアプリケーションを特定のニーズや要件に合わせて調整することが可能です。
組織規模の展望
組織規模別に見ると、市場は企業/エンタープライズ、中堅企業、小規模企業に分けられます。2022年の市場では、小規模企業セグメントがかなりの収益シェアを獲得しました。小規模企業は、排出量の規模が小さいため、一般的に、政府または利害関係者からの排出量/ESG報告書に対する要求に直面することはありませんでした。しかし、予測期間中、このセグメントは、世界のいくつかの先進国での拘束力のある法律の差し迫った制定や、排出量開示に対する投資家の圧力の高まりにより、急速に増加すると予測されます。
アプリケーションの展望
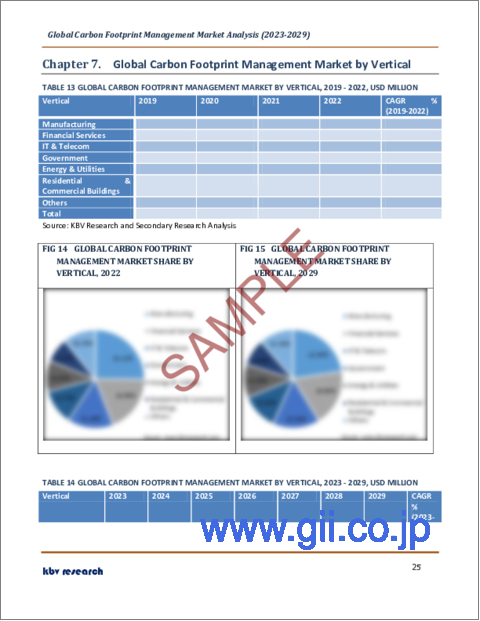
市場は用途別に、製造業、エネルギー・公益事業、住宅・商業ビル、輸送・物流、IT・通信、金融サービス、政府、その他に分類されます。製造業セグメントは、2022年の市場において最大の収益シェアを記録しました。炭素排出の世界の主要生産者の1つは製造業です。一部の製造業は炭素排出の現実と折り合いをつけていますが、他の多くの製造業は製造時に炭素排出を削減する方法を探し続けています。
地域別展望
地域別では、北米、欧州、アジア太平洋、LAMEAの4地域で分析しています。2022年の市場では、北米セグメントが最も高い収益シェアを獲得しています。気候変動の影響を緩和するための同地域の積極的な取り組みにより、北米は市場が拡大しています。その結果、この地域の国々は、厳格な国別貢献(NDC)目標や強制力のある環境・社会・ガバナンス(ESG)法を制定しています。その結果、今後数年間は、需要が大幅に増加すると予想されます。
目次
第1章 市場範囲と調査手法
- 市場の定義
- 目的
- 市場範囲
- セグメンテーション
- 調査手法
第2章 市場概要
- イントロダクション
- 概要
- 市場構成とシナリオ
- 概要
- 市場に影響を与える主な要因
- 市場促進要因
- 市場抑制要因
第3章 競合分析- 世界
- KBVカーディナルマトリックス
- 最近の業界全体の戦略的展開
- パートナーシップ、コラボレーション、および契約
- 製品の発売と製品の拡大
- 買収と合併
- 事業拡大
- 市場シェア分析2021
- 主要成功戦略
- 主な戦略
第4章 世界の二酸化炭素排出量管理市場:展開別
- 世界のクラウド市場:地域別
- 世界のオンプレミス市場:地域別
第5章 世界の二酸化炭素排出量管理市場:組織規模別
- 世界の企業/企業市場:地域別
- 世界の中堅企業市場:地域別
- 世界の中小企業市場:地域別
第6章 世界の二酸化炭素排出量管理市場:コンポーネント別
- 世界のソリューション市場:地域別
- 世界サービス市場:地域別
第7章 世界の二酸化炭素排出量管理市場:業界別
- 世界の製造業市場:地域別
- 世界の金融サービス市場:地域別
- 世界のITおよびテレコム市場:地域別
- 世界の政府市場:地域別
- 世界のエネルギーおよび公益事業市場:地域別
- 世界の住宅および商業ビル市場:地域別
- 世界のその他の市場:地域別
第8章 世界の二酸化炭素排出量管理市場:地域別
- 北米
- 北米の市場:国別
- 米国
- カナダ
- メキシコ
- その他北米地域
- 北米の市場:国別
- 欧州
- 欧州の市場:国別
- ドイツ
- 英国
- フランス
- ロシア
- スペイン
- イタリア
- その他欧州地域
- 欧州の市場:国別
- アジア太平洋
- アジア太平洋の市場:国別
- 中国
- 日本
- インド
- 韓国
- シンガポール
- マレーシア
- その他アジア太平洋地域
- アジア太平洋の市場:国別
- ラテンアメリカ・中東・アフリカ
- ラテンアメリカ・中東・アフリカの市場:国別
- ブラジル
- アルゼンチン
- アラブ首長国連邦
- サウジアラビア
- 南アフリカ
- ナイジェリア
- その他ラテンアメリカ・中東・アフリカ地域
- ラテンアメリカ・中東・アフリカの市場:国別
第9章 企業プロファイル
- Schneider Electric SE
- SAP SE
- Salesforce, Inc
- IBM Corporation
- ENGIE
- Intelex Technologies, ULC(Industrial Scientific Corporation)
- IsoMetrix
- Cority Software, Inc(Thoma Bravo)
- Dakota Software Corporation
- Locus Technologies
LIST OF TABLES
- TABLE 1 Global Carbon Footprint Management Market, 2019 - 2022, USD Million
- TABLE 2 Global Carbon Footprint Management Market, 2023 - 2029, USD Million
- TABLE 3 Partnerships, Collaborations and Agreements- Carbon Footprint Management Market
- TABLE 4 Product Launches And Product Expansions- Carbon Footprint Management Market
- TABLE 5 Acquisition and Mergers- Carbon Footprint Management Market
- TABLE 6 Business Expansion- Carbon Footprint Management Market
- TABLE 7 Global Carbon Footprint Management Market by Deployment, 2019 - 2022, USD Million
- TABLE 8 Global Carbon Footprint Management Market by Deployment, 2023 - 2029, USD Million
- TABLE 9 Global Cloud Market by Region, 2019 - 2022, USD Million
- TABLE 10 Global Cloud Market by Region, 2023 - 2029, USD Million
- TABLE 11 Global On-premise Market by Region, 2019 - 2022, USD Million
- TABLE 12 Global On-premise Market by Region, 2023 - 2029, USD Million
- TABLE 13 Global Carbon Footprint Management Market by Organization Size, 2019 - 2022, USD Million
- TABLE 14 Global Carbon Footprint Management Market by Organization Size, 2023 - 2029, USD Million
- TABLE 15 Global Corporates/Enterprises Market by Region, 2019 - 2022, USD Million
- TABLE 16 Global Corporates/Enterprises Market by Region, 2023 - 2029, USD Million
- TABLE 17 Global Mid-Tier Enterprises Market by Region, 2019 - 2022, USD Million
- TABLE 18 Global Mid-Tier Enterprises Market by Region, 2023 - 2029, USD Million
- TABLE 19 Global Small Businesses Market by Region, 2019 - 2022, USD Million
- TABLE 20 Global Small Businesses Market by Region, 2023 - 2029, USD Million
- TABLE 21 Global Carbon Footprint Management Market by Component, 2019 - 2022, USD Million
- TABLE 22 Global Carbon Footprint Management Market by Component, 2023 - 2029, USD Million
- TABLE 23 Global Solution Market by Region, 2019 - 2022, USD Million
- TABLE 24 Global Solution Market by Region, 2023 - 2029, USD Million
- TABLE 25 Global Services Market by Region, 2019 - 2022, USD Million
- TABLE 26 Global Services Market by Region, 2023 - 2029, USD Million
- TABLE 27 Global Carbon Footprint Management Market by Vertical, 2019 - 2022, USD Million
- TABLE 28 Global Carbon Footprint Management Market by Vertical, 2023 - 2029, USD Million
- TABLE 29 Global Manufacturing Market by Region, 2019 - 2022, USD Million
- TABLE 30 Global Manufacturing Market by Region, 2023 - 2029, USD Million
- TABLE 31 Global Financial Services Market by Region, 2019 - 2022, USD Million
- TABLE 32 Global Financial Services Market by Region, 2023 - 2029, USD Million
- TABLE 33 Global IT & Telecom Market by Region, 2019 - 2022, USD Million
- TABLE 34 Global IT & Telecom Market by Region, 2023 - 2029, USD Million
- TABLE 35 Global Government Market by Region, 2019 - 2022, USD Million
- TABLE 36 Global Government Market by Region, 2023 - 2029, USD Million
- TABLE 37 Global Energy & Utilities Market by Region, 2019 - 2022, USD Million
- TABLE 38 Global Energy & Utilities Market by Region, 2023 - 2029, USD Million
- TABLE 39 Global Residential & Commercial Buildings Market by Region, 2019 - 2022, USD Million
- TABLE 40 Global Residential & Commercial Buildings Market by Region, 2023 - 2029, USD Million
- TABLE 41 Global Others Market by Region, 2019 - 2022, USD Million
- TABLE 42 Global Others Market by Region, 2023 - 2029, USD Million
- TABLE 43 Global Carbon Footprint Management Market by Region, 2019 - 2022, USD Million
- TABLE 44 Global Carbon Footprint Management Market by Region, 2023 - 2029, USD Million
- TABLE 45 North America Carbon Footprint Management Market, 2019 - 2022, USD Million
- TABLE 46 North America Carbon Footprint Management Market, 2023 - 2029, USD Million
- TABLE 47 North America Carbon Footprint Management Market by Deployment, 2019 - 2022, USD Million
- TABLE 48 North America Carbon Footprint Management Market by Deployment, 2023 - 2029, USD Million
- TABLE 49 North America Cloud Market by Country, 2019 - 2022, USD Million
- TABLE 50 North America Cloud Market by Country, 2023 - 2029, USD Million
- TABLE 51 North America On-premise Market by Country, 2019 - 2022, USD Million
- TABLE 52 North America On-premise Market by Country, 2023 - 2029, USD Million
- TABLE 53 North America Carbon Footprint Management Market by Organization Size, 2019 - 2022, USD Million
- TABLE 54 North America Carbon Footprint Management Market by Organization Size, 2023 - 2029, USD Million
- TABLE 55 North America Corporates/Enterprises Market by Country, 2019 - 2022, USD Million
- TABLE 56 North America Corporates/Enterprises Market by Country, 2023 - 2029, USD Million
- TABLE 57 North America Mid-Tier Enterprises Market by Country, 2019 - 2022, USD Million
- TABLE 58 North America Mid-Tier Enterprises Market by Country, 2023 - 2029, USD Million
- TABLE 59 North America Small Businesses Market by Country, 2019 - 2022, USD Million
- TABLE 60 North America Small Businesses Market by Country, 2023 - 2029, USD Million
- TABLE 61 North America Carbon Footprint Management Market by Component, 2019 - 2022, USD Million
- TABLE 62 North America Carbon Footprint Management Market by Component, 2023 - 2029, USD Million
- TABLE 63 North America Solution Market by Country, 2019 - 2022, USD Million
- TABLE 64 North America Solution Market by Country, 2023 - 2029, USD Million
- TABLE 65 North America Services Market by Country, 2019 - 2022, USD Million
- TABLE 66 North America Services Market by Country, 2023 - 2029, USD Million
- TABLE 67 North America Carbon Footprint Management Market by Vertical, 2019 - 2022, USD Million
- TABLE 68 North America Carbon Footprint Management Market by Vertical, 2023 - 2029, USD Million
- TABLE 69 North America Manufacturing Market by Country, 2019 - 2022, USD Million
- TABLE 70 North America Manufacturing Market by Country, 2023 - 2029, USD Million
- TABLE 71 North America Financial Services Market by Country, 2019 - 2022, USD Million
- TABLE 72 North America Financial Services Market by Country, 2023 - 2029, USD Million
- TABLE 73 North America IT & Telecom Market by Country, 2019 - 2022, USD Million
- TABLE 74 North America IT & Telecom Market by Country, 2023 - 2029, USD Million
- TABLE 75 North America Government Market by Country, 2019 - 2022, USD Million
- TABLE 76 North America Government Market by Country, 2023 - 2029, USD Million
- TABLE 77 North America Energy & Utilities Market by Country, 2019 - 2022, USD Million
- TABLE 78 North America Energy & Utilities Market by Country, 2023 - 2029, USD Million
- TABLE 79 North America Residential & Commercial Buildings Market by Country, 2019 - 2022, USD Million
- TABLE 80 North America Residential & Commercial Buildings Market by Country, 2023 - 2029, USD Million
- TABLE 81 North America Others Market by Country, 2019 - 2022, USD Million
- TABLE 82 North America Others Market by Country, 2023 - 2029, USD Million
- TABLE 83 North America Carbon Footprint Management Market by Country, 2019 - 2022, USD Million
- TABLE 84 North America Carbon Footprint Management Market by Country, 2023 - 2029, USD Million
- TABLE 85 US Carbon Footprint Management Market, 2019 - 2022, USD Million
- TABLE 86 US Carbon Footprint Management Market, 2023 - 2029, USD Million
- TABLE 87 US Carbon Footprint Management Market by Deployment, 2019 - 2022, USD Million
- TABLE 88 US Carbon Footprint Management Market by Deployment, 2023 - 2029, USD Million
- TABLE 89 US Carbon Footprint Management Market by Organization Size, 2019 - 2022, USD Million
- TABLE 90 US Carbon Footprint Management Market by Organization Size, 2023 - 2029, USD Million
- TABLE 91 US Carbon Footprint Management Market by Component, 2019 - 2022, USD Million
- TABLE 92 US Carbon Footprint Management Market by Component, 2023 - 2029, USD Million
- TABLE 93 US Carbon Footprint Management Market by Vertical, 2019 - 2022, USD Million
- TABLE 94 US Carbon Footprint Management Market by Vertical, 2023 - 2029, USD Million
- TABLE 95 Canada Carbon Footprint Management Market, 2019 - 2022, USD Million
- TABLE 96 Canada Carbon Footprint Management Market, 2023 - 2029, USD Million
- TABLE 97 Canada Carbon Footprint Management Market by Deployment, 2019 - 2022, USD Million
- TABLE 98 Canada Carbon Footprint Management Market by Deployment, 2023 - 2029, USD Million
- TABLE 99 Canada Carbon Footprint Management Market by Organization Size, 2019 - 2022, USD Million
- TABLE 100 Canada Carbon Footprint Management Market by Organization Size, 2023 - 2029, USD Million
- TABLE 101 Canada Carbon Footprint Management Market by Component, 2019 - 2022, USD Million
- TABLE 102 Canada Carbon Footprint Management Market by Component, 2023 - 2029, USD Million
- TABLE 103 Canada Carbon Footprint Management Market by Vertical, 2019 - 2022, USD Million
- TABLE 104 Canada Carbon Footprint Management Market by Vertical, 2023 - 2029, USD Million
- TABLE 105 Mexico Carbon Footprint Management Market, 2019 - 2022, USD Million
- TABLE 106 Mexico Carbon Footprint Management Market, 2023 - 2029, USD Million
- TABLE 107 Mexico Carbon Footprint Management Market by Deployment, 2019 - 2022, USD Million
- TABLE 108 Mexico Carbon Footprint Management Market by Deployment, 2023 - 2029, USD Million
- TABLE 109 Mexico Carbon Footprint Management Market by Organization Size, 2019 - 2022, USD Million
- TABLE 110 Mexico Carbon Footprint Management Market by Organization Size, 2023 - 2029, USD Million
- TABLE 111 Mexico Carbon Footprint Management Market by Component, 2019 - 2022, USD Million
- TABLE 112 Mexico Carbon Footprint Management Market by Component, 2023 - 2029, USD Million
- TABLE 113 Mexico Carbon Footprint Management Market by Vertical, 2019 - 2022, USD Million
- TABLE 114 Mexico Carbon Footprint Management Market by Vertical, 2023 - 2029, USD Million
- TABLE 115 Rest of North America Carbon Footprint Management Market, 2019 - 2022, USD Million
- TABLE 116 Rest of North America Carbon Footprint Management Market, 2023 - 2029, USD Million
- TABLE 117 Rest of North America Carbon Footprint Management Market by Deployment, 2019 - 2022, USD Million
- TABLE 118 Rest of North America Carbon Footprint Management Market by Deployment, 2023 - 2029, USD Million
- TABLE 119 Rest of North America Carbon Footprint Management Market by Organization Size, 2019 - 2022, USD Million
- TABLE 120 Rest of North America Carbon Footprint Management Market by Organization Size, 2023 - 2029, USD Million
- TABLE 121 Rest of North America Carbon Footprint Management Market by Component, 2019 - 2022, USD Million
- TABLE 122 Rest of North America Carbon Footprint Management Market by Component, 2023 - 2029, USD Million
- TABLE 123 Rest of North America Carbon Footprint Management Market by Vertical, 2019 - 2022, USD Million
- TABLE 124 Rest of North America Carbon Footprint Management Market by Vertical, 2023 - 2029, USD Million
- TABLE 125 Europe Carbon Footprint Management Market, 2019 - 2022, USD Million
- TABLE 126 Europe Carbon Footprint Management Market, 2023 - 2029, USD Million
- TABLE 127 Europe Carbon Footprint Management Market by Deployment, 2019 - 2022, USD Million
- TABLE 128 Europe Carbon Footprint Management Market by Deployment, 2023 - 2029, USD Million
- TABLE 129 Europe Cloud Market by Country, 2019 - 2022, USD Million
- TABLE 130 Europe Cloud Market by Country, 2023 - 2029, USD Million
- TABLE 131 Europe On-premise Market by Country, 2019 - 2022, USD Million
- TABLE 132 Europe On-premise Market by Country, 2023 - 2029, USD Million
- TABLE 133 Europe Carbon Footprint Management Market by Organization Size, 2019 - 2022, USD Million
- TABLE 134 Europe Carbon Footprint Management Market by Organization Size, 2023 - 2029, USD Million
- TABLE 135 Europe Corporates/Enterprises Market by Country, 2019 - 2022, USD Million
- TABLE 136 Europe Corporates/Enterprises Market by Country, 2023 - 2029, USD Million
- TABLE 137 Europe Mid-Tier Enterprises Market by Country, 2019 - 2022, USD Million
- TABLE 138 Europe Mid-Tier Enterprises Market by Country, 2023 - 2029, USD Million
- TABLE 139 Europe Small Businesses Market by Country, 2019 - 2022, USD Million
- TABLE 140 Europe Small Businesses Market by Country, 2023 - 2029, USD Million
- TABLE 141 Europe Carbon Footprint Management Market by Component, 2019 - 2022, USD Million
- TABLE 142 Europe Carbon Footprint Management Market by Component, 2023 - 2029, USD Million
- TABLE 143 Europe Solution Market by Country, 2019 - 2022, USD Million
- TABLE 144 Europe Solution Market by Country, 2023 - 2029, USD Million
- TABLE 145 Europe Services Market by Country, 2019 - 2022, USD Million
- TABLE 146 Europe Services Market by Country, 2023 - 2029, USD Million
- TABLE 147 Europe Carbon Footprint Management Market by Vertical, 2019 - 2022, USD Million
- TABLE 148 Europe Carbon Footprint Management Market by Vertical, 2023 - 2029, USD Million
- TABLE 149 Europe Manufacturing Market by Country, 2019 - 2022, USD Million
- TABLE 150 Europe Manufacturing Market by Country, 2023 - 2029, USD Million
- TABLE 151 Europe Financial Services Market by Country, 2019 - 2022, USD Million
- TABLE 152 Europe Financial Services Market by Country, 2023 - 2029, USD Million
- TABLE 153 Europe IT & Telecom Market by Country, 2019 - 2022, USD Million
- TABLE 154 Europe IT & Telecom Market by Country, 2023 - 2029, USD Million
- TABLE 155 Europe Government Market by Country, 2019 - 2022, USD Million
- TABLE 156 Europe Government Market by Country, 2023 - 2029, USD Million
- TABLE 157 Europe Energy & Utilities Market by Country, 2019 - 2022, USD Million
- TABLE 158 Europe Energy & Utilities Market by Country, 2023 - 2029, USD Million
- TABLE 159 Europe Residential & Commercial Buildings Market by Country, 2019 - 2022, USD Million
- TABLE 160 Europe Residential & Commercial Buildings Market by Country, 2023 - 2029, USD Million
- TABLE 161 Europe Others Market by Country, 2019 - 2022, USD Million
- TABLE 162 Europe Others Market by Country, 2023 - 2029, USD Million
- TABLE 163 Europe Carbon Footprint Management Market by Country, 2019 - 2022, USD Million
- TABLE 164 Europe Carbon Footprint Management Market by Country, 2023 - 2029, USD Million
- TABLE 165 Germany Carbon Footprint Management Market, 2019 - 2022, USD Million
- TABLE 166 Germany Carbon Footprint Management Market, 2023 - 2029, USD Million
- TABLE 167 Germany Carbon Footprint Management Market by Deployment, 2019 - 2022, USD Million
- TABLE 168 Germany Carbon Footprint Management Market by Deployment, 2023 - 2029, USD Million
- TABLE 169 Germany Carbon Footprint Management Market by Organization Size, 2019 - 2022, USD Million
- TABLE 170 Germany Carbon Footprint Management Market by Organization Size, 2023 - 2029, USD Million
- TABLE 171 Germany Carbon Footprint Management Market by Component, 2019 - 2022, USD Million
- TABLE 172 Germany Carbon Footprint Management Market by Component, 2023 - 2029, USD Million
- TABLE 173 Germany Carbon Footprint Management Market by Vertical, 2019 - 2022, USD Million
- TABLE 174 Germany Carbon Footprint Management Market by Vertical, 2023 - 2029, USD Million
- TABLE 175 UK Carbon Footprint Management Market, 2019 - 2022, USD Million
- TABLE 176 UK Carbon Footprint Management Market, 2023 - 2029, USD Million
- TABLE 177 UK Carbon Footprint Management Market by Deployment, 2019 - 2022, USD Million
- TABLE 178 UK Carbon Footprint Management Market by Deployment, 2023 - 2029, USD Million
- TABLE 179 UK Carbon Footprint Management Market by Organization Size, 2019 - 2022, USD Million
- TABLE 180 UK Carbon Footprint Management Market by Organization Size, 2023 - 2029, USD Million
- TABLE 181 UK Carbon Footprint Management Market by Component, 2019 - 2022, USD Million
- TABLE 182 UK Carbon Footprint Management Market by Component, 2023 - 2029, USD Million
- TABLE 183 UK Carbon Footprint Management Market by Vertical, 2019 - 2022, USD Million
- TABLE 184 UK Carbon Footprint Management Market by Vertical, 2023 - 2029, USD Million
- TABLE 185 France Carbon Footprint Management Market, 2019 - 2022, USD Million
- TABLE 186 France Carbon Footprint Management Market, 2023 - 2029, USD Million
- TABLE 187 France Carbon Footprint Management Market by Deployment, 2019 - 2022, USD Million
- TABLE 188 France Carbon Footprint Management Market by Deployment, 2023 - 2029, USD Million
- TABLE 189 France Carbon Footprint Management Market by Organization Size, 2019 - 2022, USD Million
- TABLE 190 France Carbon Footprint Management Market by Organization Size, 2023 - 2029, USD Million
- TABLE 191 France Carbon Footprint Management Market by Component, 2019 - 2022, USD Million
- TABLE 192 France Carbon Footprint Management Market by Component, 2023 - 2029, USD Million
- TABLE 193 France Carbon Footprint Management Market by Vertical, 2019 - 2022, USD Million
- TABLE 194 France Carbon Footprint Management Market by Vertical, 2023 - 2029, USD Million
- TABLE 195 Russia Carbon Footprint Management Market, 2019 - 2022, USD Million
- TABLE 196 Russia Carbon Footprint Management Market, 2023 - 2029, USD Million
- TABLE 197 Russia Carbon Footprint Management Market by Deployment, 2019 - 2022, USD Million
- TABLE 198 Russia Carbon Footprint Management Market by Deployment, 2023 - 2029, USD Million
- TABLE 199 Russia Carbon Footprint Management Market by Organization Size, 2019 - 2022, USD Million
- TABLE 200 Russia Carbon Footprint Management Market by Organization Size, 2023 - 2029, USD Million
- TABLE 201 Russia Carbon Footprint Management Market by Component, 2019 - 2022, USD Million
- TABLE 202 Russia Carbon Footprint Management Market by Component, 2023 - 2029, USD Million
- TABLE 203 Russia Carbon Footprint Management Market by Vertical, 2019 - 2022, USD Million
- TABLE 204 Russia Carbon Footprint Management Market by Vertical, 2023 - 2029, USD Million
- TABLE 205 Spain Carbon Footprint Management Market, 2019 - 2022, USD Million
- TABLE 206 Spain Carbon Footprint Management Market, 2023 - 2029, USD Million
- TABLE 207 Spain Carbon Footprint Management Market by Deployment, 2019 - 2022, USD Million
- TABLE 208 Spain Carbon Footprint Management Market by Deployment, 2023 - 2029, USD Million
- TABLE 209 Spain Carbon Footprint Management Market by Organization Size, 2019 - 2022, USD Million
- TABLE 210 Spain Carbon Footprint Management Market by Organization Size, 2023 - 2029, USD Million
- TABLE 211 Spain Carbon Footprint Management Market by Component, 2019 - 2022, USD Million
- TABLE 212 Spain Carbon Footprint Management Market by Component, 2023 - 2029, USD Million
- TABLE 213 Spain Carbon Footprint Management Market by Vertical, 2019 - 2022, USD Million
- TABLE 214 Spain Carbon Footprint Management Market by Vertical, 2023 - 2029, USD Million
- TABLE 215 Italy Carbon Footprint Management Market, 2019 - 2022, USD Million
- TABLE 216 Italy Carbon Footprint Management Market, 2023 - 2029, USD Million
- TABLE 217 Italy Carbon Footprint Management Market by Deployment, 2019 - 2022, USD Million
- TABLE 218 Italy Carbon Footprint Management Market by Deployment, 2023 - 2029, USD Million
- TABLE 219 Italy Carbon Footprint Management Market by Organization Size, 2019 - 2022, USD Million
- TABLE 220 Italy Carbon Footprint Management Market by Organization Size, 2023 - 2029, USD Million
- TABLE 221 Italy Carbon Footprint Management Market by Component, 2019 - 2022, USD Million
- TABLE 222 Italy Carbon Footprint Management Market by Component, 2023 - 2029, USD Million
- TABLE 223 Italy Carbon Footprint Management Market by Vertical, 2019 - 2022, USD Million
- TABLE 224 Italy Carbon Footprint Management Market by Vertical, 2023 - 2029, USD Million
- TABLE 225 Rest of Europe Carbon Footprint Management Market, 2019 - 2022, USD Million
- TABLE 226 Rest of Europe Carbon Footprint Management Market, 2023 - 2029, USD Million
- TABLE 227 Rest of Europe Carbon Footprint Management Market by Deployment, 2019 - 2022, USD Million
- TABLE 228 Rest of Europe Carbon Footprint Management Market by Deployment, 2023 - 2029, USD Million
- TABLE 229 Rest of Europe Carbon Footprint Management Market by Organization Size, 2019 - 2022, USD Million
- TABLE 230 Rest of Europe Carbon Footprint Management Market by Organization Size, 2023 - 2029, USD Million
- TABLE 231 Rest of Europe Carbon Footprint Management Market by Component, 2019 - 2022, USD Million
- TABLE 232 Rest of Europe Carbon Footprint Management Market by Component, 2023 - 2029, USD Million
- TABLE 233 Rest of Europe Carbon Footprint Management Market by Vertical, 2019 - 2022, USD Million
- TABLE 234 Rest of Europe Carbon Footprint Management Market by Vertical, 2023 - 2029, USD Million
- TABLE 235 Asia Pacific Carbon Footprint Management Market, 2019 - 2022, USD Million
- TABLE 236 Asia Pacific Carbon Footprint Management Market, 2023 - 2029, USD Million
- TABLE 237 Asia Pacific Carbon Footprint Management Market by Deployment, 2019 - 2022, USD Million
- TABLE 238 Asia Pacific Carbon Footprint Management Market by Deployment, 2023 - 2029, USD Million
- TABLE 239 Asia Pacific Cloud Market by Country, 2019 - 2022, USD Million
- TABLE 240 Asia Pacific Cloud Market by Country, 2023 - 2029, USD Million
- TABLE 241 Asia Pacific On-premise Market by Country, 2019 - 2022, USD Million
- TABLE 242 Asia Pacific On-premise Market by Country, 2023 - 2029, USD Million
- TABLE 243 Asia Pacific Carbon Footprint Management Market by Organization Size, 2019 - 2022, USD Million
- TABLE 244 Asia Pacific Carbon Footprint Management Market by Organization Size, 2023 - 2029, USD Million
- TABLE 245 Asia Pacific Corporates/Enterprises Market by Country, 2019 - 2022, USD Million
- TABLE 246 Asia Pacific Corporates/Enterprises Market by Country, 2023 - 2029, USD Million
- TABLE 247 Asia Pacific Mid-Tier Enterprises Market by Country, 2019 - 2022, USD Million
- TABLE 248 Asia Pacific Mid-Tier Enterprises Market by Country, 2023 - 2029, USD Million
- TABLE 249 Asia Pacific Small Businesses Market by Country, 2019 - 2022, USD Million
- TABLE 250 Asia Pacific Small Businesses Market by Country, 2023 - 2029, USD Million
- TABLE 251 Asia Pacific Carbon Footprint Management Market by Component, 2019 - 2022, USD Million
- TABLE 252 Asia Pacific Carbon Footprint Management Market by Component, 2023 - 2029, USD Million
- TABLE 253 Asia Pacific Solution Market by Country, 2019 - 2022, USD Million
- TABLE 254 Asia Pacific Solution Market by Country, 2023 - 2029, USD Million
- TABLE 255 Asia Pacific Services Market by Country, 2019 - 2022, USD Million
- TABLE 256 Asia Pacific Services Market by Country, 2023 - 2029, USD Million
- TABLE 257 Asia Pacific Carbon Footprint Management Market by Vertical, 2019 - 2022, USD Million
- TABLE 258 Asia Pacific Carbon Footprint Management Market by Vertical, 2023 - 2029, USD Million
- TABLE 259 Asia Pacific Manufacturing Market by Country, 2019 - 2022, USD Million
- TABLE 260 Asia Pacific Manufacturing Market by Country, 2023 - 2029, USD Million
- TABLE 261 Asia Pacific Financial Services Market by Country, 2019 - 2022, USD Million
- TABLE 262 Asia Pacific Financial Services Market by Country, 2023 - 2029, USD Million
- TABLE 263 Asia Pacific IT & Telecom Market by Country, 2019 - 2022, USD Million
- TABLE 264 Asia Pacific IT & Telecom Market by Country, 2023 - 2029, USD Million
- TABLE 265 Asia Pacific Government Market by Country, 2019 - 2022, USD Million
- TABLE 266 Asia Pacific Government Market by Country, 2023 - 2029, USD Million
- TABLE 267 Asia Pacific Energy & Utilities Market by Country, 2019 - 2022, USD Million
- TABLE 268 Asia Pacific Energy & Utilities Market by Country, 2023 - 2029, USD Million
- TABLE 269 Asia Pacific Residential & Commercial Buildings Market by Country, 2019 - 2022, USD Million
- TABLE 270 Asia Pacific Residential & Commercial Buildings Market by Country, 2023 - 2029, USD Million
- TABLE 271 Asia Pacific Others Market by Country, 2019 - 2022, USD Million
- TABLE 272 Asia Pacific Others Market by Country, 2023 - 2029, USD Million
- TABLE 273 Asia Pacific Carbon Footprint Management Market by Country, 2019 - 2022, USD Million
- TABLE 274 Asia Pacific Carbon Footprint Management Market by Country, 2023 - 2029, USD Million
- TABLE 275 China Carbon Footprint Management Market, 2019 - 2022, USD Million
- TABLE 276 China Carbon Footprint Management Market, 2023 - 2029, USD Million
- TABLE 277 China Carbon Footprint Management Market by Deployment, 2019 - 2022, USD Million
- TABLE 278 China Carbon Footprint Management Market by Deployment, 2023 - 2029, USD Million
- TABLE 279 China Carbon Footprint Management Market by Organization Size, 2019 - 2022, USD Million
- TABLE 280 China Carbon Footprint Management Market by Organization Size, 2023 - 2029, USD Million
- TABLE 281 China Carbon Footprint Management Market by Component, 2019 - 2022, USD Million
- TABLE 282 China Carbon Footprint Management Market by Component, 2023 - 2029, USD Million
- TABLE 283 China Carbon Footprint Management Market by Vertical, 2019 - 2022, USD Million
- TABLE 284 China Carbon Footprint Management Market by Vertical, 2023 - 2029, USD Million
- TABLE 285 Japan Carbon Footprint Management Market, 2019 - 2022, USD Million
- TABLE 286 Japan Carbon Footprint Management Market, 2023 - 2029, USD Million
- TABLE 287 Japan Carbon Footprint Management Market by Deployment, 2019 - 2022, USD Million
- TABLE 288 Japan Carbon Footprint Management Market by Deployment, 2023 - 2029, USD Million
- TABLE 289 Japan Carbon Footprint Management Market by Organization Size, 2019 - 2022, USD Million
- TABLE 290 Japan Carbon Footprint Management Market by Organization Size, 2023 - 2029, USD Million
- TABLE 291 Japan Carbon Footprint Management Market by Component, 2019 - 2022, USD Million
- TABLE 292 Japan Carbon Footprint Management Market by Component, 2023 - 2029, USD Million
- TABLE 293 Japan Carbon Footprint Management Market by Vertical, 2019 - 2022, USD Million
- TABLE 294 Japan Carbon Footprint Management Market by Vertical, 2023 - 2029, USD Million
- TABLE 295 India Carbon Footprint Management Market, 2019 - 2022, USD Million
- TABLE 296 India Carbon Footprint Management Market, 2023 - 2029, USD Million
- TABLE 297 India Carbon Footprint Management Market by Deployment, 2019 - 2022, USD Million
- TABLE 298 India Carbon Footprint Management Market by Deployment, 2023 - 2029, USD Million
- TABLE 299 India Carbon Footprint Management Market by Organization Size, 2019 - 2022, USD Million
- TABLE 300 India Carbon Footprint Management Market by Organization Size, 2023 - 2029, USD Million
- TABLE 301 India Carbon Footprint Management Market by Component, 2019 - 2022, USD Million
- TABLE 302 India Carbon Footprint Management Market by Component, 2023 - 2029, USD Million
- TABLE 303 India Carbon Footprint Management Market by Vertical, 2019 - 2022, USD Million
- TABLE 304 India Carbon Footprint Management Market by Vertical, 2023 - 2029, USD Million
- TABLE 305 South Korea Carbon Footprint Management Market, 2019 - 2022, USD Million
- TABLE 306 South Korea Carbon Footprint Management Market, 2023 - 2029, USD Million
- TABLE 307 South Korea Carbon Footprint Management Market by Deployment, 2019 - 2022, USD Million
- TABLE 308 South Korea Carbon Footprint Management Market by Deployment, 2023 - 2029, USD Million
- TABLE 309 South Korea Carbon Footprint Management Market by Organization Size, 2019 - 2022, USD Million
- TABLE 310 South Korea Carbon Footprint Management Market by Organization Size, 2023 - 2029, USD Million
- TABLE 311 South Korea Carbon Footprint Management Market by Component, 2019 - 2022, USD Million
- TABLE 312 South Korea Carbon Footprint Management Market by Component, 2023 - 2029, USD Million
- TABLE 313 South Korea Carbon Footprint Management Market by Vertical, 2019 - 2022, USD Million
- TABLE 314 South Korea Carbon Footprint Management Market by Vertical, 2023 - 2029, USD Million
- TABLE 315 Singapore Carbon Footprint Management Market, 2019 - 2022, USD Million
- TABLE 316 Singapore Carbon Footprint Management Market, 2023 - 2029, USD Million
- TABLE 317 Singapore Carbon Footprint Management Market by Deployment, 2019 - 2022, USD Million
- TABLE 318 Singapore Carbon Footprint Management Market by Deployment, 2023 - 2029, USD Million
- TABLE 319 Singapore Carbon Footprint Management Market by Organization Size, 2019 - 2022, USD Million
- TABLE 320 Singapore Carbon Footprint Management Market by Organization Size, 2023 - 2029, USD Million
- TABLE 321 Singapore Carbon Footprint Management Market by Component, 2019 - 2022, USD Million
- TABLE 322 Singapore Carbon Footprint Management Market by Component, 2023 - 2029, USD Million
- TABLE 323 Singapore Carbon Footprint Management Market by Vertical, 2019 - 2022, USD Million
- TABLE 324 Singapore Carbon Footprint Management Market by Vertical, 2023 - 2029, USD Million
- TABLE 325 Malaysia Carbon Footprint Management Market, 2019 - 2022, USD Million
- TABLE 326 Malaysia Carbon Footprint Management Market, 2023 - 2029, USD Million
- TABLE 327 Malaysia Carbon Footprint Management Market by Deployment, 2019 - 2022, USD Million
- TABLE 328 Malaysia Carbon Footprint Management Market by Deployment, 2023 - 2029, USD Million
- TABLE 329 Malaysia Carbon Footprint Management Market by Organization Size, 2019 - 2022, USD Million
- TABLE 330 Malaysia Carbon Footprint Management Market by Organization Size, 2023 - 2029, USD Million
- TABLE 331 Malaysia Carbon Footprint Management Market by Component, 2019 - 2022, USD Million
- TABLE 332 Malaysia Carbon Footprint Management Market by Component, 2023 - 2029, USD Million
- TABLE 333 Malaysia Carbon Footprint Management Market by Vertical, 2019 - 2022, USD Million
- TABLE 334 Malaysia Carbon Footprint Management Market by Vertical, 2023 - 2029, USD Million
- TABLE 335 Rest of Asia Pacific Carbon Footprint Management Market, 2019 - 2022, USD Million
- TABLE 336 Rest of Asia Pacific Carbon Footprint Management Market, 2023 - 2029, USD Million
- TABLE 337 Rest of Asia Pacific Carbon Footprint Management Market by Deployment, 2019 - 2022, USD Million
- TABLE 338 Rest of Asia Pacific Carbon Footprint Management Market by Deployment, 2023 - 2029, USD Million
- TABLE 339 Rest of Asia Pacific Carbon Footprint Management Market by Organization Size, 2019 - 2022, USD Million
- TABLE 340 Rest of Asia Pacific Carbon Footprint Management Market by Organization Size, 2023 - 2029, USD Million
- TABLE 341 Rest of Asia Pacific Carbon Footprint Management Market by Component, 2019 - 2022, USD Million
- TABLE 342 Rest of Asia Pacific Carbon Footprint Management Market by Component, 2023 - 2029, USD Million
- TABLE 343 Rest of Asia Pacific Carbon Footprint Management Market by Vertical, 2019 - 2022, USD Million
- TABLE 344 Rest of Asia Pacific Carbon Footprint Management Market by Vertical, 2023 - 2029, USD Million
- TABLE 345 LAMEA Carbon Footprint Management Market, 2019 - 2022, USD Million
- TABLE 346 LAMEA Carbon Footprint Management Market, 2023 - 2029, USD Million
- TABLE 347 LAMEA Carbon Footprint Management Market by Deployment, 2019 - 2022, USD Million
- TABLE 348 LAMEA Carbon Footprint Management Market by Deployment, 2023 - 2029, USD Million
- TABLE 349 LAMEA Cloud Market by Country, 2019 - 2022, USD Million
- TABLE 350 LAMEA Cloud Market by Country, 2023 - 2029, USD Million
- TABLE 351 LAMEA On-premise Market by Country, 2019 - 2022, USD Million
- TABLE 352 LAMEA On-premise Market by Country, 2023 - 2029, USD Million
- TABLE 353 LAMEA Carbon Footprint Management Market by Organization Size, 2019 - 2022, USD Million
- TABLE 354 LAMEA Carbon Footprint Management Market by Organization Size, 2023 - 2029, USD Million
- TABLE 355 LAMEA Corporates/Enterprises Market by Country, 2019 - 2022, USD Million
- TABLE 356 LAMEA Corporates/Enterprises Market by Country, 2023 - 2029, USD Million
- TABLE 357 LAMEA Mid-Tier Enterprises Market by Country, 2019 - 2022, USD Million
- TABLE 358 LAMEA Mid-Tier Enterprises Market by Country, 2023 - 2029, USD Million
- TABLE 359 LAMEA Small Businesses Market by Country, 2019 - 2022, USD Million
- TABLE 360 LAMEA Small Businesses Market by Country, 2023 - 2029, USD Million
- TABLE 361 LAMEA Carbon Footprint Management Market by Component, 2019 - 2022, USD Million
- TABLE 362 LAMEA Carbon Footprint Management Market by Component, 2023 - 2029, USD Million
- TABLE 363 LAMEA Solution Market by Country, 2019 - 2022, USD Million
- TABLE 364 LAMEA Solution Market by Country, 2023 - 2029, USD Million
- TABLE 365 LAMEA Services Market by Country, 2019 - 2022, USD Million
- TABLE 366 LAMEA Services Market by Country, 2023 - 2029, USD Million
- TABLE 367 LAMEA Carbon Footprint Management Market by Vertical, 2019 - 2022, USD Million
- TABLE 368 LAMEA Carbon Footprint Management Market by Vertical, 2023 - 2029, USD Million
- TABLE 369 LAMEA Manufacturing Market by Country, 2019 - 2022, USD Million
- TABLE 370 LAMEA Manufacturing Market by Country, 2023 - 2029, USD Million
- TABLE 371 LAMEA Financial Services Market by Country, 2019 - 2022, USD Million
- TABLE 372 LAMEA Financial Services Market by Country, 2023 - 2029, USD Million
- TABLE 373 LAMEA IT & Telecom Market by Country, 2019 - 2022, USD Million
- TABLE 374 LAMEA IT & Telecom Market by Country, 2023 - 2029, USD Million
- TABLE 375 LAMEA Government Market by Country, 2019 - 2022, USD Million
- TABLE 376 LAMEA Government Market by Country, 2023 - 2029, USD Million
- TABLE 377 LAMEA Energy & Utilities Market by Country, 2019 - 2022, USD Million
- TABLE 378 LAMEA Energy & Utilities Market by Country, 2023 - 2029, USD Million
- TABLE 379 LAMEA Residential & Commercial Buildings Market by Country, 2019 - 2022, USD Million
- TABLE 380 LAMEA Residential & Commercial Buildings Market by Country, 2023 - 2029, USD Million
- TABLE 381 LAMEA Others Market by Country, 2019 - 2022, USD Million
- TABLE 382 LAMEA Others Market by Country, 2023 - 2029, USD Million
- TABLE 383 LAMEA Carbon Footprint Management Market by Country, 2019 - 2022, USD Million
- TABLE 384 LAMEA Carbon Footprint Management Market by Country, 2023 - 2029, USD Million
- TABLE 385 Brazil Carbon Footprint Management Market, 2019 - 2022, USD Million
- TABLE 386 Brazil Carbon Footprint Management Market, 2023 - 2029, USD Million
- TABLE 387 Brazil Carbon Footprint Management Market by Deployment, 2019 - 2022, USD Million
- TABLE 388 Brazil Carbon Footprint Management Market by Deployment, 2023 - 2029, USD Million
- TABLE 389 Brazil Carbon Footprint Management Market by Organization Size, 2019 - 2022, USD Million
- TABLE 390 Brazil Carbon Footprint Management Market by Organization Size, 2023 - 2029, USD Million
- TABLE 391 Brazil Carbon Footprint Management Market by Component, 2019 - 2022, USD Million
- TABLE 392 Brazil Carbon Footprint Management Market by Component, 2023 - 2029, USD Million
- TABLE 393 Brazil Carbon Footprint Management Market by Vertical, 2019 - 2022, USD Million
- TABLE 394 Brazil Carbon Footprint Management Market by Vertical, 2023 - 2029, USD Million
- TABLE 395 Argentina Carbon Footprint Management Market, 2019 - 2022, USD Million
- TABLE 396 Argentina Carbon Footprint Management Market, 2023 - 2029, USD Million
- TABLE 397 Argentina Carbon Footprint Management Market by Deployment, 2019 - 2022, USD Million
- TABLE 398 Argentina Carbon Footprint Management Market by Deployment, 2023 - 2029, USD Million
- TABLE 399 Argentina Carbon Footprint Management Market by Organization Size, 2019 - 2022, USD Million
- TABLE 400 Argentina Carbon Footprint Management Market by Organization Size, 2023 - 2029, USD Million
- TABLE 401 Argentina Carbon Footprint Management Market by Component, 2019 - 2022, USD Million
- TABLE 402 Argentina Carbon Footprint Management Market by Component, 2023 - 2029, USD Million
- TABLE 403 Argentina Carbon Footprint Management Market by Vertical, 2019 - 2022, USD Million
- TABLE 404 Argentina Carbon Footprint Management Market by Vertical, 2023 - 2029, USD Million
- TABLE 405 UAE Carbon Footprint Management Market, 2019 - 2022, USD Million
- TABLE 406 UAE Carbon Footprint Management Market, 2023 - 2029, USD Million
- TABLE 407 UAE Carbon Footprint Management Market by Deployment, 2019 - 2022, USD Million
- TABLE 408 UAE Carbon Footprint Management Market by Deployment, 2023 - 2029, USD Million
- TABLE 409 UAE Carbon Footprint Management Market by Organization Size, 2019 - 2022, USD Million
- TABLE 410 UAE Carbon Footprint Management Market by Organization Size, 2023 - 2029, USD Million
- TABLE 411 UAE Carbon Footprint Management Market by Component, 2019 - 2022, USD Million
- TABLE 412 UAE Carbon Footprint Management Market by Component, 2023 - 2029, USD Million
- TABLE 413 UAE Carbon Footprint Management Market by Vertical, 2019 - 2022, USD Million
- TABLE 414 UAE Carbon Footprint Management Market by Vertical, 2023 - 2029, USD Million
- TABLE 415 Saudi Arabia Carbon Footprint Management Market, 2019 - 2022, USD Million
- TABLE 416 Saudi Arabia Carbon Footprint Management Market, 2023 - 2029, USD Million
- TABLE 417 Saudi Arabia Carbon Footprint Management Market by Deployment, 2019 - 2022, USD Million
- TABLE 418 Saudi Arabia Carbon Footprint Management Market by Deployment, 2023 - 2029, USD Million
- TABLE 419 Saudi Arabia Carbon Footprint Management Market by Organization Size, 2019 - 2022, USD Million
- TABLE 420 Saudi Arabia Carbon Footprint Management Market by Organization Size, 2023 - 2029, USD Million
- TABLE 421 Saudi Arabia Carbon Footprint Management Market by Component, 2019 - 2022, USD Million
- TABLE 422 Saudi Arabia Carbon Footprint Management Market by Component, 2023 - 2029, USD Million
- TABLE 423 Saudi Arabia Carbon Footprint Management Market by Vertical, 2019 - 2022, USD Million
- TABLE 424 Saudi Arabia Carbon Footprint Management Market by Vertical, 2023 - 2029, USD Million
- TABLE 425 South Africa Carbon Footprint Management Market, 2019 - 2022, USD Million
- TABLE 426 South Africa Carbon Footprint Management Market, 2023 - 2029, USD Million
- TABLE 427 South Africa Carbon Footprint Management Market by Deployment, 2019 - 2022, USD Million
- TABLE 428 South Africa Carbon Footprint Management Market by Deployment, 2023 - 2029, USD Million
- TABLE 429 South Africa Carbon Footprint Management Market by Organization Size, 2019 - 2022, USD Million
- TABLE 430 South Africa Carbon Footprint Management Market by Organization Size, 2023 - 2029, USD Million
- TABLE 431 South Africa Carbon Footprint Management Market by Component, 2019 - 2022, USD Million
- TABLE 432 South Africa Carbon Footprint Management Market by Component, 2023 - 2029, USD Million
- TABLE 433 South Africa Carbon Footprint Management Market by Vertical, 2019 - 2022, USD Million
- TABLE 434 South Africa Carbon Footprint Management Market by Vertical, 2023 - 2029, USD Million
- TABLE 435 Nigeria Carbon Footprint Management Market, 2019 - 2022, USD Million
- TABLE 436 Nigeria Carbon Footprint Management Market, 2023 - 2029, USD Million
- TABLE 437 Nigeria Carbon Footprint Management Market by Deployment, 2019 - 2022, USD Million
- TABLE 438 Nigeria Carbon Footprint Management Market by Deployment, 2023 - 2029, USD Million
- TABLE 439 Nigeria Carbon Footprint Management Market by Organization Size, 2019 - 2022, USD Million
- TABLE 440 Nigeria Carbon Footprint Management Market by Organization Size, 2023 - 2029, USD Million
- TABLE 441 Nigeria Carbon Footprint Management Market by Component, 2019 - 2022, USD Million
- TABLE 442 Nigeria Carbon Footprint Management Market by Component, 2023 - 2029, USD Million
- TABLE 443 Nigeria Carbon Footprint Management Market by Vertical, 2019 - 2022, USD Million
- TABLE 444 Nigeria Carbon Footprint Management Market by Vertical, 2023 - 2029, USD Million
- TABLE 445 Rest of LAMEA Carbon Footprint Management Market, 2019 - 2022, USD Million
- TABLE 446 Rest of LAMEA Carbon Footprint Management Market, 2023 - 2029, USD Million
- TABLE 447 Rest of LAMEA Carbon Footprint Management Market by Deployment, 2019 - 2022, USD Million
- TABLE 448 Rest of LAMEA Carbon Footprint Management Market by Deployment, 2023 - 2029, USD Million
- TABLE 449 Rest of LAMEA Carbon Footprint Management Market by Organization Size, 2019 - 2022, USD Million
- TABLE 450 Rest of LAMEA Carbon Footprint Management Market by Organization Size, 2023 - 2029, USD Million
- TABLE 451 Rest of LAMEA Carbon Footprint Management Market by Component, 2019 - 2022, USD Million
- TABLE 452 Rest of LAMEA Carbon Footprint Management Market by Component, 2023 - 2029, USD Million
- TABLE 453 Rest of LAMEA Carbon Footprint Management Market by Vertical, 2019 - 2022, USD Million
- TABLE 454 Rest of LAMEA Carbon Footprint Management Market by Vertical, 2023 - 2029, USD Million
- TABLE 455 Key information - Schneider Electric SE
- TABLE 456 Key Information - SAP SE
- TABLE 457 Key Information - Salesforce, Inc.
- TABLE 458 Key information - IBM Corporation
- TABLE 459 Key Information - ENGIE
- TABLE 460 Key Information - Intelex Technologies, ULC
- TABLE 461 Key Information - IsoMetrix
- TABLE 462 Key Information - Cority Software, Inc.
- TABLE 463 Key Information - Dakota Software Corporation
- TABLE 464 Key Information - Locus Technologies
List of Figures
- FIG 1 Methodology for the research
- FIG 2 KBV Cardinal Matrix
- FIG 3 Market Share Analysis, 2021
- FIG 4 Key Leading Strategies: Percentage Distribution (2019-2023)
- FIG 5 Global Carbon Footprint Management Market Share by Deployment, 2022
- FIG 6 Global Carbon Footprint Management Market Share by Deployment, 2029
- FIG 7 Global Carbon Footprint Management Market by Deployment, 2019 - 2029, USD Million
- FIG 8 Global Carbon Footprint Management Market Share by Organization Size, 2022
- FIG 9 Global Carbon Footprint Management Market Share by Organization Size, 2029
- FIG 10 Global Carbon Footprint Management Market by Organization Size, 2019 - 2029, USD Million
- FIG 11 Global Carbon Footprint Management Market Share by Component, 2022
- FIG 12 Global Carbon Footprint Management Market Share by Component, 2029
- FIG 13 Global Carbon Footprint Management Market by Component, 2019 - 2029, USD Million
- FIG 14 Global Carbon Footprint Management Market Share by Vertical, 2022
- FIG 15 Global Carbon Footprint Management Market Share by Vertical, 2029
- FIG 16 Global Carbon Footprint Management Market by Vertical, 2019 - 2029, USD Million
- FIG 17 Global Carbon Footprint Management Market Share by Region, 2022
- FIG 18 Global Carbon Footprint Management Market Share by Region, 2029
- FIG 19 Global Carbon Footprint Management Market by Region, 2019 - 2029, USD Million
- FIG 20 Recent strategies and developments: Schneider Electric SE
- FIG 21 Swot analysis: Schneider Electric SE
- FIG 22 Recent strategies and developments: SAP SE
- FIG 23 SWOT Analysis: SAP SE
- FIG 24 Recent strategies and developments: Schneider Electric SE
- FIG 25 SWOT Analysis: Salesforce.com, Inc.
- FIG 26 Swot analysis: IBM Corporation
The Global Carbon Footprint Management Market size is expected to reach $33.7 billion by 2029, rising at a market growth of 21.0% CAGR during the forecast period.
Energy & Utilities is one of the major applications of carbon footprint management because of the demand for heating and cooling, as well as the robust economy in the sector. In addition, adopting carbon footprint management results from the rise in carbon footprints caused by increased energy consumption and power generation. Hence, Energy & Utilities would generate approximately 1/5th share of the market by 2029. Adopting policies aimed at lowering greenhouse gases makes it easier for organizations to report on the results and behaviors of their members. The enactment of the United Nations Climate Change Conference, also known as COP26, is anticipated to propel numerous industries' adoption of carbon footprint management.
The major strategies followed by the market participants are Partnerships as the key developmental strategy to keep pace with the changing demands of end users. For instance, In November, 2021, Schneider partnered with GreenYellow for providing the global customers of both companies with energy efficiency programs. The partnership enhances the energy efficiency abilities of Schneider, thereby increasing its consulting capabilities. In addition, in February, 2023, Salesforce came into partnership with ERM, a global sustainability consultancy company. Through this partnership, both companies would help enterprises boost their decarbonization journeys and provide their sustainability goals.
Based on the Analysis presented in the Cardinal matrix; Schneider Electric SE are the forerunners in the Market. In April, 2022, AVEVA, a subsidiary of Schneider has partnered with FLSmidth for providing digital services and solutions to the mining industry. Additionally, both companies would boost the transformation to highly sustainable operations by combining world-leading processes and energy technologies for better asset performance at each level. Companies such as SAP SE, Salesforce, Inc. and IBM Corporation are some of the key innovators in the Market.
Market Growth Factors
Growing governmental efforts to implement low-carbon policies
Government programs support using carbon footprint management tools to track, monitor, and reduce emissions produced by residences and enterprises. Numerous governments and stakeholders concerned about climate change are constantly developing policies and making changes to lower GHG and emission levels in the environment. According to the United Nations Environment Programme (UNEP), over 120 nations have set new NDC goals for reducing emissions by 2030. Governments responsible for around 70% of the world's CO2 emissions have vowed to achieve net-zero emissions by 2050. Hence, the government's growing efforts to reduce emissions propel the market's growth.
Increasing use of cloud computing and promotion of a paperless economy
The world's economies are implementing paperless economies and cloud computing on a huge scale. For businesses adopting these strategies and environmentally friendly platforms to stop the emission of GHG and other carbon gases, nations provide a variety of subsidies. Using equipment as well as filtration caps in industrial settings like factories may be necessary for their adoption to reduce carbon emissions. The carbon footprint management application is used to ascertain the emission levels as well as document data through cloud or on-premise deployment before using these solutions, driving overall sales of the software. As a result, the market will soon be boosted by the inclusion and use of cloud computing for turning paperless.
Market Restraining Factors
High initial expenditure
The business has created green technologies to reduce the environmental impact of cars using cutting-edge techniques and carbon offsets to fight climate change. However, the adoption of low-carbon emission infrastructure by small firms is hampered by the challenge. The demand is also slowed down by a lack of knowledge about the advantages of funding low-carbon infrastructure. The high costs involved with upgrading to more modern infrastructure that is less harmful to the environment and produces fewer greenhouse gases limit market expansion.
Component Outlook
Based on component, the market is characterized into solution and services. The solution segment garnered the highest revenue share in the market in 2022. Easy installation, improved responsiveness, and precise data tracking for large and small businesses are the driving forces behind this segment's rapid expansion. An engaged supply chain is another element boosting the adoption of carbon footprint management technology. Consumers are becoming increasingly environmentally conscious and are more likely to support businesses that demonstrate their commitment to sustainability.
Deployment Outlook
On the basis of deployment, the market is classified into cloud and on-premise. The cloud segment witnessed the maximum revenue share in the market in 2022. It is less expensive, more scalable, and easier to execute, maintain, and upgrade a carbon footprint management program over the cloud. Additionally, it provides advantages like security, data control, speed, and round-the-clock support, making it the top option for clients. Cloud deployment allows for easy customization and configuration of the application, enabling organizations to tailor the application to their specific needs and requirements.
Organization Size Outlook
By organization size, the market is divided into corporate/enterprises, mid-tier enterprises, and small businesses. The small businesses segment acquired a substantial revenue share in the market in 2022. Due to the lesser size of their emissions, small enterprises have typically not faced governmental or stakeholder demand for emission/ESG reports. But throughout the projection period, this segment is predicted to rise quickly due to impending binding legislation in several industrialized economies worldwide and mounting investor pressure on emissions disclosure.
Application Outlook
Based on application, the market is segmented into manufacturing, energy & utilities, residential & commercial buildings, transportation & logistics, IT & telecom, financial services, government, and others. The manufacturing segment recorded the largest revenue share in the market in 2022. One of the leading worldwide producers of carbon emissions is the manufacturing sector. Some manufacturers have come to terms with the realities of carbon emissions, while many others continue searching for ways to cut them during manufacturing.
Regional Outlook
Region wise, the market is analyzed across North America, Europe, Asia Pacific, and LAMEA. The North America segment garnered the highest revenue share in the market in 2022. Due to the region's aggressive efforts to mitigate the consequences of climate change, North America has a growing market. As a result, the nations in the region have established strict nationally determined contribution (NDC) goals and enforceable environmental, social, and governance (ESG) laws. As a result, over the coming years, demand is anticipated to increase significantly.
The market research report covers the analysis of key stake holders of the market. Key companies profiled in the report include Schneider Electric SE, SAP SE, Salesforce, Inc., IBM Corporation, ENGIE, Intelex Technologies, ULC, IsoMetrix, Cority Software, Inc. (Thoma Bravo), Dakota Software Corporation and Locus Technologies.
Recent Strategies Deployed in Carbon Footprint Management Market
Partnerships, Collaborations and Agreements:
Feb-2023: Salesforce came into partnership with ERM, a global sustainability consultancy company. Through this partnership, both companies would help enterprises boost their decarbonization journeys and provide their sustainability goals.
Apr-2022: AVEVA, a subsidiary of Schneider has partnered with FLSmidth, a sustainability solutions provider for the cement and mining industry. The partnership aims at bringing digital services and solutions to the mining industry. Additionally, both companies would boost the transformation to highly sustainable operations by combining world-leading processes and energy technologies for better asset performance at each level.
Feb-2022: SAP SE came into partnership with BearingPoint, a technology and management consultancy to address the issues regarding environmental and carbon footprint. Under this partnership, both companies aim to innovate, design and develop solutions for customers to help them reach zero emissions. This partnership boosts the SAP Product Footprint Management solution and helps make SAP a pioneer in product footprint solutions that support its customers in enhancing the sustainability of its products and solutions.
Nov-2021: Schneider partnered with GreenYellow, a trusted energy partner of private companies. The partnership aims at providing the global customers of both companies with energy efficiency programs. The partnership enhances the energy efficiency abilities of Schneider, thereby increasing its consulting capabilities.
Apr-2021: SAP SE partnered with Accenture, a company leading in information technology services and consulting. The partnership aims to help enterprises implant sustainability across the complete range of their business operations. Moreover, with this partnership companies plan to co-develop and co-innovate SAP's new solution for responsible design and production consisting of abilities that help enterprises embed sustainability metrics in their value and supply chain.
Feb-2021: ENGIE joined hands with Orange, a developer of solar and wind power across France. The collaboration aims to offer a worldwide renewable energy supply solution across France. Furthermore, ENGIE would put its specialization in energy management to utilize to deploy an ongoing energy strip.
Jan-2021: Salesforce extended its partnership with Accenture, a company leading in information technology services and consulting. Through this partnership, both companies would help enterprises embed sustainability into their business, meet emerging customer and stakeholder expectations and contribute to advancing the United Nations Sustainable Development Goals (SDGs).
Product Launches and Product Expansions:
Dec-2022: Salesforce announced the launch of Automate ESG Reporting, a solution to help organizations meet emerging stakeholder demand for transparency in environmental, social, and governance (ESG). The launched solution allows enterprises to manage ESG data in real-time and generate framework-specific reports.
May-2022: Schneider Electric unveiled EcoStruxure Building Operation 2022 and Space Logic Insight-Sensor. EcoStruxure Building Operation is a building management solution that is used by managers to oversee and optimize isolated operations. Key features of the solution include a dashboard and report User Interface for better insights, cybersecurity features, wider data accessibility, and scalability for the subscription. SpaceLogic Insight-Sensor is a mounted sensor that is used to sense humidity, light, and temperature. Key features include reconfiguration ability, data analytics, and quick installation.
Feb-2022: Salesforce announced the launch of Net Zero Cloud 2.0, a system for measuring greenhouse gas emissions. The product would aim to offer companies greater insights, supplier management, and reliable reporting to achieve net-zero status as soon as possible.
Sep-2021: ENGIE introduced Ellipse, a net zero carbon platform to boost global decarbonization efforts. The product boosts global decarbonization efforts for businesses across scopes 1, 2, and 3. Moreover, the product launched is in support of organizations facing the emerging urgency to decrease carbon emissions and implement a strategic action plan.
Aug-2021: Cority unveiled Sustainability Cloud, a sustainability and ESG solution. The solution allows companies to manage, measure and meet goals to enhance sustainable performance and build a greener future. Additionally, Cority's Sustainability Cloud makes sure the data is accurate, auditable, and ready to be aligned for building transparent ESG disclosures and sustainability reports.
Jan-2021: Schneider Electric unveiled Climate Change Advisory Service aimed at addressing issues regarding business sustainability. The service features AI-powered resource data management, forecasting and budgeting, supply chain management solutions, Decarbonization strategy buildout, and renewable energy opportunity evaluation.
Acquisitions and Mergers:
May-2023: Cority acquired Greenstone, a company engaged in offering Sustainability & ESG Reporting Software. This acquisition strengthens Sustainability & ESG Capabilities as well as focuses to both private Market Investors and Enterprise Corporations.
Jan-2022: IBM acquired Envizi, a provider of data and analytics software. The acquisition aimed to allow consumers to speed up environmental initiatives. This move would add value to the company's increasing investments in AI-powered software that include IBM Sterling for supply chain analysis and IBM Maximo for asset management.
Jun-2021: Schneider Electric acquired Operation Technology, Inc., a company specializing in engineering and energy management solutions. This acquisition enhances Schneider's market position in maintenance, design, and operations.
Business Expansions:
Feb-2023: Schneider Electric added new product lines in its Bengaluru manufacturing facility. The expansion of the facility aims at addressing the increasing demand for energy management solutions.
Scope of the Study
Market Segments covered in the Report:
By Deployment
- Cloud
- On-premise
By Organization Size
- Corporates/Enterprises
- Mid-Tier Enterprises
- Small Businesses
By Component
- Solution
- Services
By Vertical
- Manufacturing
- Financial Services
- IT & Telecom
- Government
- Energy & Utilities
- Residential & Commercial Buildings
- Others
By Geography
- North America
- US
- Canada
- Mexico
- Rest of North America
- Europe
- Germany
- UK
- France
- Russia
- Spain
- Italy
- Rest of Europe
- Asia Pacific
- China
- Japan
- India
- South Korea
- Singapore
- Malaysia
- Rest of Asia Pacific
- LAMEA
- Brazil
- Argentina
- UAE
- Saudi Arabia
- South Africa
- Nigeria
- Rest of LAMEA
Companies Profiled
- Schneider Electric SE
- SAP SE
- Salesforce, Inc.
- IBM Corporation
- ENGIE
- Intelex Technologies, ULC
- IsoMetrix
- Cority Software, Inc. (Thoma Bravo)
- Dakota Software Corporation
- Locus Technologies
Unique Offerings from KBV Research
- Exhaustive coverage
- Highest number of market tables and figures
- Subscription based model available
- Guaranteed best price
- Assured post sales research support with 10% customization free
Table of Contents
Chapter 1. Market Scope & Methodology
- 1.1 Market Definition
- 1.2 Objectives
- 1.3 Market Scope
- 1.4 Segmentation
- 1.4.1 Global Carbon Footprint Management Market, by Deployment
- 1.4.2 Global Carbon Footprint Management Market, by Organization Size
- 1.4.3 Global Carbon Footprint Management Market, by Component
- 1.4.4 Global Carbon Footprint Management Market, by Vertical
- 1.4.5 Global Carbon Footprint Management Market, by Geography
- 1.5 Methodology for the research
Chapter 2. Market Overview
- 2.1 Introduction
- 2.1.1 Overview
- 2.1.1.1 Market Composition & Scenario
- 2.1.1 Overview
- 2.2 Key Factors Impacting the Market
- 2.2.1 Market Drivers
- 2.2.2 Market Restraints
Chapter 3. Competition Analysis - Global
- 3.1 KBV Cardinal Matrix
- 3.2 Recent Industry Wide Strategic Developments
- 3.2.1 Partnerships, Collaborations and Agreements
- 3.2.2 Product Launches and Product Expansions
- 3.2.3 Acquisition and Mergers
- 3.2.4 Business Expansion
- 3.3 Market Share Analysis, 2021
- 3.4 Top Winning Strategies
- 3.4.1 Key Leading Strategies: Percentage Distribution (2019-2023)
Chapter 4. Global Carbon Footprint Management Market by Deployment
- 4.1 Global Cloud Market by Region
- 4.2 Global On-premise Market by Region
Chapter 5. Global Carbon Footprint Management Market by Organization Size
- 5.1 Global Corporates/Enterprises Market by Region
- 5.2 Global Mid-Tier Enterprises Market by Region
- 5.3 Global Small Businesses Market by Region
Chapter 6. Global Carbon Footprint Management Market by Component
- 6.1 Global Solution Market by Region
- 6.2 Global Services Market by Region
Chapter 7. Global Carbon Footprint Management Market by Vertical
- 7.1 Global Manufacturing Market by Region
- 7.2 Global Financial Services Market by Region
- 7.3 Global IT & Telecom Market by Region
- 7.4 Global Government Market by Region
- 7.5 Global Energy & Utilities Market by Region
- 7.6 Global Residential & Commercial Buildings Market by Region
- 7.7 Global Others Market by Region
Chapter 8. Global Carbon Footprint Management Market by Region
- 8.1 North America Carbon Footprint Management Market
- 8.1.1 North America Carbon Footprint Management Market by Deployment
- 8.1.1.1 North America Cloud Market by Country
- 8.1.1.2 North America On-premise Market by Country
- 8.1.2 North America Carbon Footprint Management Market by Organization Size
- 8.1.2.1 North America Corporates/Enterprises Market by Country
- 8.1.2.2 North America Mid-Tier Enterprises Market by Country
- 8.1.2.3 North America Small Businesses Market by Country
- 8.1.3 North America Carbon Footprint Management Market by Component
- 8.1.3.1 North America Solution Market by Country
- 8.1.3.2 North America Services Market by Country
- 8.1.4 North America Carbon Footprint Management Market by Vertical
- 8.1.4.1 North America Manufacturing Market by Country
- 8.1.4.2 North America Financial Services Market by Country
- 8.1.4.3 North America IT & Telecom Market by Country
- 8.1.4.4 North America Government Market by Country
- 8.1.4.5 North America Energy & Utilities Market by Country
- 8.1.4.6 North America Residential & Commercial Buildings Market by Country
- 8.1.4.7 North America Others Market by Country
- 8.1.5 North America Carbon Footprint Management Market by Country
- 8.1.5.1 US Carbon Footprint Management Market
- 8.1.5.1.1 US Carbon Footprint Management Market by Deployment
- 8.1.5.1.2 US Carbon Footprint Management Market by Organization Size
- 8.1.5.1.3 US Carbon Footprint Management Market by Component
- 8.1.5.1.4 US Carbon Footprint Management Market by Vertical
- 8.1.5.2 Canada Carbon Footprint Management Market
- 8.1.5.2.1 Canada Carbon Footprint Management Market by Deployment
- 8.1.5.2.2 Canada Carbon Footprint Management Market by Organization Size
- 8.1.5.2.3 Canada Carbon Footprint Management Market by Component
- 8.1.5.2.4 Canada Carbon Footprint Management Market by Vertical
- 8.1.5.3 Mexico Carbon Footprint Management Market
- 8.1.5.3.1 Mexico Carbon Footprint Management Market by Deployment
- 8.1.5.3.2 Mexico Carbon Footprint Management Market by Organization Size
- 8.1.5.3.3 Mexico Carbon Footprint Management Market by Component
- 8.1.5.3.4 Mexico Carbon Footprint Management Market by Vertical
- 8.1.5.4 Rest of North America Carbon Footprint Management Market
- 8.1.5.4.1 Rest of North America Carbon Footprint Management Market by Deployment
- 8.1.5.4.2 Rest of North America Carbon Footprint Management Market by Organization Size
- 8.1.5.4.3 Rest of North America Carbon Footprint Management Market by Component
- 8.1.5.4.4 Rest of North America Carbon Footprint Management Market by Vertical
- 8.1.5.1 US Carbon Footprint Management Market
- 8.1.1 North America Carbon Footprint Management Market by Deployment
- 8.2 Europe Carbon Footprint Management Market
- 8.2.1 Europe Carbon Footprint Management Market by Deployment
- 8.2.1.1 Europe Cloud Market by Country
- 8.2.1.2 Europe On-premise Market by Country
- 8.2.2 Europe Carbon Footprint Management Market by Organization Size
- 8.2.2.1 Europe Corporates/Enterprises Market by Country
- 8.2.2.2 Europe Mid-Tier Enterprises Market by Country
- 8.2.2.3 Europe Small Businesses Market by Country
- 8.2.3 Europe Carbon Footprint Management Market by Component
- 8.2.3.1 Europe Solution Market by Country
- 8.2.3.2 Europe Services Market by Country
- 8.2.4 Europe Carbon Footprint Management Market by Vertical
- 8.2.4.1 Europe Manufacturing Market by Country
- 8.2.4.2 Europe Financial Services Market by Country
- 8.2.4.3 Europe IT & Telecom Market by Country
- 8.2.4.4 Europe Government Market by Country
- 8.2.4.5 Europe Energy & Utilities Market by Country
- 8.2.4.6 Europe Residential & Commercial Buildings Market by Country
- 8.2.4.7 Europe Others Market by Country
- 8.2.5 Europe Carbon Footprint Management Market by Country
- 8.2.5.1 Germany Carbon Footprint Management Market
- 8.2.5.1.1 Germany Carbon Footprint Management Market by Deployment
- 8.2.5.1.2 Germany Carbon Footprint Management Market by Organization Size
- 8.2.5.1.3 Germany Carbon Footprint Management Market by Component
- 8.2.5.1.4 Germany Carbon Footprint Management Market by Vertical
- 8.2.5.2 UK Carbon Footprint Management Market
- 8.2.5.2.1 UK Carbon Footprint Management Market by Deployment
- 8.2.5.2.2 UK Carbon Footprint Management Market by Organization Size
- 8.2.5.2.3 UK Carbon Footprint Management Market by Component
- 8.2.5.2.4 UK Carbon Footprint Management Market by Vertical
- 8.2.5.3 France Carbon Footprint Management Market
- 8.2.5.3.1 France Carbon Footprint Management Market by Deployment
- 8.2.5.3.2 France Carbon Footprint Management Market by Organization Size
- 8.2.5.3.3 France Carbon Footprint Management Market by Component
- 8.2.5.3.4 France Carbon Footprint Management Market by Vertical
- 8.2.5.4 Russia Carbon Footprint Management Market
- 8.2.5.4.1 Russia Carbon Footprint Management Market by Deployment
- 8.2.5.4.2 Russia Carbon Footprint Management Market by Organization Size
- 8.2.5.4.3 Russia Carbon Footprint Management Market by Component
- 8.2.5.4.4 Russia Carbon Footprint Management Market by Vertical
- 8.2.5.5 Spain Carbon Footprint Management Market
- 8.2.5.5.1 Spain Carbon Footprint Management Market by Deployment
- 8.2.5.5.2 Spain Carbon Footprint Management Market by Organization Size
- 8.2.5.5.3 Spain Carbon Footprint Management Market by Component
- 8.2.5.5.4 Spain Carbon Footprint Management Market by Vertical
- 8.2.5.6 Italy Carbon Footprint Management Market
- 8.2.5.6.1 Italy Carbon Footprint Management Market by Deployment
- 8.2.5.6.2 Italy Carbon Footprint Management Market by Organization Size
- 8.2.5.6.3 Italy Carbon Footprint Management Market by Component
- 8.2.5.6.4 Italy Carbon Footprint Management Market by Vertical
- 8.2.5.7 Rest of Europe Carbon Footprint Management Market
- 8.2.5.7.1 Rest of Europe Carbon Footprint Management Market by Deployment
- 8.2.5.7.2 Rest of Europe Carbon Footprint Management Market by Organization Size
- 8.2.5.7.3 Rest of Europe Carbon Footprint Management Market by Component
- 8.2.5.7.4 Rest of Europe Carbon Footprint Management Market by Vertical
- 8.2.5.1 Germany Carbon Footprint Management Market
- 8.2.1 Europe Carbon Footprint Management Market by Deployment
- 8.3 Asia Pacific Carbon Footprint Management Market
- 8.3.1 Asia Pacific Carbon Footprint Management Market by Deployment
- 8.3.1.1 Asia Pacific Cloud Market by Country
- 8.3.1.2 Asia Pacific On-premise Market by Country
- 8.3.2 Asia Pacific Carbon Footprint Management Market by Organization Size
- 8.3.2.1 Asia Pacific Corporates/Enterprises Market by Country
- 8.3.2.2 Asia Pacific Mid-Tier Enterprises Market by Country
- 8.3.2.3 Asia Pacific Small Businesses Market by Country
- 8.3.3 Asia Pacific Carbon Footprint Management Market by Component
- 8.3.3.1 Asia Pacific Solution Market by Country
- 8.3.3.2 Asia Pacific Services Market by Country
- 8.3.4 Asia Pacific Carbon Footprint Management Market by Vertical
- 8.3.4.1 Asia Pacific Manufacturing Market by Country
- 8.3.4.2 Asia Pacific Financial Services Market by Country
- 8.3.4.3 Asia Pacific IT & Telecom Market by Country
- 8.3.4.4 Asia Pacific Government Market by Country
- 8.3.4.5 Asia Pacific Energy & Utilities Market by Country
- 8.3.4.6 Asia Pacific Residential & Commercial Buildings Market by Country
- 8.3.4.7 Asia Pacific Others Market by Country
- 8.3.5 Asia Pacific Carbon Footprint Management Market by Country
- 8.3.5.1 China Carbon Footprint Management Market
- 8.3.5.1.1 China Carbon Footprint Management Market by Deployment
- 8.3.5.1.2 China Carbon Footprint Management Market by Organization Size
- 8.3.5.1.3 China Carbon Footprint Management Market by Component
- 8.3.5.1.4 China Carbon Footprint Management Market by Vertical
- 8.3.5.2 Japan Carbon Footprint Management Market
- 8.3.5.2.1 Japan Carbon Footprint Management Market by Deployment
- 8.3.5.2.2 Japan Carbon Footprint Management Market by Organization Size
- 8.3.5.2.3 Japan Carbon Footprint Management Market by Component
- 8.3.5.2.4 Japan Carbon Footprint Management Market by Vertical
- 8.3.5.3 India Carbon Footprint Management Market
- 8.3.5.3.1 India Carbon Footprint Management Market by Deployment
- 8.3.5.3.2 India Carbon Footprint Management Market by Organization Size
- 8.3.5.3.3 India Carbon Footprint Management Market by Component
- 8.3.5.3.4 India Carbon Footprint Management Market by Vertical
- 8.3.5.4 South Korea Carbon Footprint Management Market
- 8.3.5.4.1 South Korea Carbon Footprint Management Market by Deployment
- 8.3.5.4.2 South Korea Carbon Footprint Management Market by Organization Size
- 8.3.5.4.3 South Korea Carbon Footprint Management Market by Component
- 8.3.5.4.4 South Korea Carbon Footprint Management Market by Vertical
- 8.3.5.5 Singapore Carbon Footprint Management Market
- 8.3.5.5.1 Singapore Carbon Footprint Management Market by Deployment
- 8.3.5.5.2 Singapore Carbon Footprint Management Market by Organization Size
- 8.3.5.5.3 Singapore Carbon Footprint Management Market by Component
- 8.3.5.5.4 Singapore Carbon Footprint Management Market by Vertical
- 8.3.5.6 Malaysia Carbon Footprint Management Market
- 8.3.5.6.1 Malaysia Carbon Footprint Management Market by Deployment
- 8.3.5.6.2 Malaysia Carbon Footprint Management Market by Organization Size
- 8.3.5.6.3 Malaysia Carbon Footprint Management Market by Component
- 8.3.5.6.4 Malaysia Carbon Footprint Management Market by Vertical
- 8.3.5.7 Rest of Asia Pacific Carbon Footprint Management Market
- 8.3.5.7.1 Rest of Asia Pacific Carbon Footprint Management Market by Deployment
- 8.3.5.7.2 Rest of Asia Pacific Carbon Footprint Management Market by Organization Size
- 8.3.5.7.3 Rest of Asia Pacific Carbon Footprint Management Market by Component
- 8.3.5.7.4 Rest of Asia Pacific Carbon Footprint Management Market by Vertical
- 8.3.5.1 China Carbon Footprint Management Market
- 8.3.1 Asia Pacific Carbon Footprint Management Market by Deployment
- 8.4 LAMEA Carbon Footprint Management Market
- 8.4.1 LAMEA Carbon Footprint Management Market by Deployment
- 8.4.1.1 LAMEA Cloud Market by Country
- 8.4.1.2 LAMEA On-premise Market by Country
- 8.4.2 LAMEA Carbon Footprint Management Market by Organization Size
- 8.4.2.1 LAMEA Corporates/Enterprises Market by Country
- 8.4.2.2 LAMEA Mid-Tier Enterprises Market by Country
- 8.4.2.3 LAMEA Small Businesses Market by Country
- 8.4.3 LAMEA Carbon Footprint Management Market by Component
- 8.4.3.1 LAMEA Solution Market by Country
- 8.4.3.2 LAMEA Services Market by Country
- 8.4.4 LAMEA Carbon Footprint Management Market by Vertical
- 8.4.4.1 LAMEA Manufacturing Market by Country
- 8.4.4.2 LAMEA Financial Services Market by Country
- 8.4.4.3 LAMEA IT & Telecom Market by Country
- 8.4.4.4 LAMEA Government Market by Country
- 8.4.4.5 LAMEA Energy & Utilities Market by Country
- 8.4.4.6 LAMEA Residential & Commercial Buildings Market by Country
- 8.4.4.7 LAMEA Others Market by Country
- 8.4.5 LAMEA Carbon Footprint Management Market by Country
- 8.4.5.1 Brazil Carbon Footprint Management Market
- 8.4.5.1.1 Brazil Carbon Footprint Management Market by Deployment
- 8.4.5.1.2 Brazil Carbon Footprint Management Market by Organization Size
- 8.4.5.1.3 Brazil Carbon Footprint Management Market by Component
- 8.4.5.1.4 Brazil Carbon Footprint Management Market by Vertical
- 8.4.5.2 Argentina Carbon Footprint Management Market
- 8.4.5.2.1 Argentina Carbon Footprint Management Market by Deployment
- 8.4.5.2.2 Argentina Carbon Footprint Management Market by Organization Size
- 8.4.5.2.3 Argentina Carbon Footprint Management Market by Component
- 8.4.5.2.4 Argentina Carbon Footprint Management Market by Vertical
- 8.4.5.3 UAE Carbon Footprint Management Market
- 8.4.5.3.1 UAE Carbon Footprint Management Market by Deployment
- 8.4.5.3.2 UAE Carbon Footprint Management Market by Organization Size
- 8.4.5.3.3 UAE Carbon Footprint Management Market by Component
- 8.4.5.3.4 UAE Carbon Footprint Management Market by Vertical
- 8.4.5.4 Saudi Arabia Carbon Footprint Management Market
- 8.4.5.4.1 Saudi Arabia Carbon Footprint Management Market by Deployment
- 8.4.5.4.2 Saudi Arabia Carbon Footprint Management Market by Organization Size
- 8.4.5.4.3 Saudi Arabia Carbon Footprint Management Market by Component
- 8.4.5.4.4 Saudi Arabia Carbon Footprint Management Market by Vertical
- 8.4.5.5 South Africa Carbon Footprint Management Market
- 8.4.5.5.1 South Africa Carbon Footprint Management Market by Deployment
- 8.4.5.5.2 South Africa Carbon Footprint Management Market by Organization Size
- 8.4.5.5.3 South Africa Carbon Footprint Management Market by Component
- 8.4.5.5.4 South Africa Carbon Footprint Management Market by Vertical
- 8.4.5.6 Nigeria Carbon Footprint Management Market
- 8.4.5.6.1 Nigeria Carbon Footprint Management Market by Deployment
- 8.4.5.6.2 Nigeria Carbon Footprint Management Market by Organization Size
- 8.4.5.6.3 Nigeria Carbon Footprint Management Market by Component
- 8.4.5.6.4 Nigeria Carbon Footprint Management Market by Vertical
- 8.4.5.7 Rest of LAMEA Carbon Footprint Management Market
- 8.4.5.7.1 Rest of LAMEA Carbon Footprint Management Market by Deployment
- 8.4.5.7.2 Rest of LAMEA Carbon Footprint Management Market by Organization Size
- 8.4.5.7.3 Rest of LAMEA Carbon Footprint Management Market by Component
- 8.4.5.7.4 Rest of LAMEA Carbon Footprint Management Market by Vertical
- 8.4.5.1 Brazil Carbon Footprint Management Market
- 8.4.1 LAMEA Carbon Footprint Management Market by Deployment
Chapter 9. Company Profiles
- 9.1 Schneider Electric SE
- 9.1.1 Company Overview
- 9.1.2 Financial Analysis
- 9.1.3 Segmental and Regional Analysis
- 9.1.4 Research & Development Expense
- 9.1.5 Recent strategies and developments:
- 9.1.5.1 Partnerships, Collaborations, and Agreements:
- 9.1.5.2 Product Launches and Product Expansions:
- 9.1.5.3 Business Expansions:
- 9.1.6 SWOT Analysis
- 9.2 SAP SE
- 9.2.1 Company Overview
- 9.2.2 Financial Analysis
- 9.2.3 Segmental and Regional Analysis
- 9.2.4 Research & Development Expense
- 9.2.5 Recent strategies and developments:
- 9.2.5.1 Partnerships, Collaborations, and Agreements:
- 9.2.5.2 Product Launches and Product Expansions:
- 9.2.6 SWOT Analysis
- 9.3 Salesforce, Inc.
- 9.3.1 Company Overview
- 9.3.2 Financial Analysis
- 9.3.3 Regional Analysis
- 9.3.4 Research & Development Expense
- 9.3.5 Recent strategies and developments:
- 9.3.5.1 Partnerships, Collaborations and Agreements:
- 9.3.5.2 Product Launches and Product Expansions:
- 9.3.6 SWOT Analysis
- 9.4 IBM Corporation
- 9.4.1 Company Overview
- 9.4.2 Financial Analysis
- 9.4.3 Regional & Segmental Analysis
- 9.4.4 Research & Development Expenses
- 9.4.5 Recent strategies and developments:
- 9.4.5.1 Acquisition and Mergers:
- 9.4.6 SWOT Analysis
- 9.5 ENGIE
- 9.5.1 Company Overview
- 9.5.2 Financial Analysis
- 9.5.3 Segmental and Regional Analysis
- 9.5.4 Recent strategies and developments:
- 9.5.4.1 Partnerships, Collaborations, and Agreements:
- 9.5.4.2 Product Launches and Product Expansions:
- 9.6 Intelex Technologies, ULC (Industrial Scientific Corporation)
- 9.6.1 Company Overview
- 9.6.2 Financial Analysis
- 9.6.3 Segmental and Regional Analysis
- 9.6.4 Research & Development Expense
- 9.7 IsoMetrix
- 9.7.1 Company Overview
- 9.8 Cority Software, Inc. (Thoma Bravo)
- 9.8.1 Company Overview
- 9.8.2 Recent strategies and developments:
- 9.8.2.1 Acquisition and Mergers:
- 9.8.2.2 Product Launches and Product Expansions:
- 9.9 Dakota Software Corporation
- 9.9.1 Company Overview
- 9.10. Locus Technologies
- 9.10.1 Company Overview