|
|
市場調査レポート
商品コード
1276478
オイル状態監視の世界市場規模、シェア、産業動向分析レポート:製品タイプ別(エンジン、ギアシステム、タービン、油圧システム、コンプレッサー)、サンプリングタイプ別、エンドユーザー別、地域別展望と予測、2023~2029年Global Oil Condition Monitoring Market Size, Share & Industry Trends Analysis Report By Product Type (Engine, Gear Systems, Turbine, Hydraulic Systems and Compressor), By Sampling Type, By End User, By Regional Outlook and Forecast, 2023 - 2029 |
||||||
|
|
|||||||


| オイル状態監視の世界市場規模、シェア、産業動向分析レポート:製品タイプ別(エンジン、ギアシステム、タービン、油圧システム、コンプレッサー)、サンプリングタイプ別、エンドユーザー別、地域別展望と予測、2023~2029年 |
|
出版日: 2023年04月28日
発行: KBV Research
ページ情報: 英文 233 Pages
納期: 即納可能
|
- 全表示
- 概要
- 図表
- 目次
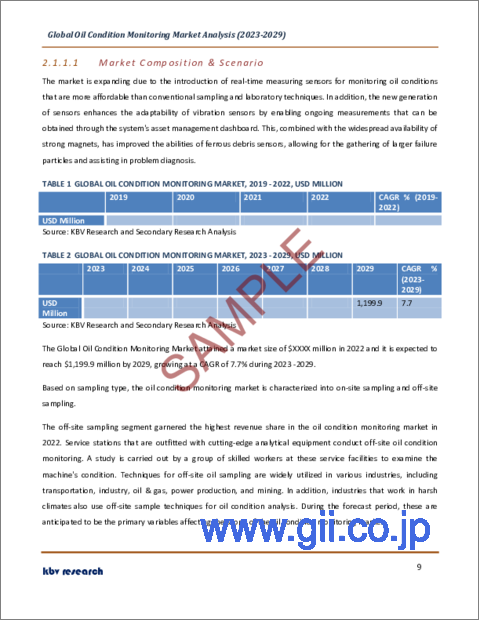
オイル状態監視市場規模は、2029年までに12億米ドルに達すると予測され、予測期間中にCAGR7.7%の市場成長率で上昇すると予想されています。
オイルの状態を監視することで、燃料、潤滑油、冷却水の物理的特性の変化だけでなく、摩耗や破損のパターンを特定するのに役立ちます。例えば、潤滑油、燃料、酸、冷却剤などの汚染により、オイルが潤滑能力を失い、機器に損傷を与える可能性があります。そのため、重要な機器の機能を維持するために、オイル状態監視を使用する企業が増えています。
自動車産業の拡大と予防保全の需要の高まりが、オイル状態監視市場を推進する主な要因となっています。世界中の多くの人々が自動車を欲しがるようになり、自動車産業は世界中で猛烈なスピードで拡大しています。このことは、オイル状態監視の需要を促進する主要な要因になると思われます。
COVID-19の影響分析
過去10年間の市場競争の激化により、オイル状態監視市場はかつてないほどの成長を遂げました。その結果、機械状態監視は予知保全の最も一般的な方法となり、その需要を増加させました。しかし、COVID-19はこの分野に深刻な影響を与え、需要と供給が同時に激減しました。このパンデミックにより、市場の拡大が鈍化しました。
市場の成長要因
機械の健康を維持するための手頃なソリューションへの需要の増加
オイルの状態を監視するソリューションの需要は、特にプロセス産業において、製品の品質を重視したジャストインタイム在庫とリーン生産技術がより重要になるにつれて増加すると予想されます。予知保全は、最近、資産管理者や産業界のオペレーターに支持されるようになった技術です。予知保全を活用することで、資産の状態を把握し、特定のシステムや部品が故障して交換や修理が必要になるタイミングを予測することができます。
重要な資産の寿命を向上させることの重要性が高まる
資産のライフサイクルにおいて、企業はその資産ができるだけ長く、効果的に目的を果たすことを期待しています。設計、運用、設置、廃止はすべて、システムにおける資産のライフサイクルの一部です。資産の性能と資産の健康状態は、様々な要因によって影響を受けます。例えば、機械の中の潤滑油は、常に危険な状況で動作しなければならず、連続的に高い圧力にさらされます。適切なオイル状態監視サービスを利用すれば、機器の交換にかかるコストを半分程度まで削減することができます。その結果、多くの企業が機器の故障を減らし、そのような機器の稼働寿命をさらに延ばすために、リアルタイムのオイル状態監視サービスを選択しています。したがって、市場の拡大は、これらの要因によって推進されています。
市場抑制要因
既存システムとの統合における課題
生産工程で卓越したオペレーションを実現するために、いくつかの企業では、ポータブルキット、センサー、オンサイトラボを含むオンサイトのオイル状態監視システムを多用しています。これらのシステムを正しく操作するためには、一定の知識が必要です。一部のシステムは、孤立した場所や手の届きにくい場所に設置されているため、これらの地域では有能な労働者の不足が心配されます。また、エンドユーザー層における改造への抵抗が大きいことも、業界関係者が取り組むべき重要な課題です。潜在的な顧客は、有資格者の不足や信頼性への懸念などの問題から、購入に消極的になる可能性があります。したがって、これらの要素はすべて、今後数年間の市場の成長を妨げています。
製品タイプの展望
製品タイプ別に見ると、オイル状態監視市場はタービン、コンプレッサー、エンジン、ギアシステム、油圧システムに分類されます。エンジンセグメントは、2022年のオイル状態監視市場において最大の収益シェアを獲得しました。自動車産業におけるエンジン性能向上のための研究開発努力の拡大が、エンジンサブセグメントの発展を担っています。意図しないエンジンの故障を防ぐには、潤滑油のレベルやエンジンオイルの劣化をチェックする必要があります。オイルや潤滑油の品質は、エンジンの生産性だけでなく、出力にも直接影響します。
サンプリングタイプの展望
サンプリングタイプにより、オイル状態監視市場はオンサイトサンプリングとオフサイトサンプリングに分類されます。オンサイトサンプリング分野は、2022年のオイル状態監視市場においてかなりの成長率を確保しました。オイルの状態は、分析のために潤滑油のサンプルを採取した場所で監視されます。これは「オンサイト」監視として知られています。この技術の主な利点は、リアルタイムで使用することができるため、劣化が起こる前に機械の故障を特定することが可能であることです。
エンドユーザーの展望
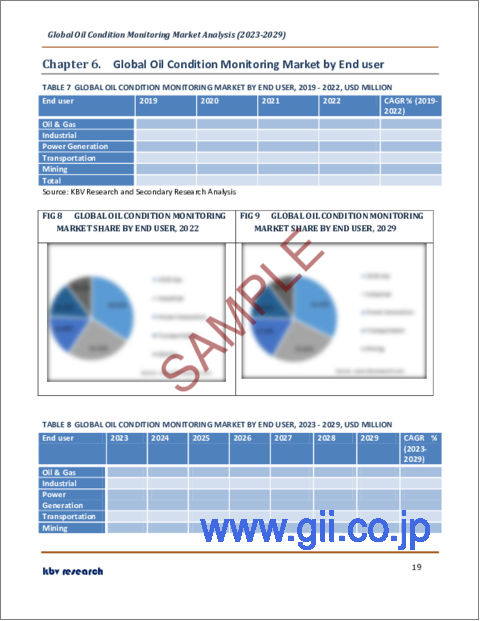
エンドユーザー別に見ると、オイル状態監視市場は、輸送、産業、石油・ガス、発電、鉱業に分けられます。2022年のオイル状態監視市場では、石油・ガス分野が最大の収益シェアを獲得しました。世界の一次燃料源として、石油・ガス部門は国際経済にとって重要です。精製所の有効性と効率を高めるために、この部門はオイル状態監視に多額の投資を行っています。
地域別の展望
地域別に見ると、オイル状態監視市場は、北米、欧州、アジア太平洋、LAMEAで分析されています。北米セグメントは、2022年のオイル状態監視市場において最も高い収益シェアを記録しました。自動車、鉱業、電力・発電産業において、予防保全のための最先端技術を導入する複数の企業が普及しているため、北米地域のオイル状態監視市場の予兆は良好です。
この市場調査レポートは、市場の主要な利害関係者の分析をカバーしています。本レポートに掲載されている主要企業プロファイルは、Parker Hannifin Corporation、General Electric Company、Bureau Veritas S.A.、Intertek Group PLC、SGS S.A.、Eaton Corporation PLC、BP p.l.c., TotalEnergies SE、Shell plc、Chevron Corporationです。
目次
第1章 市場範囲と調査手法
- 市場の定義
- 目的
- 市場範囲
- セグメンテーション
- 世界のオイル状態監視市場:製品タイプ別
- 世界のオイル状態監視市場:サンプリングタイプ別
- 世界のオイル状態監視市場:エンドユーザー別
- 世界のオイル状態監視市場:地域別
- 調査手法
第2章 市場概要
- イントロダクション
- 概要
- 市場構成とシナリオ
- 概要
- 市場に影響を与える主な要因
- 市場促進要因
- 市場抑制要因
第3章 オイル状態監視市場で導入された戦略
第4章 世界のオイル状態監視市場:製品タイプ別
- 世界のエンジン市場:地域別
- 世界のギアシステム市場:地域別
- 世界のタービン市場:地域別
- 世界の油圧システム市場:地域別
- 世界のコンプレッサー市場:地域別
第5章 世界のオイル状態監視市場:サンプリングタイプ別
- 世界のオフサイトサンプリング市場:地域別
- 世界のオンサイトサンプリング市場:地域別
第6章 世界のオイル状態監視市場:エンドユーザー別
- 世界の石油・ガス市場:地域別
- 世界の産業市場:地域別
- 世界の発電市場:地域別
- 世界の輸送市場:地域別
- 世界の鉱業市場:地域別
第7章 世界のオイル状態監視市場:地域別
- 北米
- 北米の市場:国別
- 米国
- カナダ
- メキシコ
- その他北米地域
- 北米の市場:国別
- 欧州
- 欧州の市場:国別
- ドイツ
- 英国
- フランス
- ロシア
- スペイン
- イタリア
- その他欧州地域
- 欧州の市場:国別
- アジア太平洋
- アジア太平洋の市場:国別
- 中国
- 日本
- インド
- 韓国
- シンガポール
- マレーシア
- その他アジア太平洋地域
- アジア太平洋の市場:国別
- ラテンアメリカ・中東・アフリカ
- ラテンアメリカ・中東・アフリカの市場:国別
- ブラジル
- アルゼンチン
- アラブ首長国連邦
- サウジアラビア
- 南アフリカ
- ナイジェリア
- その他ラテンアメリカ・中東・アフリカ地域
- ラテンアメリカ・中東・アフリカの市場:国別
第8章 企業プロファイル
- Parker Hannifin Corporation
- General Electric Company
- Bureau Veritas SA
- Intertek Group PLC
- SGS SA
- Eaton Corporation PLC
- BP pl.c
- TotalEnergies SE
- Shell plc
- Chevron Corporation
LIST OF TABLES
- TABLE 1 Global Oil Condition Monitoring Market, 2019 - 2022, USD Million
- TABLE 2 Global Oil Condition Monitoring Market, 2023 - 2029, USD Million
- TABLE 3 Global Oil Condition Monitoring Market by Product Type, 2019 - 2022, USD Million
- TABLE 4 Global Oil Condition Monitoring Market by Product Type, 2023 - 2029, USD Million
- TABLE 5 Global Engine Market by Region, 2019 - 2022, USD Million
- TABLE 6 Global Engine Market by Region, 2023 - 2029, USD Million
- TABLE 7 Global Gear Systems Market by Region, 2019 - 2022, USD Million
- TABLE 8 Global Gear Systems Market by Region, 2023 - 2029, USD Million
- TABLE 9 Global Turbine Market by Region, 2019 - 2022, USD Million
- TABLE 10 Global Turbine Market by Region, 2023 - 2029, USD Million
- TABLE 11 Global Hydraulic Systems Market by Region, 2019 - 2022, USD Million
- TABLE 12 Global Hydraulic Systems Market by Region, 2023 - 2029, USD Million
- TABLE 13 Global Compressor Market by Region, 2019 - 2022, USD Million
- TABLE 14 Global Compressor Market by Region, 2023 - 2029, USD Million
- TABLE 15 Global Oil Condition Monitoring Market by Sampling Type, 2019 - 2022, USD Million
- TABLE 16 Global Oil Condition Monitoring Market by Sampling Type, 2023 - 2029, USD Million
- TABLE 17 Global Off-site Sampling Market by Region, 2019 - 2022, USD Million
- TABLE 18 Global Off-site Sampling Market by Region, 2023 - 2029, USD Million
- TABLE 19 Global On-site Sampling Market by Region, 2019 - 2022, USD Million
- TABLE 20 Global On-site Sampling Market by Region, 2023 - 2029, USD Million
- TABLE 21 Global Oil Condition Monitoring Market by End user, 2019 - 2022, USD Million
- TABLE 22 Global Oil Condition Monitoring Market by End user, 2023 - 2029, USD Million
- TABLE 23 Global Oil & Gas Market by Region, 2019 - 2022, USD Million
- TABLE 24 Global Oil & Gas Market by Region, 2023 - 2029, USD Million
- TABLE 25 Global Industrial Market by Region, 2019 - 2022, USD Million
- TABLE 26 Global Industrial Market by Region, 2023 - 2029, USD Million
- TABLE 27 Global Power Generation Market by Region, 2019 - 2022, USD Million
- TABLE 28 Global Power Generation Market by Region, 2023 - 2029, USD Million
- TABLE 29 Global Transportation Market by Region, 2019 - 2022, USD Million
- TABLE 30 Global Transportation Market by Region, 2023 - 2029, USD Million
- TABLE 31 Global Mining Market by Region, 2019 - 2022, USD Million
- TABLE 32 Global Mining Market by Region, 2023 - 2029, USD Million
- TABLE 33 Global Oil Condition Monitoring Market by Region, 2019 - 2022, USD Million
- TABLE 34 Global Oil Condition Monitoring Market by Region, 2023 - 2029, USD Million
- TABLE 35 North America Oil Condition Monitoring Market, 2019 - 2022, USD Million
- TABLE 36 North America Oil Condition Monitoring Market, 2023 - 2029, USD Million
- TABLE 37 North America Oil Condition Monitoring Market by Product Type, 2019 - 2022, USD Million
- TABLE 38 North America Oil Condition Monitoring Market by Product Type, 2023 - 2029, USD Million
- TABLE 39 North America Engine Market by Country, 2019 - 2022, USD Million
- TABLE 40 North America Engine Market by Country, 2023 - 2029, USD Million
- TABLE 41 North America Gear Systems Market by Country, 2019 - 2022, USD Million
- TABLE 42 North America Gear Systems Market by Country, 2023 - 2029, USD Million
- TABLE 43 North America Turbine Market by Country, 2019 - 2022, USD Million
- TABLE 44 North America Turbine Market by Country, 2023 - 2029, USD Million
- TABLE 45 North America Hydraulic Systems Market by Country, 2019 - 2022, USD Million
- TABLE 46 North America Hydraulic Systems Market by Country, 2023 - 2029, USD Million
- TABLE 47 North America Compressor Market by Country, 2019 - 2022, USD Million
- TABLE 48 North America Compressor Market by Country, 2023 - 2029, USD Million
- TABLE 49 North America Oil Condition Monitoring Market by Sampling Type, 2019 - 2022, USD Million
- TABLE 50 North America Oil Condition Monitoring Market by Sampling Type, 2023 - 2029, USD Million
- TABLE 51 North America Off-site Sampling Market by Country, 2019 - 2022, USD Million
- TABLE 52 North America Off-site Sampling Market by Country, 2023 - 2029, USD Million
- TABLE 53 North America On-site Sampling Market by Country, 2019 - 2022, USD Million
- TABLE 54 North America On-site Sampling Market by Country, 2023 - 2029, USD Million
- TABLE 55 North America Oil Condition Monitoring Market by End user, 2019 - 2022, USD Million
- TABLE 56 North America Oil Condition Monitoring Market by End user, 2023 - 2029, USD Million
- TABLE 57 North America Oil & Gas Market by Country, 2019 - 2022, USD Million
- TABLE 58 North America Oil & Gas Market by Country, 2023 - 2029, USD Million
- TABLE 59 North America Industrial Market by Country, 2019 - 2022, USD Million
- TABLE 60 North America Industrial Market by Country, 2023 - 2029, USD Million
- TABLE 61 North America Power Generation Market by Country, 2019 - 2022, USD Million
- TABLE 62 North America Power Generation Market by Country, 2023 - 2029, USD Million
- TABLE 63 North America Transportation Market by Country, 2019 - 2022, USD Million
- TABLE 64 North America Transportation Market by Country, 2023 - 2029, USD Million
- TABLE 65 North America Mining Market by Country, 2019 - 2022, USD Million
- TABLE 66 North America Mining Market by Country, 2023 - 2029, USD Million
- TABLE 67 North America Oil Condition Monitoring Market by Country, 2019 - 2022, USD Million
- TABLE 68 North America Oil Condition Monitoring Market by Country, 2023 - 2029, USD Million
- TABLE 69 US Oil Condition Monitoring Market, 2019 - 2022, USD Million
- TABLE 70 US Oil Condition Monitoring Market, 2023 - 2029, USD Million
- TABLE 71 US Oil Condition Monitoring Market by Product Type, 2019 - 2022, USD Million
- TABLE 72 US Oil Condition Monitoring Market by Product Type, 2023 - 2029, USD Million
- TABLE 73 US Oil Condition Monitoring Market by Sampling Type, 2019 - 2022, USD Million
- TABLE 74 US Oil Condition Monitoring Market by Sampling Type, 2023 - 2029, USD Million
- TABLE 75 US Oil Condition Monitoring Market by End user, 2019 - 2022, USD Million
- TABLE 76 US Oil Condition Monitoring Market by End user, 2023 - 2029, USD Million
- TABLE 77 Canada Oil Condition Monitoring Market, 2019 - 2022, USD Million
- TABLE 78 Canada Oil Condition Monitoring Market, 2023 - 2029, USD Million
- TABLE 79 Canada Oil Condition Monitoring Market by Product Type, 2019 - 2022, USD Million
- TABLE 80 Canada Oil Condition Monitoring Market by Product Type, 2023 - 2029, USD Million
- TABLE 81 Canada Oil Condition Monitoring Market by Sampling Type, 2019 - 2022, USD Million
- TABLE 82 Canada Oil Condition Monitoring Market by Sampling Type, 2023 - 2029, USD Million
- TABLE 83 Canada Oil Condition Monitoring Market by End user, 2019 - 2022, USD Million
- TABLE 84 Canada Oil Condition Monitoring Market by End user, 2023 - 2029, USD Million
- TABLE 85 Mexico Oil Condition Monitoring Market, 2019 - 2022, USD Million
- TABLE 86 Mexico Oil Condition Monitoring Market, 2023 - 2029, USD Million
- TABLE 87 Mexico Oil Condition Monitoring Market by Product Type, 2019 - 2022, USD Million
- TABLE 88 Mexico Oil Condition Monitoring Market by Product Type, 2023 - 2029, USD Million
- TABLE 89 Mexico Oil Condition Monitoring Market by Sampling Type, 2019 - 2022, USD Million
- TABLE 90 Mexico Oil Condition Monitoring Market by Sampling Type, 2023 - 2029, USD Million
- TABLE 91 Mexico Oil Condition Monitoring Market by End user, 2019 - 2022, USD Million
- TABLE 92 Mexico Oil Condition Monitoring Market by End user, 2023 - 2029, USD Million
- TABLE 93 Rest of North America Oil Condition Monitoring Market, 2019 - 2022, USD Million
- TABLE 94 Rest of North America Oil Condition Monitoring Market, 2023 - 2029, USD Million
- TABLE 95 Rest of North America Oil Condition Monitoring Market by Product Type, 2019 - 2022, USD Million
- TABLE 96 Rest of North America Oil Condition Monitoring Market by Product Type, 2023 - 2029, USD Million
- TABLE 97 Rest of North America Oil Condition Monitoring Market by Sampling Type, 2019 - 2022, USD Million
- TABLE 98 Rest of North America Oil Condition Monitoring Market by Sampling Type, 2023 - 2029, USD Million
- TABLE 99 Rest of North America Oil Condition Monitoring Market by End user, 2019 - 2022, USD Million
- TABLE 100 Rest of North America Oil Condition Monitoring Market by End user, 2023 - 2029, USD Million
- TABLE 101 Europe Oil Condition Monitoring Market, 2019 - 2022, USD Million
- TABLE 102 Europe Oil Condition Monitoring Market, 2023 - 2029, USD Million
- TABLE 103 Europe Oil Condition Monitoring Market by Product Type, 2019 - 2022, USD Million
- TABLE 104 Europe Oil Condition Monitoring Market by Product Type, 2023 - 2029, USD Million
- TABLE 105 Europe Engine Market by Country, 2019 - 2022, USD Million
- TABLE 106 Europe Engine Market by Country, 2023 - 2029, USD Million
- TABLE 107 Europe Gear Systems Market by Country, 2019 - 2022, USD Million
- TABLE 108 Europe Gear Systems Market by Country, 2023 - 2029, USD Million
- TABLE 109 Europe Turbine Market by Country, 2019 - 2022, USD Million
- TABLE 110 Europe Turbine Market by Country, 2023 - 2029, USD Million
- TABLE 111 Europe Hydraulic Systems Market by Country, 2019 - 2022, USD Million
- TABLE 112 Europe Hydraulic Systems Market by Country, 2023 - 2029, USD Million
- TABLE 113 Europe Compressor Market by Country, 2019 - 2022, USD Million
- TABLE 114 Europe Compressor Market by Country, 2023 - 2029, USD Million
- TABLE 115 Europe Oil Condition Monitoring Market by Sampling Type, 2019 - 2022, USD Million
- TABLE 116 Europe Oil Condition Monitoring Market by Sampling Type, 2023 - 2029, USD Million
- TABLE 117 Europe Off-site Sampling Market by Country, 2019 - 2022, USD Million
- TABLE 118 Europe Off-site Sampling Market by Country, 2023 - 2029, USD Million
- TABLE 119 Europe On-site Sampling Market by Country, 2019 - 2022, USD Million
- TABLE 120 Europe On-site Sampling Market by Country, 2023 - 2029, USD Million
- TABLE 121 Europe Oil Condition Monitoring Market by End user, 2019 - 2022, USD Million
- TABLE 122 Europe Oil Condition Monitoring Market by End user, 2023 - 2029, USD Million
- TABLE 123 Europe Oil & Gas Market by Country, 2019 - 2022, USD Million
- TABLE 124 Europe Oil & Gas Market by Country, 2023 - 2029, USD Million
- TABLE 125 Europe Industrial Market by Country, 2019 - 2022, USD Million
- TABLE 126 Europe Industrial Market by Country, 2023 - 2029, USD Million
- TABLE 127 Europe Power Generation Market by Country, 2019 - 2022, USD Million
- TABLE 128 Europe Power Generation Market by Country, 2023 - 2029, USD Million
- TABLE 129 Europe Transportation Market by Country, 2019 - 2022, USD Million
- TABLE 130 Europe Transportation Market by Country, 2023 - 2029, USD Million
- TABLE 131 Europe Mining Market by Country, 2019 - 2022, USD Million
- TABLE 132 Europe Mining Market by Country, 2023 - 2029, USD Million
- TABLE 133 Europe Oil Condition Monitoring Market by Country, 2019 - 2022, USD Million
- TABLE 134 Europe Oil Condition Monitoring Market by Country, 2023 - 2029, USD Million
- TABLE 135 Germany Oil Condition Monitoring Market, 2019 - 2022, USD Million
- TABLE 136 Germany Oil Condition Monitoring Market, 2023 - 2029, USD Million
- TABLE 137 Germany Oil Condition Monitoring Market by Product Type, 2019 - 2022, USD Million
- TABLE 138 Germany Oil Condition Monitoring Market by Product Type, 2023 - 2029, USD Million
- TABLE 139 Germany Oil Condition Monitoring Market by Sampling Type, 2019 - 2022, USD Million
- TABLE 140 Germany Oil Condition Monitoring Market by Sampling Type, 2023 - 2029, USD Million
- TABLE 141 Germany Oil Condition Monitoring Market by End user, 2019 - 2022, USD Million
- TABLE 142 Germany Oil Condition Monitoring Market by End user, 2023 - 2029, USD Million
- TABLE 143 UK Oil Condition Monitoring Market, 2019 - 2022, USD Million
- TABLE 144 UK Oil Condition Monitoring Market, 2023 - 2029, USD Million
- TABLE 145 UK Oil Condition Monitoring Market by Product Type, 2019 - 2022, USD Million
- TABLE 146 UK Oil Condition Monitoring Market by Product Type, 2023 - 2029, USD Million
- TABLE 147 UK Oil Condition Monitoring Market by Sampling Type, 2019 - 2022, USD Million
- TABLE 148 UK Oil Condition Monitoring Market by Sampling Type, 2023 - 2029, USD Million
- TABLE 149 UK Oil Condition Monitoring Market by End user, 2019 - 2022, USD Million
- TABLE 150 UK Oil Condition Monitoring Market by End user, 2023 - 2029, USD Million
- TABLE 151 France Oil Condition Monitoring Market, 2019 - 2022, USD Million
- TABLE 152 France Oil Condition Monitoring Market, 2023 - 2029, USD Million
- TABLE 153 France Oil Condition Monitoring Market by Product Type, 2019 - 2022, USD Million
- TABLE 154 France Oil Condition Monitoring Market by Product Type, 2023 - 2029, USD Million
- TABLE 155 France Oil Condition Monitoring Market by Sampling Type, 2019 - 2022, USD Million
- TABLE 156 France Oil Condition Monitoring Market by Sampling Type, 2023 - 2029, USD Million
- TABLE 157 France Oil Condition Monitoring Market by End user, 2019 - 2022, USD Million
- TABLE 158 France Oil Condition Monitoring Market by End user, 2023 - 2029, USD Million
- TABLE 159 Russia Oil Condition Monitoring Market, 2019 - 2022, USD Million
- TABLE 160 Russia Oil Condition Monitoring Market, 2023 - 2029, USD Million
- TABLE 161 Russia Oil Condition Monitoring Market by Product Type, 2019 - 2022, USD Million
- TABLE 162 Russia Oil Condition Monitoring Market by Product Type, 2023 - 2029, USD Million
- TABLE 163 Russia Oil Condition Monitoring Market by Sampling Type, 2019 - 2022, USD Million
- TABLE 164 Russia Oil Condition Monitoring Market by Sampling Type, 2023 - 2029, USD Million
- TABLE 165 Russia Oil Condition Monitoring Market by End user, 2019 - 2022, USD Million
- TABLE 166 Russia Oil Condition Monitoring Market by End user, 2023 - 2029, USD Million
- TABLE 167 Spain Oil Condition Monitoring Market, 2019 - 2022, USD Million
- TABLE 168 Spain Oil Condition Monitoring Market, 2023 - 2029, USD Million
- TABLE 169 Spain Oil Condition Monitoring Market by Product Type, 2019 - 2022, USD Million
- TABLE 170 Spain Oil Condition Monitoring Market by Product Type, 2023 - 2029, USD Million
- TABLE 171 Spain Oil Condition Monitoring Market by Sampling Type, 2019 - 2022, USD Million
- TABLE 172 Spain Oil Condition Monitoring Market by Sampling Type, 2023 - 2029, USD Million
- TABLE 173 Spain Oil Condition Monitoring Market by End user, 2019 - 2022, USD Million
- TABLE 174 Spain Oil Condition Monitoring Market by End user, 2023 - 2029, USD Million
- TABLE 175 Italy Oil Condition Monitoring Market, 2019 - 2022, USD Million
- TABLE 176 Italy Oil Condition Monitoring Market, 2023 - 2029, USD Million
- TABLE 177 Italy Oil Condition Monitoring Market by Product Type, 2019 - 2022, USD Million
- TABLE 178 Italy Oil Condition Monitoring Market by Product Type, 2023 - 2029, USD Million
- TABLE 179 Italy Oil Condition Monitoring Market by Sampling Type, 2019 - 2022, USD Million
- TABLE 180 Italy Oil Condition Monitoring Market by Sampling Type, 2023 - 2029, USD Million
- TABLE 181 Italy Oil Condition Monitoring Market by End user, 2019 - 2022, USD Million
- TABLE 182 Italy Oil Condition Monitoring Market by End user, 2023 - 2029, USD Million
- TABLE 183 Rest of Europe Oil Condition Monitoring Market, 2019 - 2022, USD Million
- TABLE 184 Rest of Europe Oil Condition Monitoring Market, 2023 - 2029, USD Million
- TABLE 185 Rest of Europe Oil Condition Monitoring Market by Product Type, 2019 - 2022, USD Million
- TABLE 186 Rest of Europe Oil Condition Monitoring Market by Product Type, 2023 - 2029, USD Million
- TABLE 187 Rest of Europe Oil Condition Monitoring Market by Sampling Type, 2019 - 2022, USD Million
- TABLE 188 Rest of Europe Oil Condition Monitoring Market by Sampling Type, 2023 - 2029, USD Million
- TABLE 189 Rest of Europe Oil Condition Monitoring Market by End user, 2019 - 2022, USD Million
- TABLE 190 Rest of Europe Oil Condition Monitoring Market by End user, 2023 - 2029, USD Million
- TABLE 191 Asia Pacific Oil Condition Monitoring Market, 2019 - 2022, USD Million
- TABLE 192 Asia Pacific Oil Condition Monitoring Market, 2023 - 2029, USD Million
- TABLE 193 Asia Pacific Oil Condition Monitoring Market by Product Type, 2019 - 2022, USD Million
- TABLE 194 Asia Pacific Oil Condition Monitoring Market by Product Type, 2023 - 2029, USD Million
- TABLE 195 Asia Pacific Engine Market by Country, 2019 - 2022, USD Million
- TABLE 196 Asia Pacific Engine Market by Country, 2023 - 2029, USD Million
- TABLE 197 Asia Pacific Gear Systems Market by Country, 2019 - 2022, USD Million
- TABLE 198 Asia Pacific Gear Systems Market by Country, 2023 - 2029, USD Million
- TABLE 199 Asia Pacific Turbine Market by Country, 2019 - 2022, USD Million
- TABLE 200 Asia Pacific Turbine Market by Country, 2023 - 2029, USD Million
- TABLE 201 Asia Pacific Hydraulic Systems Market by Country, 2019 - 2022, USD Million
- TABLE 202 Asia Pacific Hydraulic Systems Market by Country, 2023 - 2029, USD Million
- TABLE 203 Asia Pacific Compressor Market by Country, 2019 - 2022, USD Million
- TABLE 204 Asia Pacific Compressor Market by Country, 2023 - 2029, USD Million
- TABLE 205 Asia Pacific Oil Condition Monitoring Market by Sampling Type, 2019 - 2022, USD Million
- TABLE 206 Asia Pacific Oil Condition Monitoring Market by Sampling Type, 2023 - 2029, USD Million
- TABLE 207 Asia Pacific Off-site Sampling Market by Country, 2019 - 2022, USD Million
- TABLE 208 Asia Pacific Off-site Sampling Market by Country, 2023 - 2029, USD Million
- TABLE 209 Asia Pacific On-site Sampling Market by Country, 2019 - 2022, USD Million
- TABLE 210 Asia Pacific On-site Sampling Market by Country, 2023 - 2029, USD Million
- TABLE 211 Asia Pacific Oil Condition Monitoring Market by End user, 2019 - 2022, USD Million
- TABLE 212 Asia Pacific Oil Condition Monitoring Market by End user, 2023 - 2029, USD Million
- TABLE 213 Asia Pacific Oil & Gas Market by Country, 2019 - 2022, USD Million
- TABLE 214 Asia Pacific Oil & Gas Market by Country, 2023 - 2029, USD Million
- TABLE 215 Asia Pacific Industrial Market by Country, 2019 - 2022, USD Million
- TABLE 216 Asia Pacific Industrial Market by Country, 2023 - 2029, USD Million
- TABLE 217 Asia Pacific Power Generation Market by Country, 2019 - 2022, USD Million
- TABLE 218 Asia Pacific Power Generation Market by Country, 2023 - 2029, USD Million
- TABLE 219 Asia Pacific Transportation Market by Country, 2019 - 2022, USD Million
- TABLE 220 Asia Pacific Transportation Market by Country, 2023 - 2029, USD Million
- TABLE 221 Asia Pacific Mining Market by Country, 2019 - 2022, USD Million
- TABLE 222 Asia Pacific Mining Market by Country, 2023 - 2029, USD Million
- TABLE 223 Asia Pacific Oil Condition Monitoring Market by Country, 2019 - 2022, USD Million
- TABLE 224 Asia Pacific Oil Condition Monitoring Market by Country, 2023 - 2029, USD Million
- TABLE 225 China Oil Condition Monitoring Market, 2019 - 2022, USD Million
- TABLE 226 China Oil Condition Monitoring Market, 2023 - 2029, USD Million
- TABLE 227 China Oil Condition Monitoring Market by Product Type, 2019 - 2022, USD Million
- TABLE 228 China Oil Condition Monitoring Market by Product Type, 2023 - 2029, USD Million
- TABLE 229 China Oil Condition Monitoring Market by Sampling Type, 2019 - 2022, USD Million
- TABLE 230 China Oil Condition Monitoring Market by Sampling Type, 2023 - 2029, USD Million
- TABLE 231 China Oil Condition Monitoring Market by End user, 2019 - 2022, USD Million
- TABLE 232 China Oil Condition Monitoring Market by End user, 2023 - 2029, USD Million
- TABLE 233 Japan Oil Condition Monitoring Market, 2019 - 2022, USD Million
- TABLE 234 Japan Oil Condition Monitoring Market, 2023 - 2029, USD Million
- TABLE 235 Japan Oil Condition Monitoring Market by Product Type, 2019 - 2022, USD Million
- TABLE 236 Japan Oil Condition Monitoring Market by Product Type, 2023 - 2029, USD Million
- TABLE 237 Japan Oil Condition Monitoring Market by Sampling Type, 2019 - 2022, USD Million
- TABLE 238 Japan Oil Condition Monitoring Market by Sampling Type, 2023 - 2029, USD Million
- TABLE 239 Japan Oil Condition Monitoring Market by End user, 2019 - 2022, USD Million
- TABLE 240 Japan Oil Condition Monitoring Market by End user, 2023 - 2029, USD Million
- TABLE 241 India Oil Condition Monitoring Market, 2019 - 2022, USD Million
- TABLE 242 India Oil Condition Monitoring Market, 2023 - 2029, USD Million
- TABLE 243 India Oil Condition Monitoring Market by Product Type, 2019 - 2022, USD Million
- TABLE 244 India Oil Condition Monitoring Market by Product Type, 2023 - 2029, USD Million
- TABLE 245 India Oil Condition Monitoring Market by Sampling Type, 2019 - 2022, USD Million
- TABLE 246 India Oil Condition Monitoring Market by Sampling Type, 2023 - 2029, USD Million
- TABLE 247 India Oil Condition Monitoring Market by End user, 2019 - 2022, USD Million
- TABLE 248 India Oil Condition Monitoring Market by End user, 2023 - 2029, USD Million
- TABLE 249 South Korea Oil Condition Monitoring Market, 2019 - 2022, USD Million
- TABLE 250 South Korea Oil Condition Monitoring Market, 2023 - 2029, USD Million
- TABLE 251 South Korea Oil Condition Monitoring Market by Product Type, 2019 - 2022, USD Million
- TABLE 252 South Korea Oil Condition Monitoring Market by Product Type, 2023 - 2029, USD Million
- TABLE 253 South Korea Oil Condition Monitoring Market by Sampling Type, 2019 - 2022, USD Million
- TABLE 254 South Korea Oil Condition Monitoring Market by Sampling Type, 2023 - 2029, USD Million
- TABLE 255 South Korea Oil Condition Monitoring Market by End user, 2019 - 2022, USD Million
- TABLE 256 South Korea Oil Condition Monitoring Market by End user, 2023 - 2029, USD Million
- TABLE 257 Singapore Oil Condition Monitoring Market, 2019 - 2022, USD Million
- TABLE 258 Singapore Oil Condition Monitoring Market, 2023 - 2029, USD Million
- TABLE 259 Singapore Oil Condition Monitoring Market by Product Type, 2019 - 2022, USD Million
- TABLE 260 Singapore Oil Condition Monitoring Market by Product Type, 2023 - 2029, USD Million
- TABLE 261 Singapore Oil Condition Monitoring Market by Sampling Type, 2019 - 2022, USD Million
- TABLE 262 Singapore Oil Condition Monitoring Market by Sampling Type, 2023 - 2029, USD Million
- TABLE 263 Singapore Oil Condition Monitoring Market by End user, 2019 - 2022, USD Million
- TABLE 264 Singapore Oil Condition Monitoring Market by End user, 2023 - 2029, USD Million
- TABLE 265 Malaysia Oil Condition Monitoring Market, 2019 - 2022, USD Million
- TABLE 266 Malaysia Oil Condition Monitoring Market, 2023 - 2029, USD Million
- TABLE 267 Malaysia Oil Condition Monitoring Market by Product Type, 2019 - 2022, USD Million
- TABLE 268 Malaysia Oil Condition Monitoring Market by Product Type, 2023 - 2029, USD Million
- TABLE 269 Malaysia Oil Condition Monitoring Market by Sampling Type, 2019 - 2022, USD Million
- TABLE 270 Malaysia Oil Condition Monitoring Market by Sampling Type, 2023 - 2029, USD Million
- TABLE 271 Malaysia Oil Condition Monitoring Market by End user, 2019 - 2022, USD Million
- TABLE 272 Malaysia Oil Condition Monitoring Market by End user, 2023 - 2029, USD Million
- TABLE 273 Rest of Asia Pacific Oil Condition Monitoring Market, 2019 - 2022, USD Million
- TABLE 274 Rest of Asia Pacific Oil Condition Monitoring Market, 2023 - 2029, USD Million
- TABLE 275 Rest of Asia Pacific Oil Condition Monitoring Market by Product Type, 2019 - 2022, USD Million
- TABLE 276 Rest of Asia Pacific Oil Condition Monitoring Market by Product Type, 2023 - 2029, USD Million
- TABLE 277 Rest of Asia Pacific Oil Condition Monitoring Market by Sampling Type, 2019 - 2022, USD Million
- TABLE 278 Rest of Asia Pacific Oil Condition Monitoring Market by Sampling Type, 2023 - 2029, USD Million
- TABLE 279 Rest of Asia Pacific Oil Condition Monitoring Market by End user, 2019 - 2022, USD Million
- TABLE 280 Rest of Asia Pacific Oil Condition Monitoring Market by End user, 2023 - 2029, USD Million
- TABLE 281 LAMEA Oil Condition Monitoring Market, 2019 - 2022, USD Million
- TABLE 282 LAMEA Oil Condition Monitoring Market, 2023 - 2029, USD Million
- TABLE 283 LAMEA Oil Condition Monitoring Market by Product Type, 2019 - 2022, USD Million
- TABLE 284 LAMEA Oil Condition Monitoring Market by Product Type, 2023 - 2029, USD Million
- TABLE 285 LAMEA Engine Market by Country, 2019 - 2022, USD Million
- TABLE 286 LAMEA Engine Market by Country, 2023 - 2029, USD Million
- TABLE 287 LAMEA Gear Systems Market by Country, 2019 - 2022, USD Million
- TABLE 288 LAMEA Gear Systems Market by Country, 2023 - 2029, USD Million
- TABLE 289 LAMEA Turbine Market by Country, 2019 - 2022, USD Million
- TABLE 290 LAMEA Turbine Market by Country, 2023 - 2029, USD Million
- TABLE 291 LAMEA Hydraulic Systems Market by Country, 2019 - 2022, USD Million
- TABLE 292 LAMEA Hydraulic Systems Market by Country, 2023 - 2029, USD Million
- TABLE 293 LAMEA Compressor Market by Country, 2019 - 2022, USD Million
- TABLE 294 LAMEA Compressor Market by Country, 2023 - 2029, USD Million
- TABLE 295 LAMEA Oil Condition Monitoring Market by Sampling Type, 2019 - 2022, USD Million
- TABLE 296 LAMEA Oil Condition Monitoring Market by Sampling Type, 2023 - 2029, USD Million
- TABLE 297 LAMEA Off-site Sampling Market by Country, 2019 - 2022, USD Million
- TABLE 298 LAMEA Off-site Sampling Market by Country, 2023 - 2029, USD Million
- TABLE 299 LAMEA On-site Sampling Market by Country, 2019 - 2022, USD Million
- TABLE 300 LAMEA On-site Sampling Market by Country, 2023 - 2029, USD Million
- TABLE 301 LAMEA Oil Condition Monitoring Market by End user, 2019 - 2022, USD Million
- TABLE 302 LAMEA Oil Condition Monitoring Market by End user, 2023 - 2029, USD Million
- TABLE 303 LAMEA Oil & Gas Market by Country, 2019 - 2022, USD Million
- TABLE 304 LAMEA Oil & Gas Market by Country, 2023 - 2029, USD Million
- TABLE 305 LAMEA Industrial Market by Country, 2019 - 2022, USD Million
- TABLE 306 LAMEA Industrial Market by Country, 2023 - 2029, USD Million
- TABLE 307 LAMEA Power Generation Market by Country, 2019 - 2022, USD Million
- TABLE 308 LAMEA Power Generation Market by Country, 2023 - 2029, USD Million
- TABLE 309 LAMEA Transportation Market by Country, 2019 - 2022, USD Million
- TABLE 310 LAMEA Transportation Market by Country, 2023 - 2029, USD Million
- TABLE 311 LAMEA Mining Market by Country, 2019 - 2022, USD Million
- TABLE 312 LAMEA Mining Market by Country, 2023 - 2029, USD Million
- TABLE 313 LAMEA Oil Condition Monitoring Market by Country, 2019 - 2022, USD Million
- TABLE 314 LAMEA Oil Condition Monitoring Market by Country, 2023 - 2029, USD Million
- TABLE 315 Brazil Oil Condition Monitoring Market, 2019 - 2022, USD Million
- TABLE 316 Brazil Oil Condition Monitoring Market, 2023 - 2029, USD Million
- TABLE 317 Brazil Oil Condition Monitoring Market by Product Type, 2019 - 2022, USD Million
- TABLE 318 Brazil Oil Condition Monitoring Market by Product Type, 2023 - 2029, USD Million
- TABLE 319 Brazil Oil Condition Monitoring Market by Sampling Type, 2019 - 2022, USD Million
- TABLE 320 Brazil Oil Condition Monitoring Market by Sampling Type, 2023 - 2029, USD Million
- TABLE 321 Brazil Oil Condition Monitoring Market by End user, 2019 - 2022, USD Million
- TABLE 322 Brazil Oil Condition Monitoring Market by End user, 2023 - 2029, USD Million
- TABLE 323 Argentina Oil Condition Monitoring Market, 2019 - 2022, USD Million
- TABLE 324 Argentina Oil Condition Monitoring Market, 2023 - 2029, USD Million
- TABLE 325 Argentina Oil Condition Monitoring Market by Product Type, 2019 - 2022, USD Million
- TABLE 326 Argentina Oil Condition Monitoring Market by Product Type, 2023 - 2029, USD Million
- TABLE 327 Argentina Oil Condition Monitoring Market by Sampling Type, 2019 - 2022, USD Million
- TABLE 328 Argentina Oil Condition Monitoring Market by Sampling Type, 2023 - 2029, USD Million
- TABLE 329 Argentina Oil Condition Monitoring Market by End user, 2019 - 2022, USD Million
- TABLE 330 Argentina Oil Condition Monitoring Market by End user, 2023 - 2029, USD Million
- TABLE 331 UAE Oil Condition Monitoring Market, 2019 - 2022, USD Million
- TABLE 332 UAE Oil Condition Monitoring Market, 2023 - 2029, USD Million
- TABLE 333 UAE Oil Condition Monitoring Market by Product Type, 2019 - 2022, USD Million
- TABLE 334 UAE Oil Condition Monitoring Market by Product Type, 2023 - 2029, USD Million
- TABLE 335 UAE Oil Condition Monitoring Market by Sampling Type, 2019 - 2022, USD Million
- TABLE 336 UAE Oil Condition Monitoring Market by Sampling Type, 2023 - 2029, USD Million
- TABLE 337 UAE Oil Condition Monitoring Market by End user, 2019 - 2022, USD Million
- TABLE 338 UAE Oil Condition Monitoring Market by End user, 2023 - 2029, USD Million
- TABLE 339 Saudi Arabia Oil Condition Monitoring Market, 2019 - 2022, USD Million
- TABLE 340 Saudi Arabia Oil Condition Monitoring Market, 2023 - 2029, USD Million
- TABLE 341 Saudi Arabia Oil Condition Monitoring Market by Product Type, 2019 - 2022, USD Million
- TABLE 342 Saudi Arabia Oil Condition Monitoring Market by Product Type, 2023 - 2029, USD Million
- TABLE 343 Saudi Arabia Oil Condition Monitoring Market by Sampling Type, 2019 - 2022, USD Million
- TABLE 344 Saudi Arabia Oil Condition Monitoring Market by Sampling Type, 2023 - 2029, USD Million
- TABLE 345 Saudi Arabia Oil Condition Monitoring Market by End user, 2019 - 2022, USD Million
- TABLE 346 Saudi Arabia Oil Condition Monitoring Market by End user, 2023 - 2029, USD Million
- TABLE 347 South Africa Oil Condition Monitoring Market, 2019 - 2022, USD Million
- TABLE 348 South Africa Oil Condition Monitoring Market, 2023 - 2029, USD Million
- TABLE 349 South Africa Oil Condition Monitoring Market by Product Type, 2019 - 2022, USD Million
- TABLE 350 South Africa Oil Condition Monitoring Market by Product Type, 2023 - 2029, USD Million
- TABLE 351 South Africa Oil Condition Monitoring Market by Sampling Type, 2019 - 2022, USD Million
- TABLE 352 South Africa Oil Condition Monitoring Market by Sampling Type, 2023 - 2029, USD Million
- TABLE 353 South Africa Oil Condition Monitoring Market by End user, 2019 - 2022, USD Million
- TABLE 354 South Africa Oil Condition Monitoring Market by End user, 2023 - 2029, USD Million
- TABLE 355 Nigeria Oil Condition Monitoring Market, 2019 - 2022, USD Million
- TABLE 356 Nigeria Oil Condition Monitoring Market, 2023 - 2029, USD Million
- TABLE 357 Nigeria Oil Condition Monitoring Market by Product Type, 2019 - 2022, USD Million
- TABLE 358 Nigeria Oil Condition Monitoring Market by Product Type, 2023 - 2029, USD Million
- TABLE 359 Nigeria Oil Condition Monitoring Market by Sampling Type, 2019 - 2022, USD Million
- TABLE 360 Nigeria Oil Condition Monitoring Market by Sampling Type, 2023 - 2029, USD Million
- TABLE 361 Nigeria Oil Condition Monitoring Market by End user, 2019 - 2022, USD Million
- TABLE 362 Nigeria Oil Condition Monitoring Market by End user, 2023 - 2029, USD Million
- TABLE 363 Rest of LAMEA Oil Condition Monitoring Market, 2019 - 2022, USD Million
- TABLE 364 Rest of LAMEA Oil Condition Monitoring Market, 2023 - 2029, USD Million
- TABLE 365 Rest of LAMEA Oil Condition Monitoring Market by Product Type, 2019 - 2022, USD Million
- TABLE 366 Rest of LAMEA Oil Condition Monitoring Market by Product Type, 2023 - 2029, USD Million
- TABLE 367 Rest of LAMEA Oil Condition Monitoring Market by Sampling Type, 2019 - 2022, USD Million
- TABLE 368 Rest of LAMEA Oil Condition Monitoring Market by Sampling Type, 2023 - 2029, USD Million
- TABLE 369 Rest of LAMEA Oil Condition Monitoring Market by End user, 2019 - 2022, USD Million
- TABLE 370 Rest of LAMEA Oil Condition Monitoring Market by End user, 2023 - 2029, USD Million
- TABLE 371 Key Information - Parker Hannifin Corporation
- TABLE 372 KEY INFORMATION - General Electric Company
- TABLE 373 Key Information - Bureau Veritas S.A.
- TABLE 374 Key Information - Intertek Group PLC
- TABLE 375 Key Information - SGS S.A.
- TABLE 376 key information - Eaton Corporation PLC
- TABLE 377 Key Information - BP p.l.c.
- TABLE 378 Key Information - TotalEnergies SE
- TABLE 379 Key Information - Shell plc
- TABLE 380 Key Information - Chevron Corporation
List of Figures
- FIG 1 Methodology for the research
- FIG 2 Global Oil Condition Monitoring Market share by Product Type, 2022
- FIG 3 Global Oil Condition Monitoring Market share by Product Type, 2029
- FIG 4 Global Oil Condition Monitoring Market by Product Type, 2019 - 2029, USD Million
- FIG 5 Global Oil Condition Monitoring Market share by Sampling Type, 2022
- FIG 6 Global Oil Condition Monitoring Market share by Sampling Type, 2029
- FIG 7 Global Oil Condition Monitoring Market by Sampling Type, 2019 - 2029, USD Million
- FIG 8 Global Oil Condition Monitoring Market share by End user, 2022
- FIG 9 Global Oil Condition Monitoring Market share by End user, 2029
- FIG 10 Global Oil Condition Monitoring Market by End user, 2019 - 2029, USD Million
- FIG 11 Global Oil Condition Monitoring Market share by Region, 2022
- FIG 12 Global Oil Condition Monitoring Market share by Region, 2029
- FIG 13 Global Oil Condition Monitoring Market by Region, 2019 - 2029, USD Million
- FIG 14 Recent strategies and developments: Parker Hannifin Corporation
- FIG 15 Recent strategies and developments: General Electric Company
- FIG 16 Swot analysis: General electric (GE) Co.
- FIG 17 SWOT Analysis: Eaton Corporation PLC
The Global Oil Condition Monitoring Market size is expected to reach $1.2 Billion by 2029, rising at a market growth of 7.7% CAGR during the forecast period.
Oil condition monitoring is a well-known predictive maintenance technology. It involves calculating, monitoring, and examining the oil and lubricant of machinery and equipment for any contamination. A thorough understanding of the state and status of machinery and equipment can be gained from meticulously monitoring oil conditions.
The need to maximize asset availability, save maintenance costs, and prevent unplanned machine downtimes has resulted in a considerable rise in the usage of predictive maintenance procedures over the past few years across various industries. Oil condition monitoring (OCM) uses data management systems to prevent catastrophic maintenance occurrences.
Monitoring oil conditions can assist in identifying patterns in wear and tear as well as any changes in the physical characteristics of fuels, lubricants, and coolants. For example, oil may lose its ability to lubricate due to contamination with lubricants, fuels, acids, or coolants, which may result in equipment damage. Therefore, to preserve the functionality of crucial equipment, businesses are increasingly using oil condition monitoring.
The expanding automotive sector, as well as the rising demand for preventative maintenance, are the primary forces propelling the oil condition monitoring market. As more people throughout the world want their cars, the automotive sector is expanding at a breakneck speed all over the world. During the period under consideration, this will likely act as a primary driver of demand for oil condition monitoring.
COVID-19 Impact Analysis
Due to growing market competitiveness over the past ten years, the oil condition monitoring market has experienced unheard-of growth. As a result, machine condition monitoring has become the most popular method of predictive maintenance, increasing demand for it. However, COVID-19 severely impacted the sector, causing supply and demand to plummet simultaneously. The pandemic slowed down the market's expansion.
Market Growth Factors
Increasing Demand for Affordable Solutions to Preserve the Health of Machinery
The demand for monitoring solutions for oil conditions is anticipated to increase as just-in-time inventories and lean manufacturing techniques become more crucial, with a greater emphasis on product quality, especially in the process industries. Predictive maintenance is a technique that has recently come into favor among asset managers and industrial operators. The use of predictive maintenance can assist businesses in assessing the condition of their assets and forecasting when a certain system or component is likely to break down and require replacement or repair.
Growing Importance of Improving Operational Life of Important Assets
When it pertains to an asset's lifecycle, businesses anticipate it to carry out its intended purpose as effectively and for as many years as possible. Design, operation, installation, and decommissioning are all parts of an asset's lifecycle in a system. Asset performance and asset health are influenced by various factors. For example, the lubricants in the machinery must constantly operate in hazardous situations and are subject to continuous high pressures. With adequate oil condition monitoring services, the cost of replacing the equipment can be reduced by as much as half. As a result, many businesses are choosing real-time oil condition monitoring services to reduce equipment failure and further increase the operating life of such equipment. Therefore, the expansion of the market is being propelled by these factors.
Market Restraining Factors
Challenges In Integration with Already-Existing Systems
To achieve operational excellence in their production processes, several businesses heavily utilize on-site oil condition monitoring systems, including portable kits, sensors, and on-site laboratories. To operate these systems correctly, a certain amount of knowledge is needed. The lack of competent workers in these regions is a worry because some systems are placed in isolated or difficult-to-reach areas. The widespread resistance to alteration in end-user verticals is another significant issue that the industry actors must address. Potential customers may be reluctant to buy due to issues including the scarcity of qualified personnel and concerns about dependability. Therefore, all these elements are hampering the market's growth in the coming years.
Product Type Outlook
On the basis of product type, the oil condition monitoring market is classified into turbine, compressor, engine, gear systems, and hydraulic systems. The engine segment acquired the largest revenue share in the oil condition monitoring market in 2022. The expansion of R&D efforts to enhance engine performance in the automotive industry is responsible for developing the engine sub-segment. To prevent unintended engine breakdown, the level of lubricant and engine oil degradation must be checked. Oil and lubricant quality directly affect an engine's productivity as well as output.
Sampling Type Outlook
Based on sampling type, the oil condition monitoring market is characterized into on-site sampling and off-site sampling. The on-site sampling segment procured a considerable growth rate in the oil condition monitoring market in 2022. The oil's condition is monitored at the location where a sample of the lubricant was taken for analysis. This is known as "on-site" monitoring. The main benefit of this technology is that it may be used in real-time, making it possible to identify mechanical failure before deterioration has occurred.
End User Outlook
By end user, the oil condition monitoring market is divided into transportation, industrial, oil & gas, power generation, and mining. The oil & gas segment garnered maximum revenue share in the oil condition monitoring market in 2022. As the primary source of fuel for the world, the oil and gas sector is important to the international economy. To boost the effectiveness and efficiency of their refineries, this sector is investing heavily in oil condition monitoring.
Regional Outlook
Region wise, the oil condition monitoring market is analyzed across North America, Europe, Asia Pacific, and LAMEA. The North America segment recorded the highest revenue share in the oil condition monitoring market in 2022. Due to the prevalence of several businesses implementing cutting-edge technology for preventive maintenance in the automotive, mining, and power & generation industries, the oil condition monitoring market prognosis in the North America region is favorable.
The market research report covers the analysis of key stakeholders of the market. Key companies profiled in the report include Parker Hannifin Corporation, General Electric Company, Bureau Veritas S.A., Intertek Group PLC, SGS S.A., Eaton Corporation PLC, BP p.l.c., TotalEnergies SE, Shell plc, and Chevron Corporation
Scope of the Study
Market Segments covered in the Report:
By Product Type
- Engine
- Gear Systems
- Turbine
- Hydraulic Systems
- Compressor
By Sampling Type
- Off-site Sampling
- On-site Sampling
By End User
- Oil & Gas
- Industrial
- Power Generation
- Transportation
- Mining
By Geography
- North America
- US
- Canada
- Mexico
- Rest of North America
- Europe
- Germany
- UK
- France
- Russia
- Spain
- Italy
- Rest of Europe
- Asia Pacific
- China
- Japan
- India
- South Korea
- Singapore
- Malaysia
- Rest of Asia Pacific
- LAMEA
- Brazil
- Argentina
- UAE
- Saudi Arabia
- South Africa
- Nigeria
- Rest of LAMEA
Companies Profiled
- Parker Hannifin Corporation
- General Electric Company
- Bureau Veritas S.A.
- Intertek Group PLC
- SGS S.A.
- Eaton Corporation PLC
- BP p.l.c.
- TotalEnergies SE
- Shell plc
- Chevron Corporation
Unique Offerings from KBV Research
- Exhaustive coverage
- Highest number of market tables and figures
- Subscription based model available
- Guaranteed best price
- Assured post sales research support with 10% customization free
Table of Contents
Chapter 1. Market Scope & Methodology
- 1.1 Market Definition
- 1.2 Objectives
- 1.3 Market Scope
- 1.4 Segmentation
- 1.4.1 Global Oil Condition Monitoring Market, by Product Type
- 1.4.2 Global Oil Condition Monitoring Market, by Sampling Type
- 1.4.3 Global Oil Condition Monitoring Market, by End User
- 1.4.4 Global Oil Condition Monitoring Market, by Geography
- 1.5 Methodology for the research
Chapter 2. Market Overview
- 2.1 Introduction
- 2.1.1 Overview
- 2.1.1.1 Market Composition & Scenario
- 2.1.1 Overview
- 2.2 Key Factors Impacting the Market
- 2.2.1 Market Drivers
- 2.2.2 Market Restraints
Chapter 3. Strategies deployed in Oil Condition Monitoring Market
Chapter 4. Global Oil Condition Monitoring Market by Product Type
- 4.1 Global Engine Market by Region
- 4.2 Global Gear Systems Market by Region
- 4.3 Global Turbine Market by Region
- 4.4 Global Hydraulic Systems Market by Region
- 4.5 Global Compressor Market by Region
Chapter 5. Global Oil Condition Monitoring Market by Sampling Type
- 5.1 Global Off-site Sampling Market by Region
- 5.2 Global On-site Sampling Market by Region
Chapter 6. Global Oil Condition Monitoring Market by End user
- 6.1 Global Oil & Gas Market by Region
- 6.2 Global Industrial Market by Region
- 6.3 Global Power Generation Market by Region
- 6.4 Global Transportation Market by Region
- 6.5 Global Mining Market by Region
Chapter 7. Global Oil Condition Monitoring Market by Region
- 7.1 North America Oil Condition Monitoring Market
- 7.1.1 North America Oil Condition Monitoring Market by Product Type
- 7.1.1.1 North America Engine Market by Country
- 7.1.1.2 North America Gear Systems Market by Country
- 7.1.1.3 North America Turbine Market by Country
- 7.1.1.4 North America Hydraulic Systems Market by Country
- 7.1.1.5 North America Compressor Market by Country
- 7.1.2 North America Oil Condition Monitoring Market by Sampling Type
- 7.1.2.1 North America Off-site Sampling Market by Country
- 7.1.2.2 North America On-site Sampling Market by Country
- 7.1.3 North America Oil Condition Monitoring Market by End user
- 7.1.3.1 North America Oil & Gas Market by Country
- 7.1.3.2 North America Industrial Market by Country
- 7.1.3.3 North America Power Generation Market by Country
- 7.1.3.4 North America Transportation Market by Country
- 7.1.3.5 North America Mining Market by Country
- 7.1.4 North America Oil Condition Monitoring Market by Country
- 7.1.4.1 US Oil Condition Monitoring Market
- 7.1.4.1.1 US Oil Condition Monitoring Market by Product Type
- 7.1.4.1.2 US Oil Condition Monitoring Market by Sampling Type
- 7.1.4.1.3 US Oil Condition Monitoring Market by End user
- 7.1.4.2 Canada Oil Condition Monitoring Market
- 7.1.4.2.1 Canada Oil Condition Monitoring Market by Product Type
- 7.1.4.2.2 Canada Oil Condition Monitoring Market by Sampling Type
- 7.1.4.2.3 Canada Oil Condition Monitoring Market by End user
- 7.1.4.3 Mexico Oil Condition Monitoring Market
- 7.1.4.3.1 Mexico Oil Condition Monitoring Market by Product Type
- 7.1.4.3.2 Mexico Oil Condition Monitoring Market by Sampling Type
- 7.1.4.3.3 Mexico Oil Condition Monitoring Market by End user
- 7.1.4.4 Rest of North America Oil Condition Monitoring Market
- 7.1.4.4.1 Rest of North America Oil Condition Monitoring Market by Product Type
- 7.1.4.4.2 Rest of North America Oil Condition Monitoring Market by Sampling Type
- 7.1.4.4.3 Rest of North America Oil Condition Monitoring Market by End user
- 7.1.4.1 US Oil Condition Monitoring Market
- 7.1.1 North America Oil Condition Monitoring Market by Product Type
- 7.2 Europe Oil Condition Monitoring Market
- 7.2.1 Europe Oil Condition Monitoring Market by Product Type
- 7.2.1.1 Europe Engine Market by Country
- 7.2.1.2 Europe Gear Systems Market by Country
- 7.2.1.3 Europe Turbine Market by Country
- 7.2.1.4 Europe Hydraulic Systems Market by Country
- 7.2.1.5 Europe Compressor Market by Country
- 7.2.2 Europe Oil Condition Monitoring Market by Sampling Type
- 7.2.2.1 Europe Off-site Sampling Market by Country
- 7.2.2.2 Europe On-site Sampling Market by Country
- 7.2.3 Europe Oil Condition Monitoring Market by End user
- 7.2.3.1 Europe Oil & Gas Market by Country
- 7.2.3.2 Europe Industrial Market by Country
- 7.2.3.3 Europe Power Generation Market by Country
- 7.2.3.4 Europe Transportation Market by Country
- 7.2.3.5 Europe Mining Market by Country
- 7.2.4 Europe Oil Condition Monitoring Market by Country
- 7.2.4.1 Germany Oil Condition Monitoring Market
- 7.2.4.1.1 Germany Oil Condition Monitoring Market by Product Type
- 7.2.4.1.2 Germany Oil Condition Monitoring Market by Sampling Type
- 7.2.4.1.3 Germany Oil Condition Monitoring Market by End user
- 7.2.4.2 UK Oil Condition Monitoring Market
- 7.2.4.2.1 UK Oil Condition Monitoring Market by Product Type
- 7.2.4.2.2 UK Oil Condition Monitoring Market by Sampling Type
- 7.2.4.2.3 UK Oil Condition Monitoring Market by End user
- 7.2.4.3 France Oil Condition Monitoring Market
- 7.2.4.3.1 France Oil Condition Monitoring Market by Product Type
- 7.2.4.3.2 France Oil Condition Monitoring Market by Sampling Type
- 7.2.4.3.3 France Oil Condition Monitoring Market by End user
- 7.2.4.4 Russia Oil Condition Monitoring Market
- 7.2.4.4.1 Russia Oil Condition Monitoring Market by Product Type
- 7.2.4.4.2 Russia Oil Condition Monitoring Market by Sampling Type
- 7.2.4.4.3 Russia Oil Condition Monitoring Market by End user
- 7.2.4.5 Spain Oil Condition Monitoring Market
- 7.2.4.5.1 Spain Oil Condition Monitoring Market by Product Type
- 7.2.4.5.2 Spain Oil Condition Monitoring Market by Sampling Type
- 7.2.4.5.3 Spain Oil Condition Monitoring Market by End user
- 7.2.4.6 Italy Oil Condition Monitoring Market
- 7.2.4.6.1 Italy Oil Condition Monitoring Market by Product Type
- 7.2.4.6.2 Italy Oil Condition Monitoring Market by Sampling Type
- 7.2.4.6.3 Italy Oil Condition Monitoring Market by End user
- 7.2.4.7 Rest of Europe Oil Condition Monitoring Market
- 7.2.4.7.1 Rest of Europe Oil Condition Monitoring Market by Product Type
- 7.2.4.7.2 Rest of Europe Oil Condition Monitoring Market by Sampling Type
- 7.2.4.7.3 Rest of Europe Oil Condition Monitoring Market by End user
- 7.2.4.1 Germany Oil Condition Monitoring Market
- 7.2.1 Europe Oil Condition Monitoring Market by Product Type
- 7.3 Asia Pacific Oil Condition Monitoring Market
- 7.3.1 Asia Pacific Oil Condition Monitoring Market by Product Type
- 7.3.1.1 Asia Pacific Engine Market by Country
- 7.3.1.2 Asia Pacific Gear Systems Market by Country
- 7.3.1.3 Asia Pacific Turbine Market by Country
- 7.3.1.4 Asia Pacific Hydraulic Systems Market by Country
- 7.3.1.5 Asia Pacific Compressor Market by Country
- 7.3.2 Asia Pacific Oil Condition Monitoring Market by Sampling Type
- 7.3.2.1 Asia Pacific Off-site Sampling Market by Country
- 7.3.2.2 Asia Pacific On-site Sampling Market by Country
- 7.3.3 Asia Pacific Oil Condition Monitoring Market by End user
- 7.3.3.1 Asia Pacific Oil & Gas Market by Country
- 7.3.3.2 Asia Pacific Industrial Market by Country
- 7.3.3.3 Asia Pacific Power Generation Market by Country
- 7.3.3.4 Asia Pacific Transportation Market by Country
- 7.3.3.5 Asia Pacific Mining Market by Country
- 7.3.4 Asia Pacific Oil Condition Monitoring Market by Country
- 7.3.4.1 China Oil Condition Monitoring Market
- 7.3.4.1.1 China Oil Condition Monitoring Market by Product Type
- 7.3.4.1.2 China Oil Condition Monitoring Market by Sampling Type
- 7.3.4.1.3 China Oil Condition Monitoring Market by End user
- 7.3.4.2 Japan Oil Condition Monitoring Market
- 7.3.4.2.1 Japan Oil Condition Monitoring Market by Product Type
- 7.3.4.2.2 Japan Oil Condition Monitoring Market by Sampling Type
- 7.3.4.2.3 Japan Oil Condition Monitoring Market by End user
- 7.3.4.3 India Oil Condition Monitoring Market
- 7.3.4.3.1 India Oil Condition Monitoring Market by Product Type
- 7.3.4.3.2 India Oil Condition Monitoring Market by Sampling Type
- 7.3.4.3.3 India Oil Condition Monitoring Market by End user
- 7.3.4.4 South Korea Oil Condition Monitoring Market
- 7.3.4.4.1 South Korea Oil Condition Monitoring Market by Product Type
- 7.3.4.4.2 South Korea Oil Condition Monitoring Market by Sampling Type
- 7.3.4.4.3 South Korea Oil Condition Monitoring Market by End user
- 7.3.4.5 Singapore Oil Condition Monitoring Market
- 7.3.4.5.1 Singapore Oil Condition Monitoring Market by Product Type
- 7.3.4.5.2 Singapore Oil Condition Monitoring Market by Sampling Type
- 7.3.4.5.3 Singapore Oil Condition Monitoring Market by End user
- 7.3.4.6 Malaysia Oil Condition Monitoring Market
- 7.3.4.6.1 Malaysia Oil Condition Monitoring Market by Product Type
- 7.3.4.6.2 Malaysia Oil Condition Monitoring Market by Sampling Type
- 7.3.4.6.3 Malaysia Oil Condition Monitoring Market by End user
- 7.3.4.7 Rest of Asia Pacific Oil Condition Monitoring Market
- 7.3.4.7.1 Rest of Asia Pacific Oil Condition Monitoring Market by Product Type
- 7.3.4.7.2 Rest of Asia Pacific Oil Condition Monitoring Market by Sampling Type
- 7.3.4.7.3 Rest of Asia Pacific Oil Condition Monitoring Market by End user
- 7.3.4.1 China Oil Condition Monitoring Market
- 7.3.1 Asia Pacific Oil Condition Monitoring Market by Product Type
- 7.4 LAMEA Oil Condition Monitoring Market
- 7.4.1 LAMEA Oil Condition Monitoring Market by Product Type
- 7.4.1.1 LAMEA Engine Market by Country
- 7.4.1.2 LAMEA Gear Systems Market by Country
- 7.4.1.3 LAMEA Turbine Market by Country
- 7.4.1.4 LAMEA Hydraulic Systems Market by Country
- 7.4.1.5 LAMEA Compressor Market by Country
- 7.4.2 LAMEA Oil Condition Monitoring Market by Sampling Type
- 7.4.2.1 LAMEA Off-site Sampling Market by Country
- 7.4.2.2 LAMEA On-site Sampling Market by Country
- 7.4.3 LAMEA Oil Condition Monitoring Market by End user
- 7.4.3.1 LAMEA Oil & Gas Market by Country
- 7.4.3.2 LAMEA Industrial Market by Country
- 7.4.3.3 LAMEA Power Generation Market by Country
- 7.4.3.4 LAMEA Transportation Market by Country
- 7.4.3.5 LAMEA Mining Market by Country
- 7.4.4 LAMEA Oil Condition Monitoring Market by Country
- 7.4.4.1 Brazil Oil Condition Monitoring Market
- 7.4.4.1.1 Brazil Oil Condition Monitoring Market by Product Type
- 7.4.4.1.2 Brazil Oil Condition Monitoring Market by Sampling Type
- 7.4.4.1.3 Brazil Oil Condition Monitoring Market by End user
- 7.4.4.2 Argentina Oil Condition Monitoring Market
- 7.4.4.2.1 Argentina Oil Condition Monitoring Market by Product Type
- 7.4.4.2.2 Argentina Oil Condition Monitoring Market by Sampling Type
- 7.4.4.2.3 Argentina Oil Condition Monitoring Market by End user
- 7.4.4.3 UAE Oil Condition Monitoring Market
- 7.4.4.3.1 UAE Oil Condition Monitoring Market by Product Type
- 7.4.4.3.2 UAE Oil Condition Monitoring Market by Sampling Type
- 7.4.4.3.3 UAE Oil Condition Monitoring Market by End user
- 7.4.4.4 Saudi Arabia Oil Condition Monitoring Market
- 7.4.4.4.1 Saudi Arabia Oil Condition Monitoring Market by Product Type
- 7.4.4.4.2 Saudi Arabia Oil Condition Monitoring Market by Sampling Type
- 7.4.4.4.3 Saudi Arabia Oil Condition Monitoring Market by End user
- 7.4.4.5 South Africa Oil Condition Monitoring Market
- 7.4.4.5.1 South Africa Oil Condition Monitoring Market by Product Type
- 7.4.4.5.2 South Africa Oil Condition Monitoring Market by Sampling Type
- 7.4.4.5.3 South Africa Oil Condition Monitoring Market by End user
- 7.4.4.6 Nigeria Oil Condition Monitoring Market
- 7.4.4.6.1 Nigeria Oil Condition Monitoring Market by Product Type
- 7.4.4.6.2 Nigeria Oil Condition Monitoring Market by Sampling Type
- 7.4.4.6.3 Nigeria Oil Condition Monitoring Market by End user
- 7.4.4.7 Rest of LAMEA Oil Condition Monitoring Market
- 7.4.4.7.1 Rest of LAMEA Oil Condition Monitoring Market by Product Type
- 7.4.4.7.2 Rest of LAMEA Oil Condition Monitoring Market by Sampling Type
- 7.4.4.7.3 Rest of LAMEA Oil Condition Monitoring Market by End user
- 7.4.4.1 Brazil Oil Condition Monitoring Market
- 7.4.1 LAMEA Oil Condition Monitoring Market by Product Type
Chapter 8. Company Profiles
- 8.1 Parker Hannifin Corporation
- 8.1.1 Company Overview
- 8.1.2 Financial Analysis
- 8.1.3 Segmental and Regional Analysis
- 8.1.4 Research & Development Expenses
- 8.1.5 Recent strategies and developments:
- 8.1.5.1 Product Launches and Product Expansions:
- 8.1.5.2 Acquisition and Mergers:
- 8.2 General Electric Company
- 8.2.1 Company Overview
- 8.2.2 Financial Analysis
- 8.2.3 Segmental and Regional Analysis
- 8.2.4 Research & Development Expense
- 8.2.5 Recent strategies and developments:
- 8.2.5.1 Product Launches and Product Expansions:
- 8.2.5.2 Acquisition and Mergers:
- 8.2.6 SWOT Analysis
- 8.3 Bureau Veritas S.A.
- 8.3.1 Company Overview
- 8.3.2 Financial Analysis
- 8.3.3 Segmental and Regional Analysis
- 8.3.4 Research & Development Expenses
- 8.4 Intertek Group PLC
- 8.4.1 Company Overview
- 8.4.2 Financial Analysis
- 8.4.3 Segmental and Regional Analysis
- 8.4.4 Recent strategies and developments:
- 8.4.4.1 Geographical Expansions:
- 8.5 SGS S.A.
- 8.5.1 Company Overview
- 8.5.2 Financial Analysis
- 8.5.3 Segmental Analysis
- 8.5.4 Recent strategies and developments:
- 8.5.4.1 Acquisition and Mergers:
- 8.6 Eaton Corporation PLC
- 8.6.1 Company Overview
- 8.6.2 Financial Analysis
- 8.6.3 Segmental Analysis
- 8.6.4 Research & Development Expense
- 8.6.5 Recent strategies and developments:
- 8.6.5.1 Acquisition and Mergers:
- 8.6.6 Swot Analysis
- 8.7 BP p.l.c.
- 8.7.1 Company Overview
- 8.7.2 Financial Analysis
- 8.7.3 Segmental and Regional Analysis
- 8.7.4 Research & Development Expenses
- 8.8 TotalEnergies SE
- 8.8.1 Company Overview
- 8.8.2 Financial Analysis
- 8.8.3 Segmental and Regional Analysis
- 8.8.4 Research & Development Expenses
- 8.9 Shell plc
- 8.9.1 Company Overview
- 8.9.2 Financial Analysis
- 8.9.3 Segmental and Regional Analysis
- 8.9.4 Research & Development Expenses
- 8.9.5 Recent strategies and developments:
- 8.9.5.1 Product Launches and Product Expansions:
- 8.10. Chevron Corporation
- 8.10.1 Company Overview
- 8.10.2 Financial Analysis
- 8.10.3 Segmental and Regional Analysis
- 8.10.4 Research & Development Expenses