|
|
市場調査レポート
商品コード
1276413
リンパ腫治療薬の世界市場規模、シェア、産業動向分析レポート:治療タイプ別、疾患タイプ別、投与経路別(注射、経口)、流通チャネル別、地域別展望と予測、2023~2029年Global Lymphoma Therapeutics Market Size, Share & Industry Trends Analysis Report By Treatment Type, By Disease Type, By Route of Administration (Injectable, and Oral Route), By Distribution Channel, By Regional Outlook and Forecast, 2023 - 2029 |
||||||
|
|
|||||||


| リンパ腫治療薬の世界市場規模、シェア、産業動向分析レポート:治療タイプ別、疾患タイプ別、投与経路別(注射、経口)、流通チャネル別、地域別展望と予測、2023~2029年 |
|
出版日: 2023年04月28日
発行: KBV Research
ページ情報: 英文 260 Pages
納期: 即納可能
|
- 全表示
- 概要
- 図表
- 目次
リンパ腫治療薬市場規模は、2029年には249億米ドルに達し、予測期間中にCAGR7.8%の市場成長率で上昇すると予測されています。
治療の選択は、リンパ腫の種類やステージだけでなく、患者の現在の健康状態や病歴などの追加的な基準によって決定されます。リンパ腫の治療は、リンパ腫患者を長期寛解状態に導くと同時に、生存の可能性を高めるという2つの目標に向かって行われます。
リンパ系のがんはリンパ腫と呼ばれ、リンパ腫は異常な悪性細胞の速い増殖を特徴とするがんの亜型です。一般的には、リンパ節、脾臓、胸腺、骨髄にあるリンパ球と呼ばれる白血球に影響を与えます。このため、免疫反応を起こす能力が低下します。その結果、リンパ節の腫れ、高熱、体重減少、息切れ、倦怠感などの症状が直接的な症状として現れます。
COVID-19の影響分析
パンデミックは、診断や治療の遅れ、臨床試験の中断により、リンパ腫治療薬市場にマイナスの影響を与えました。リンパ腫治療薬は、化学療法や免疫抑制療法が、がん治療の重要な側面である併存する感染症を悪化させる潜在的なリスクがあるため、医療専門家に課題を突きつけています。最近、抗CD20抗体による治療を受けたB細胞性非ホジキンリンパ腫(B-NHL)患者は、重度のCOVID-19疾患に罹患する可能性があります。
市場成長要因
治療選択肢の技術的進歩
リンパ腫治療薬では、TAAに着目したさまざまな治療開発が導入されています。がん免疫療法は、がん治療において重要な位置を占めるようになっています。がん免疫療法は、がん治療の重要な一部となっています。がん免疫療法は、意図しないオフターゲット効果を生じさせず、いくつかの臨床的な利点を有しています。このため、がん免疫療法に有効で副作用の少ないテーラーメイドの組み換えワクチンの開発が進められています。最近開発された免疫チェックポイント阻害剤(ICI)は、がん治療を変え、患者の生存率を向上させました。CTLA-4やPD-1のようなチェックポイントタンパク質に合わせたICIは、いくつかのがん種の治療薬として承認されています。これらの要因が、市場の成長を後押ししています。
リンパ腫の症例が増加し、治療薬への需要が高まる
2018年に世界で約50万件のNHLの新規症例が報告され、全がん診断の2.8%を占めました。NHLを発症する性別ごとの年齢標準化確率は、男性で6.7、女性で4.7であることが判明しました。これは、男性の生涯累積リスクが0.72%であるのに対し、女性は0.35%であることを示しています。さらに、人間開発指数の高い国、低い国、中程度の国では、男性は7.8/10万人、女性は5.6/10万人、2.9/10万人でした。したがって、リンパ腫、特に非ホジキンリンパ腫(NHL)の症例が増加していることから、多くのリンパ腫治療薬に対する需要が高まり、予測期間中の市場成長を後押しすると期待されます。
市場抑制要因
治療に伴う副作用
リンパ腫の治療には副作用がつきものです。消化器系の問題、「ケモブレイン」、かゆみ、痛み、乾燥肌、疲労、吐き気、嘔吐、脱毛、睡眠障害、末梢神経障害(神経損傷)、口腔粘膜炎(口内炎)などがその一例です。リンパ腫の治療後は、感染症のリスクが上昇する可能性があります。そのため、警告的な兆候や症状、必要に応じて医療チームと連絡を取る方法について認識しておくことが極めて重要です。がん治療により、特定の血球型の不足が生じることがあります。赤血球の減少、白血球の減少、血小板の減少などは、いずれも貧血の症状です。これらは、予測される期間において、リンパ腫治療薬市場の成長を妨げると予想されます。
疾患タイプ別展望
疾患タイプに基づき、リンパ腫治療薬市場はホジキンリンパ腫と非ホジキンリンパ腫に区分されます。ホジキンリンパ腫セグメントは、2022年にリンパ腫治療薬市場で大きな収益シェアを獲得しました。この成長は、ホジキンリンパ腫の有病率の上昇、疾患に対する認識の高まり、高齢者患者や再発・難治性(R/R)HL患者の大きなアンメットニーズなどの理由に起因しています。中程度の攻撃性を持つがんであるホジキンリンパ腫は、すぐに全身に広がる可能性があります。にもかかわらず、最も治癒しやすいがんの一つでもあります。
治療タイプの展望
治療タイプ別に見ると、リンパ腫治療薬市場は、免疫療法、化学療法、標的療法、放射線療法に分けられます。2022年のリンパ腫治療薬市場では、免疫療法分野が最も高い収益シェアを占めています。免疫療法の成長は、免疫学の進歩、免疫療法への幅広いアクセス、世界の製品承認数の増加などに起因しています。免疫療法は、良好な結果をもたらす治療法であることが判明しています。
投与経路の展望
投与経路別に見ると、リンパ腫治療薬市場は経口と注射に分類されます。注射セグメントは、2022年のリンパ腫治療薬市場において最大の収益シェアを示しました。これは、注射剤が皮下投与され、持続時間が5~7分であるためです。この方法は、静脈内投与よりもかなり速いです。これらの製品は、びまん性大細胞型B細胞リンパ腫、濾胞性リンパ腫、慢性リンパ球性白血病と診断された患者への使用が承認されています。
販売チャネルの展望
リンパ腫治療薬市場は、流通チャネル別に、病院薬局、小売薬局、その他に分類されます。2022年のリンパ腫治療薬市場では、小売薬局のセグメントが大きな収益シェアを記録しました。これは、小売薬局が医薬品の調製と販売を行うだけでなく、医薬品の適切な使用に関する顧客のカウンセリングや、起こりうる薬物相互作用に関する情報の提供を担当するためです。また、一般的な健康上の懸念や上市薬に関しても、小売薬剤師からアドバイスを受けることができます。
地域別展望
地域別に見ると、リンパ腫治療薬市場は、北米、欧州、アジア太平洋、LAMEAで分析されています。北米地域は、2022年に最大の収益シェアを獲得し、リンパ腫治療薬市場をリードしました。これは、リンパ腫の有病率の増加、標的療法や免疫療法を含むリンパ腫治療薬の進歩、この地域の重要な市場プレイヤーによる新製品リリースの増加によるものです。さらに、重要なプレイヤーの存在、最先端の薬剤へのアクセス、確立されたヘルスケアシステム、充実した研究開発費などが、この地域の市場成長を加速させるでしょう。
市場参入企業がとる主な戦略は買収です。カーディナルマトリックスに掲載された分析によると、Pfizer, Inc.、Johnson &Johnson、F. Hoffmann-La Roche Ltd.がリンパ腫治療薬市場の先駆者です。Eli Lilly And Company、Gilead Sciences, Inc.、Bristol Myers Squibb Companyなどの企業は、リンパ腫治療薬市場における主要な革新的企業の一部です。
目次
第1章 市場範囲と調査手法
- 市場の定義
- 目的
- 市場範囲
- セグメンテーション
- 世界のリンパ腫治療薬市場:治療タイプ別
- 世界のリンパ腫治療薬市場:疾患タイプ別
- 世界のリンパ腫治療薬市場:投与経路別
- 世界のリンパ腫治療薬市場:流通チャネル別
- 世界のリンパ腫治療薬市場:地域別
- 調査手法
第2章 市場概要
- イントロダクション
- 概要
- 市場構成とシナリオ
- 概要
- 市場に影響を与える主な要因
- 市場促進要因
- 市場抑制要因
第3章 競合分析- 世界
- KBVカーディナルマトリックス
- 最近の業界全体の戦略的展開
- パートナーシップ、コラボレーション、および契約
- 製品の発売と製品の拡大
- 買収と合併
- 承認とトライアル
- 主要成功戦略
- 主要なリーディングストラテジー
第4章 世界のリンパ腫治療薬市場:治療タイプ別
- 世界の免疫療法市場:地域別
- 世界の標的療法市場:地域別
- 世界の化学療法市場:地域別
- 世界の放射線療法市場:地域別
第5章 世界のリンパ腫治療薬市場:疾患タイプ別
- 世界の非ホジキンリンパ腫市場:地域別
- 世界のホジキンリンパ腫市場:地域別
第6章 世界のリンパ腫治療薬市場:投与経路別
- 世界の注射市場:地域別
- 世界の経口市場:地域別
第7章 世界のリンパ腫治療薬市場:流通チャネル別
- 世界の病院薬局市場:地域別
- 世界の小売薬局市場:地域別
- 世界のその他の市場:地域別
第8章 世界のリンパ腫治療薬市場:地域別
- 北米
- 北米の市場:国別
- 米国
- カナダ
- メキシコ
- その他北米地域
- 北米の市場:国別
- 欧州
- 欧州の市場:国別
- ドイツ
- 英国
- フランス
- ロシア
- スペイン
- イタリア
- その他欧州地域
- 欧州の市場:国別
- アジア太平洋
- アジア太平洋の市場:国別
- 中国
- 日本
- インド
- 韓国
- シンガポール
- マレーシア
- その他アジア太平洋地域
- アジア太平洋の市場:国別
- ラテンアメリカ・中東・アフリカ
- ラテンアメリカ・中東・アフリカの市場:国別
- ブラジル
- アルゼンチン
- アラブ首長国連邦
- サウジアラビア
- 南アフリカ
- ナイジェリア
- その他ラテンアメリカ・中東・アフリカ地域
- ラテンアメリカ・中東・アフリカの市場:国別
第9章 企業プロファイル
- Bayer AG
- Johnson & Johnson
- Gilead Sciences, Inc
- Bristol Myers Squibb Company
- Pfizer, Inc
- AstraZeneca PLC
- Teva Pharmaceutical Industries Ltd
- Eli Lilly And Company
- Seagen, Inc
- F Hoffmann-La Roche Ltd.
LIST OF TABLES
- TABLE 1 Global Lymphoma Therapeutics Market, 2019 - 2022, USD Million
- TABLE 2 Global Lymphoma Therapeutics Market, 2023 - 2029, USD Million
- TABLE 3 Partnerships, Collaborations and Agreements- Lymphoma Therapeutics Market
- TABLE 4 Product Launches And Product Expansions- Lymphoma Therapeutics Market
- TABLE 5 Acquisition and Mergers- Lymphoma Therapeutics Market
- TABLE 6 Approvals and trials - Lymphoma Therapeutics Market
- TABLE 7 Global Lymphoma Therapeutics Market by Treatment Type, 2019 - 2022, USD Million
- TABLE 8 Global Lymphoma Therapeutics Market by Treatment Type, 2023 - 2029, USD Million
- TABLE 9 Global Immune Therapy Market by Region, 2019 - 2022, USD Million
- TABLE 10 Global Immune Therapy Market by Region, 2023 - 2029, USD Million
- TABLE 11 Global Target Therapy Market by Region, 2019 - 2022, USD Million
- TABLE 12 Global Target Therapy Market by Region, 2023 - 2029, USD Million
- TABLE 13 Global Chemotherapy Market by Region, 2019 - 2022, USD Million
- TABLE 14 Global Chemotherapy Market by Region, 2023 - 2029, USD Million
- TABLE 15 Global Radiation Therapy Market by Region, 2019 - 2022, USD Million
- TABLE 16 Global Radiation Therapy Market by Region, 2023 - 2029, USD Million
- TABLE 17 Global Lymphoma Therapeutics Market by Disease Type, 2019 - 2022, USD Million
- TABLE 18 Global Lymphoma Therapeutics Market by Disease Type, 2023 - 2029, USD Million
- TABLE 19 Global Non-Hodgkin Lymphoma Market by Region, 2019 - 2022, USD Million
- TABLE 20 Global Non-Hodgkin Lymphoma Market by Region, 2023 - 2029, USD Million
- TABLE 21 Global Hodgkin Lymphoma Market by Region, 2019 - 2022, USD Million
- TABLE 22 Global Hodgkin Lymphoma Market by Region, 2023 - 2029, USD Million
- TABLE 23 Global Lymphoma Therapeutics Market by Route of Administration, 2019 - 2022, USD Million
- TABLE 24 Global Lymphoma Therapeutics Market by Route of Administration, 2023 - 2029, USD Million
- TABLE 25 Global Injectable Market by Region, 2019 - 2022, USD Million
- TABLE 26 Global Injectable Market by Region, 2023 - 2029, USD Million
- TABLE 27 Global Oral Route Market by Region, 2019 - 2022, USD Million
- TABLE 28 Global Oral Route Market by Region, 2023 - 2029, USD Million
- TABLE 29 Global Lymphoma Therapeutics Market by Distribution Channel, 2019 - 2022, USD Million
- TABLE 30 Global Lymphoma Therapeutics Market by Distribution Channel, 2023 - 2029, USD Million
- TABLE 31 Global Hospital Pharmacies Market by Region, 2019 - 2022, USD Million
- TABLE 32 Global Hospital Pharmacies Market by Region, 2023 - 2029, USD Million
- TABLE 33 Global Retail Pharmacies Market by Region, 2019 - 2022, USD Million
- TABLE 34 Global Retail Pharmacies Market by Region, 2023 - 2029, USD Million
- TABLE 35 Global Others Market by Region, 2019 - 2022, USD Million
- TABLE 36 Global Others Market by Region, 2023 - 2029, USD Million
- TABLE 37 Global Lymphoma Therapeutics Market by Region, 2019 - 2022, USD Million
- TABLE 38 Global Lymphoma Therapeutics Market by Region, 2023 - 2029, USD Million
- TABLE 39 North America Lymphoma Therapeutics Market, 2019 - 2022, USD Million
- TABLE 40 North America Lymphoma Therapeutics Market, 2023 - 2029, USD Million
- TABLE 41 North America Lymphoma Therapeutics Market by Treatment Type, 2019 - 2022, USD Million
- TABLE 42 North America Lymphoma Therapeutics Market by Treatment Type, 2023 - 2029, USD Million
- TABLE 43 North America Immune Therapy Market by Country, 2019 - 2022, USD Million
- TABLE 44 North America Immune Therapy Market by Country, 2023 - 2029, USD Million
- TABLE 45 North America Target Therapy Market by Country, 2019 - 2022, USD Million
- TABLE 46 North America Target Therapy Market by Country, 2023 - 2029, USD Million
- TABLE 47 North America Chemotherapy Market by Country, 2019 - 2022, USD Million
- TABLE 48 North America Chemotherapy Market by Country, 2023 - 2029, USD Million
- TABLE 49 North America Radiation Therapy Market by Country, 2019 - 2022, USD Million
- TABLE 50 North America Radiation Therapy Market by Country, 2023 - 2029, USD Million
- TABLE 51 North America Lymphoma Therapeutics Market by Disease Type, 2019 - 2022, USD Million
- TABLE 52 North America Lymphoma Therapeutics Market by Disease Type, 2023 - 2029, USD Million
- TABLE 53 North America Non-Hodgkin Lymphoma Market by Country, 2019 - 2022, USD Million
- TABLE 54 North America Non-Hodgkin Lymphoma Market by Country, 2023 - 2029, USD Million
- TABLE 55 North America Hodgkin Lymphoma Market by Country, 2019 - 2022, USD Million
- TABLE 56 North America Hodgkin Lymphoma Market by Country, 2023 - 2029, USD Million
- TABLE 57 North America Lymphoma Therapeutics Market by Route of Administration, 2019 - 2022, USD Million
- TABLE 58 North America Lymphoma Therapeutics Market by Route of Administration, 2023 - 2029, USD Million
- TABLE 59 North America Injectable Market by Country, 2019 - 2022, USD Million
- TABLE 60 North America Injectable Market by Country, 2023 - 2029, USD Million
- TABLE 61 North America Oral Route Market by Country, 2019 - 2022, USD Million
- TABLE 62 North America Oral Route Market by Country, 2023 - 2029, USD Million
- TABLE 63 North America Lymphoma Therapeutics Market by Distribution Channel, 2019 - 2022, USD Million
- TABLE 64 North America Lymphoma Therapeutics Market by Distribution Channel, 2023 - 2029, USD Million
- TABLE 65 North America Hospital Pharmacies Market by Country, 2019 - 2022, USD Million
- TABLE 66 North America Hospital Pharmacies Market by Country, 2023 - 2029, USD Million
- TABLE 67 North America Retail Pharmacies Market by Country, 2019 - 2022, USD Million
- TABLE 68 North America Retail Pharmacies Market by Country, 2023 - 2029, USD Million
- TABLE 69 North America Others Market by Country, 2019 - 2022, USD Million
- TABLE 70 North America Others Market by Country, 2023 - 2029, USD Million
- TABLE 71 North America Lymphoma Therapeutics Market by Country, 2019 - 2022, USD Million
- TABLE 72 North America Lymphoma Therapeutics Market by Country, 2023 - 2029, USD Million
- TABLE 73 US Lymphoma Therapeutics Market, 2019 - 2022, USD Million
- TABLE 74 US Lymphoma Therapeutics Market, 2023 - 2029, USD Million
- TABLE 75 US Lymphoma Therapeutics Market by Treatment Type, 2019 - 2022, USD Million
- TABLE 76 US Lymphoma Therapeutics Market by Treatment Type, 2023 - 2029, USD Million
- TABLE 77 US Lymphoma Therapeutics Market by Disease Type, 2019 - 2022, USD Million
- TABLE 78 US Lymphoma Therapeutics Market by Disease Type, 2023 - 2029, USD Million
- TABLE 79 US Lymphoma Therapeutics Market by Route of Administration, 2019 - 2022, USD Million
- TABLE 80 US Lymphoma Therapeutics Market by Route of Administration, 2023 - 2029, USD Million
- TABLE 81 US Lymphoma Therapeutics Market by Distribution Channel, 2019 - 2022, USD Million
- TABLE 82 US Lymphoma Therapeutics Market by Distribution Channel, 2023 - 2029, USD Million
- TABLE 83 Canada Lymphoma Therapeutics Market, 2019 - 2022, USD Million
- TABLE 84 Canada Lymphoma Therapeutics Market, 2023 - 2029, USD Million
- TABLE 85 Canada Lymphoma Therapeutics Market by Treatment Type, 2019 - 2022, USD Million
- TABLE 86 Canada Lymphoma Therapeutics Market by Treatment Type, 2023 - 2029, USD Million
- TABLE 87 Canada Lymphoma Therapeutics Market by Disease Type, 2019 - 2022, USD Million
- TABLE 88 Canada Lymphoma Therapeutics Market by Disease Type, 2023 - 2029, USD Million
- TABLE 89 Canada Lymphoma Therapeutics Market by Route of Administration, 2019 - 2022, USD Million
- TABLE 90 Canada Lymphoma Therapeutics Market by Route of Administration, 2023 - 2029, USD Million
- TABLE 91 Canada Lymphoma Therapeutics Market by Distribution Channel, 2019 - 2022, USD Million
- TABLE 92 Canada Lymphoma Therapeutics Market by Distribution Channel, 2023 - 2029, USD Million
- TABLE 93 Mexico Lymphoma Therapeutics Market, 2019 - 2022, USD Million
- TABLE 94 Mexico Lymphoma Therapeutics Market, 2023 - 2029, USD Million
- TABLE 95 Mexico Lymphoma Therapeutics Market by Treatment Type, 2019 - 2022, USD Million
- TABLE 96 Mexico Lymphoma Therapeutics Market by Treatment Type, 2023 - 2029, USD Million
- TABLE 97 Mexico Lymphoma Therapeutics Market by Disease Type, 2019 - 2022, USD Million
- TABLE 98 Mexico Lymphoma Therapeutics Market by Disease Type, 2023 - 2029, USD Million
- TABLE 99 Mexico Lymphoma Therapeutics Market by Route of Administration, 2019 - 2022, USD Million
- TABLE 100 Mexico Lymphoma Therapeutics Market by Route of Administration, 2023 - 2029, USD Million
- TABLE 101 Mexico Lymphoma Therapeutics Market by Distribution Channel, 2019 - 2022, USD Million
- TABLE 102 Mexico Lymphoma Therapeutics Market by Distribution Channel, 2023 - 2029, USD Million
- TABLE 103 Rest of North America Lymphoma Therapeutics Market, 2019 - 2022, USD Million
- TABLE 104 Rest of North America Lymphoma Therapeutics Market, 2023 - 2029, USD Million
- TABLE 105 Rest of North America Lymphoma Therapeutics Market by Treatment Type, 2019 - 2022, USD Million
- TABLE 106 Rest of North America Lymphoma Therapeutics Market by Treatment Type, 2023 - 2029, USD Million
- TABLE 107 Rest of North America Lymphoma Therapeutics Market by Disease Type, 2019 - 2022, USD Million
- TABLE 108 Rest of North America Lymphoma Therapeutics Market by Disease Type, 2023 - 2029, USD Million
- TABLE 109 Rest of North America Lymphoma Therapeutics Market by Route of Administration, 2019 - 2022, USD Million
- TABLE 110 Rest of North America Lymphoma Therapeutics Market by Route of Administration, 2023 - 2029, USD Million
- TABLE 111 Rest of North America Lymphoma Therapeutics Market by Distribution Channel, 2019 - 2022, USD Million
- TABLE 112 Rest of North America Lymphoma Therapeutics Market by Distribution Channel, 2023 - 2029, USD Million
- TABLE 113 Europe Lymphoma Therapeutics Market, 2019 - 2022, USD Million
- TABLE 114 Europe Lymphoma Therapeutics Market, 2023 - 2029, USD Million
- TABLE 115 Europe Lymphoma Therapeutics Market by Treatment Type, 2019 - 2022, USD Million
- TABLE 116 Europe Lymphoma Therapeutics Market by Treatment Type, 2023 - 2029, USD Million
- TABLE 117 Europe Immune Therapy Market by Country, 2019 - 2022, USD Million
- TABLE 118 Europe Immune Therapy Market by Country, 2023 - 2029, USD Million
- TABLE 119 Europe Target Therapy Market by Country, 2019 - 2022, USD Million
- TABLE 120 Europe Target Therapy Market by Country, 2023 - 2029, USD Million
- TABLE 121 Europe Chemotherapy Market by Country, 2019 - 2022, USD Million
- TABLE 122 Europe Chemotherapy Market by Country, 2023 - 2029, USD Million
- TABLE 123 Europe Radiation Therapy Market by Country, 2019 - 2022, USD Million
- TABLE 124 Europe Radiation Therapy Market by Country, 2023 - 2029, USD Million
- TABLE 125 Europe Lymphoma Therapeutics Market by Disease Type, 2019 - 2022, USD Million
- TABLE 126 Europe Lymphoma Therapeutics Market by Disease Type, 2023 - 2029, USD Million
- TABLE 127 Europe Non-Hodgkin Lymphoma Market by Country, 2019 - 2022, USD Million
- TABLE 128 Europe Non-Hodgkin Lymphoma Market by Country, 2023 - 2029, USD Million
- TABLE 129 Europe Hodgkin Lymphoma Market by Country, 2019 - 2022, USD Million
- TABLE 130 Europe Hodgkin Lymphoma Market by Country, 2023 - 2029, USD Million
- TABLE 131 Europe Lymphoma Therapeutics Market by Route of Administration, 2019 - 2022, USD Million
- TABLE 132 Europe Lymphoma Therapeutics Market by Route of Administration, 2023 - 2029, USD Million
- TABLE 133 Europe Injectable Market by Country, 2019 - 2022, USD Million
- TABLE 134 Europe Injectable Market by Country, 2023 - 2029, USD Million
- TABLE 135 Europe Oral Route Market by Country, 2019 - 2022, USD Million
- TABLE 136 Europe Oral Route Market by Country, 2023 - 2029, USD Million
- TABLE 137 Europe Lymphoma Therapeutics Market by Distribution Channel, 2019 - 2022, USD Million
- TABLE 138 Europe Lymphoma Therapeutics Market by Distribution Channel, 2023 - 2029, USD Million
- TABLE 139 Europe Hospital Pharmacies Market by Country, 2019 - 2022, USD Million
- TABLE 140 Europe Hospital Pharmacies Market by Country, 2023 - 2029, USD Million
- TABLE 141 Europe Retail Pharmacies Market by Country, 2019 - 2022, USD Million
- TABLE 142 Europe Retail Pharmacies Market by Country, 2023 - 2029, USD Million
- TABLE 143 Europe Others Market by Country, 2019 - 2022, USD Million
- TABLE 144 Europe Others Market by Country, 2023 - 2029, USD Million
- TABLE 145 Europe Lymphoma Therapeutics Market by Country, 2019 - 2022, USD Million
- TABLE 146 Europe Lymphoma Therapeutics Market by Country, 2023 - 2029, USD Million
- TABLE 147 Germany Lymphoma Therapeutics Market, 2019 - 2022, USD Million
- TABLE 148 Germany Lymphoma Therapeutics Market, 2023 - 2029, USD Million
- TABLE 149 Germany Lymphoma Therapeutics Market by Treatment Type, 2019 - 2022, USD Million
- TABLE 150 Germany Lymphoma Therapeutics Market by Treatment Type, 2023 - 2029, USD Million
- TABLE 151 Germany Lymphoma Therapeutics Market by Disease Type, 2019 - 2022, USD Million
- TABLE 152 Germany Lymphoma Therapeutics Market by Disease Type, 2023 - 2029, USD Million
- TABLE 153 Germany Lymphoma Therapeutics Market by Route of Administration, 2019 - 2022, USD Million
- TABLE 154 Germany Lymphoma Therapeutics Market by Route of Administration, 2023 - 2029, USD Million
- TABLE 155 Germany Lymphoma Therapeutics Market by Distribution Channel, 2019 - 2022, USD Million
- TABLE 156 Germany Lymphoma Therapeutics Market by Distribution Channel, 2023 - 2029, USD Million
- TABLE 157 UK Lymphoma Therapeutics Market, 2019 - 2022, USD Million
- TABLE 158 UK Lymphoma Therapeutics Market, 2023 - 2029, USD Million
- TABLE 159 UK Lymphoma Therapeutics Market by Treatment Type, 2019 - 2022, USD Million
- TABLE 160 UK Lymphoma Therapeutics Market by Treatment Type, 2023 - 2029, USD Million
- TABLE 161 UK Lymphoma Therapeutics Market by Disease Type, 2019 - 2022, USD Million
- TABLE 162 UK Lymphoma Therapeutics Market by Disease Type, 2023 - 2029, USD Million
- TABLE 163 UK Lymphoma Therapeutics Market by Route of Administration, 2019 - 2022, USD Million
- TABLE 164 UK Lymphoma Therapeutics Market by Route of Administration, 2023 - 2029, USD Million
- TABLE 165 UK Lymphoma Therapeutics Market by Distribution Channel, 2019 - 2022, USD Million
- TABLE 166 UK Lymphoma Therapeutics Market by Distribution Channel, 2023 - 2029, USD Million
- TABLE 167 France Lymphoma Therapeutics Market, 2019 - 2022, USD Million
- TABLE 168 France Lymphoma Therapeutics Market, 2023 - 2029, USD Million
- TABLE 169 France Lymphoma Therapeutics Market by Treatment Type, 2019 - 2022, USD Million
- TABLE 170 France Lymphoma Therapeutics Market by Treatment Type, 2023 - 2029, USD Million
- TABLE 171 France Lymphoma Therapeutics Market by Disease Type, 2019 - 2022, USD Million
- TABLE 172 France Lymphoma Therapeutics Market by Disease Type, 2023 - 2029, USD Million
- TABLE 173 France Lymphoma Therapeutics Market by Route of Administration, 2019 - 2022, USD Million
- TABLE 174 France Lymphoma Therapeutics Market by Route of Administration, 2023 - 2029, USD Million
- TABLE 175 France Lymphoma Therapeutics Market by Distribution Channel, 2019 - 2022, USD Million
- TABLE 176 France Lymphoma Therapeutics Market by Distribution Channel, 2023 - 2029, USD Million
- TABLE 177 Russia Lymphoma Therapeutics Market, 2019 - 2022, USD Million
- TABLE 178 Russia Lymphoma Therapeutics Market, 2023 - 2029, USD Million
- TABLE 179 Russia Lymphoma Therapeutics Market by Treatment Type, 2019 - 2022, USD Million
- TABLE 180 Russia Lymphoma Therapeutics Market by Treatment Type, 2023 - 2029, USD Million
- TABLE 181 Russia Lymphoma Therapeutics Market by Disease Type, 2019 - 2022, USD Million
- TABLE 182 Russia Lymphoma Therapeutics Market by Disease Type, 2023 - 2029, USD Million
- TABLE 183 Russia Lymphoma Therapeutics Market by Route of Administration, 2019 - 2022, USD Million
- TABLE 184 Russia Lymphoma Therapeutics Market by Route of Administration, 2023 - 2029, USD Million
- TABLE 185 Russia Lymphoma Therapeutics Market by Distribution Channel, 2019 - 2022, USD Million
- TABLE 186 Russia Lymphoma Therapeutics Market by Distribution Channel, 2023 - 2029, USD Million
- TABLE 187 Spain Lymphoma Therapeutics Market, 2019 - 2022, USD Million
- TABLE 188 Spain Lymphoma Therapeutics Market, 2023 - 2029, USD Million
- TABLE 189 Spain Lymphoma Therapeutics Market by Treatment Type, 2019 - 2022, USD Million
- TABLE 190 Spain Lymphoma Therapeutics Market by Treatment Type, 2023 - 2029, USD Million
- TABLE 191 Spain Lymphoma Therapeutics Market by Disease Type, 2019 - 2022, USD Million
- TABLE 192 Spain Lymphoma Therapeutics Market by Disease Type, 2023 - 2029, USD Million
- TABLE 193 Spain Lymphoma Therapeutics Market by Route of Administration, 2019 - 2022, USD Million
- TABLE 194 Spain Lymphoma Therapeutics Market by Route of Administration, 2023 - 2029, USD Million
- TABLE 195 Spain Lymphoma Therapeutics Market by Distribution Channel, 2019 - 2022, USD Million
- TABLE 196 Spain Lymphoma Therapeutics Market by Distribution Channel, 2023 - 2029, USD Million
- TABLE 197 Italy Lymphoma Therapeutics Market, 2019 - 2022, USD Million
- TABLE 198 Italy Lymphoma Therapeutics Market, 2023 - 2029, USD Million
- TABLE 199 Italy Lymphoma Therapeutics Market by Treatment Type, 2019 - 2022, USD Million
- TABLE 200 Italy Lymphoma Therapeutics Market by Treatment Type, 2023 - 2029, USD Million
- TABLE 201 Italy Lymphoma Therapeutics Market by Disease Type, 2019 - 2022, USD Million
- TABLE 202 Italy Lymphoma Therapeutics Market by Disease Type, 2023 - 2029, USD Million
- TABLE 203 Italy Lymphoma Therapeutics Market by Route of Administration, 2019 - 2022, USD Million
- TABLE 204 Italy Lymphoma Therapeutics Market by Route of Administration, 2023 - 2029, USD Million
- TABLE 205 Italy Lymphoma Therapeutics Market by Distribution Channel, 2019 - 2022, USD Million
- TABLE 206 Italy Lymphoma Therapeutics Market by Distribution Channel, 2023 - 2029, USD Million
- TABLE 207 Rest of Europe Lymphoma Therapeutics Market, 2019 - 2022, USD Million
- TABLE 208 Rest of Europe Lymphoma Therapeutics Market, 2023 - 2029, USD Million
- TABLE 209 Rest of Europe Lymphoma Therapeutics Market by Treatment Type, 2019 - 2022, USD Million
- TABLE 210 Rest of Europe Lymphoma Therapeutics Market by Treatment Type, 2023 - 2029, USD Million
- TABLE 211 Rest of Europe Lymphoma Therapeutics Market by Disease Type, 2019 - 2022, USD Million
- TABLE 212 Rest of Europe Lymphoma Therapeutics Market by Disease Type, 2023 - 2029, USD Million
- TABLE 213 Rest of Europe Lymphoma Therapeutics Market by Route of Administration, 2019 - 2022, USD Million
- TABLE 214 Rest of Europe Lymphoma Therapeutics Market by Route of Administration, 2023 - 2029, USD Million
- TABLE 215 Rest of Europe Lymphoma Therapeutics Market by Distribution Channel, 2019 - 2022, USD Million
- TABLE 216 Rest of Europe Lymphoma Therapeutics Market by Distribution Channel, 2023 - 2029, USD Million
- TABLE 217 Asia Pacific Lymphoma Therapeutics Market, 2019 - 2022, USD Million
- TABLE 218 Asia Pacific Lymphoma Therapeutics Market, 2023 - 2029, USD Million
- TABLE 219 Asia Pacific Lymphoma Therapeutics Market by Treatment Type, 2019 - 2022, USD Million
- TABLE 220 Asia Pacific Lymphoma Therapeutics Market by Treatment Type, 2023 - 2029, USD Million
- TABLE 221 Asia Pacific Immune Therapy Market by Country, 2019 - 2022, USD Million
- TABLE 222 Asia Pacific Immune Therapy Market by Country, 2023 - 2029, USD Million
- TABLE 223 Asia Pacific Target Therapy Market by Country, 2019 - 2022, USD Million
- TABLE 224 Asia Pacific Target Therapy Market by Country, 2023 - 2029, USD Million
- TABLE 225 Asia Pacific Chemotherapy Market by Country, 2019 - 2022, USD Million
- TABLE 226 Asia Pacific Chemotherapy Market by Country, 2023 - 2029, USD Million
- TABLE 227 Asia Pacific Radiation Therapy Market by Country, 2019 - 2022, USD Million
- TABLE 228 Asia Pacific Radiation Therapy Market by Country, 2023 - 2029, USD Million
- TABLE 229 Asia Pacific Lymphoma Therapeutics Market by Disease Type, 2019 - 2022, USD Million
- TABLE 230 Asia Pacific Lymphoma Therapeutics Market by Disease Type, 2023 - 2029, USD Million
- TABLE 231 Asia Pacific Non-Hodgkin Lymphoma Market by Country, 2019 - 2022, USD Million
- TABLE 232 Asia Pacific Non-Hodgkin Lymphoma Market by Country, 2023 - 2029, USD Million
- TABLE 233 Asia Pacific Hodgkin Lymphoma Market by Country, 2019 - 2022, USD Million
- TABLE 234 Asia Pacific Hodgkin Lymphoma Market by Country, 2023 - 2029, USD Million
- TABLE 235 Asia Pacific Lymphoma Therapeutics Market by Route of Administration, 2019 - 2022, USD Million
- TABLE 236 Asia Pacific Lymphoma Therapeutics Market by Route of Administration, 2023 - 2029, USD Million
- TABLE 237 Asia Pacific Injectable Market by Country, 2019 - 2022, USD Million
- TABLE 238 Asia Pacific Injectable Market by Country, 2023 - 2029, USD Million
- TABLE 239 Asia Pacific Oral Route Market by Country, 2019 - 2022, USD Million
- TABLE 240 Asia Pacific Oral Route Market by Country, 2023 - 2029, USD Million
- TABLE 241 Asia Pacific Lymphoma Therapeutics Market by Distribution Channel, 2019 - 2022, USD Million
- TABLE 242 Asia Pacific Lymphoma Therapeutics Market by Distribution Channel, 2023 - 2029, USD Million
- TABLE 243 Asia Pacific Hospital Pharmacies Market by Country, 2019 - 2022, USD Million
- TABLE 244 Asia Pacific Hospital Pharmacies Market by Country, 2023 - 2029, USD Million
- TABLE 245 Asia Pacific Retail Pharmacies Market by Country, 2019 - 2022, USD Million
- TABLE 246 Asia Pacific Retail Pharmacies Market by Country, 2023 - 2029, USD Million
- TABLE 247 Asia Pacific Others Market by Country, 2019 - 2022, USD Million
- TABLE 248 Asia Pacific Others Market by Country, 2023 - 2029, USD Million
- TABLE 249 Asia Pacific Lymphoma Therapeutics Market by Country, 2019 - 2022, USD Million
- TABLE 250 Asia Pacific Lymphoma Therapeutics Market by Country, 2023 - 2029, USD Million
- TABLE 251 China Lymphoma Therapeutics Market, 2019 - 2022, USD Million
- TABLE 252 China Lymphoma Therapeutics Market, 2023 - 2029, USD Million
- TABLE 253 China Lymphoma Therapeutics Market by Treatment Type, 2019 - 2022, USD Million
- TABLE 254 China Lymphoma Therapeutics Market by Treatment Type, 2023 - 2029, USD Million
- TABLE 255 China Lymphoma Therapeutics Market by Disease Type, 2019 - 2022, USD Million
- TABLE 256 China Lymphoma Therapeutics Market by Disease Type, 2023 - 2029, USD Million
- TABLE 257 China Lymphoma Therapeutics Market by Route of Administration, 2019 - 2022, USD Million
- TABLE 258 China Lymphoma Therapeutics Market by Route of Administration, 2023 - 2029, USD Million
- TABLE 259 China Lymphoma Therapeutics Market by Distribution Channel, 2019 - 2022, USD Million
- TABLE 260 China Lymphoma Therapeutics Market by Distribution Channel, 2023 - 2029, USD Million
- TABLE 261 Japan Lymphoma Therapeutics Market, 2019 - 2022, USD Million
- TABLE 262 Japan Lymphoma Therapeutics Market, 2023 - 2029, USD Million
- TABLE 263 Japan Lymphoma Therapeutics Market by Treatment Type, 2019 - 2022, USD Million
- TABLE 264 Japan Lymphoma Therapeutics Market by Treatment Type, 2023 - 2029, USD Million
- TABLE 265 Japan Lymphoma Therapeutics Market by Disease Type, 2019 - 2022, USD Million
- TABLE 266 Japan Lymphoma Therapeutics Market by Disease Type, 2023 - 2029, USD Million
- TABLE 267 Japan Lymphoma Therapeutics Market by Route of Administration, 2019 - 2022, USD Million
- TABLE 268 Japan Lymphoma Therapeutics Market by Route of Administration, 2023 - 2029, USD Million
- TABLE 269 Japan Lymphoma Therapeutics Market by Distribution Channel, 2019 - 2022, USD Million
- TABLE 270 Japan Lymphoma Therapeutics Market by Distribution Channel, 2023 - 2029, USD Million
- TABLE 271 India Lymphoma Therapeutics Market, 2019 - 2022, USD Million
- TABLE 272 India Lymphoma Therapeutics Market, 2023 - 2029, USD Million
- TABLE 273 India Lymphoma Therapeutics Market by Treatment Type, 2019 - 2022, USD Million
- TABLE 274 India Lymphoma Therapeutics Market by Treatment Type, 2023 - 2029, USD Million
- TABLE 275 India Lymphoma Therapeutics Market by Disease Type, 2019 - 2022, USD Million
- TABLE 276 India Lymphoma Therapeutics Market by Disease Type, 2023 - 2029, USD Million
- TABLE 277 India Lymphoma Therapeutics Market by Route of Administration, 2019 - 2022, USD Million
- TABLE 278 India Lymphoma Therapeutics Market by Route of Administration, 2023 - 2029, USD Million
- TABLE 279 India Lymphoma Therapeutics Market by Distribution Channel, 2019 - 2022, USD Million
- TABLE 280 India Lymphoma Therapeutics Market by Distribution Channel, 2023 - 2029, USD Million
- TABLE 281 South Korea Lymphoma Therapeutics Market, 2019 - 2022, USD Million
- TABLE 282 South Korea Lymphoma Therapeutics Market, 2023 - 2029, USD Million
- TABLE 283 South Korea Lymphoma Therapeutics Market by Treatment Type, 2019 - 2022, USD Million
- TABLE 284 South Korea Lymphoma Therapeutics Market by Treatment Type, 2023 - 2029, USD Million
- TABLE 285 South Korea Lymphoma Therapeutics Market by Disease Type, 2019 - 2022, USD Million
- TABLE 286 South Korea Lymphoma Therapeutics Market by Disease Type, 2023 - 2029, USD Million
- TABLE 287 South Korea Lymphoma Therapeutics Market by Route of Administration, 2019 - 2022, USD Million
- TABLE 288 South Korea Lymphoma Therapeutics Market by Route of Administration, 2023 - 2029, USD Million
- TABLE 289 South Korea Lymphoma Therapeutics Market by Distribution Channel, 2019 - 2022, USD Million
- TABLE 290 South Korea Lymphoma Therapeutics Market by Distribution Channel, 2023 - 2029, USD Million
- TABLE 291 Singapore Lymphoma Therapeutics Market, 2019 - 2022, USD Million
- TABLE 292 Singapore Lymphoma Therapeutics Market, 2023 - 2029, USD Million
- TABLE 293 Singapore Lymphoma Therapeutics Market by Treatment Type, 2019 - 2022, USD Million
- TABLE 294 Singapore Lymphoma Therapeutics Market by Treatment Type, 2023 - 2029, USD Million
- TABLE 295 Singapore Lymphoma Therapeutics Market by Disease Type, 2019 - 2022, USD Million
- TABLE 296 Singapore Lymphoma Therapeutics Market by Disease Type, 2023 - 2029, USD Million
- TABLE 297 Singapore Lymphoma Therapeutics Market by Route of Administration, 2019 - 2022, USD Million
- TABLE 298 Singapore Lymphoma Therapeutics Market by Route of Administration, 2023 - 2029, USD Million
- TABLE 299 Singapore Lymphoma Therapeutics Market by Distribution Channel, 2019 - 2022, USD Million
- TABLE 300 Singapore Lymphoma Therapeutics Market by Distribution Channel, 2023 - 2029, USD Million
- TABLE 301 Malaysia Lymphoma Therapeutics Market, 2019 - 2022, USD Million
- TABLE 302 Malaysia Lymphoma Therapeutics Market, 2023 - 2029, USD Million
- TABLE 303 Malaysia Lymphoma Therapeutics Market by Treatment Type, 2019 - 2022, USD Million
- TABLE 304 Malaysia Lymphoma Therapeutics Market by Treatment Type, 2023 - 2029, USD Million
- TABLE 305 Malaysia Lymphoma Therapeutics Market by Disease Type, 2019 - 2022, USD Million
- TABLE 306 Malaysia Lymphoma Therapeutics Market by Disease Type, 2023 - 2029, USD Million
- TABLE 307 Malaysia Lymphoma Therapeutics Market by Route of Administration, 2019 - 2022, USD Million
- TABLE 308 Malaysia Lymphoma Therapeutics Market by Route of Administration, 2023 - 2029, USD Million
- TABLE 309 Malaysia Lymphoma Therapeutics Market by Distribution Channel, 2019 - 2022, USD Million
- TABLE 310 Malaysia Lymphoma Therapeutics Market by Distribution Channel, 2023 - 2029, USD Million
- TABLE 311 Rest of Asia Pacific Lymphoma Therapeutics Market, 2019 - 2022, USD Million
- TABLE 312 Rest of Asia Pacific Lymphoma Therapeutics Market, 2023 - 2029, USD Million
- TABLE 313 Rest of Asia Pacific Lymphoma Therapeutics Market by Treatment Type, 2019 - 2022, USD Million
- TABLE 314 Rest of Asia Pacific Lymphoma Therapeutics Market by Treatment Type, 2023 - 2029, USD Million
- TABLE 315 Rest of Asia Pacific Lymphoma Therapeutics Market by Disease Type, 2019 - 2022, USD Million
- TABLE 316 Rest of Asia Pacific Lymphoma Therapeutics Market by Disease Type, 2023 - 2029, USD Million
- TABLE 317 Rest of Asia Pacific Lymphoma Therapeutics Market by Route of Administration, 2019 - 2022, USD Million
- TABLE 318 Rest of Asia Pacific Lymphoma Therapeutics Market by Route of Administration, 2023 - 2029, USD Million
- TABLE 319 Rest of Asia Pacific Lymphoma Therapeutics Market by Distribution Channel, 2019 - 2022, USD Million
- TABLE 320 Rest of Asia Pacific Lymphoma Therapeutics Market by Distribution Channel, 2023 - 2029, USD Million
- TABLE 321 LAMEA Lymphoma Therapeutics Market, 2019 - 2022, USD Million
- TABLE 322 LAMEA Lymphoma Therapeutics Market, 2023 - 2029, USD Million
- TABLE 323 LAMEA Lymphoma Therapeutics Market by Treatment Type, 2019 - 2022, USD Million
- TABLE 324 LAMEA Lymphoma Therapeutics Market by Treatment Type, 2023 - 2029, USD Million
- TABLE 325 LAMEA Immune Therapy Market by Country, 2019 - 2022, USD Million
- TABLE 326 LAMEA Immune Therapy Market by Country, 2023 - 2029, USD Million
- TABLE 327 LAMEA Target Therapy Market by Country, 2019 - 2022, USD Million
- TABLE 328 LAMEA Target Therapy Market by Country, 2023 - 2029, USD Million
- TABLE 329 LAMEA Chemotherapy Market by Country, 2019 - 2022, USD Million
- TABLE 330 LAMEA Chemotherapy Market by Country, 2023 - 2029, USD Million
- TABLE 331 LAMEA Radiation Therapy Market by Country, 2019 - 2022, USD Million
- TABLE 332 LAMEA Radiation Therapy Market by Country, 2023 - 2029, USD Million
- TABLE 333 LAMEA Lymphoma Therapeutics Market by Disease Type, 2019 - 2022, USD Million
- TABLE 334 LAMEA Lymphoma Therapeutics Market by Disease Type, 2023 - 2029, USD Million
- TABLE 335 LAMEA Non-Hodgkin Lymphoma Market by Country, 2019 - 2022, USD Million
- TABLE 336 LAMEA Non-Hodgkin Lymphoma Market by Country, 2023 - 2029, USD Million
- TABLE 337 LAMEA Hodgkin Lymphoma Market by Country, 2019 - 2022, USD Million
- TABLE 338 LAMEA Hodgkin Lymphoma Market by Country, 2023 - 2029, USD Million
- TABLE 339 LAMEA Lymphoma Therapeutics Market by Route of Administration, 2019 - 2022, USD Million
- TABLE 340 LAMEA Lymphoma Therapeutics Market by Route of Administration, 2023 - 2029, USD Million
- TABLE 341 LAMEA Injectable Market by Country, 2019 - 2022, USD Million
- TABLE 342 LAMEA Injectable Market by Country, 2023 - 2029, USD Million
- TABLE 343 LAMEA Oral Route Market by Country, 2019 - 2022, USD Million
- TABLE 344 LAMEA Oral Route Market by Country, 2023 - 2029, USD Million
- TABLE 345 LAMEA Lymphoma Therapeutics Market by Distribution Channel, 2019 - 2022, USD Million
- TABLE 346 LAMEA Lymphoma Therapeutics Market by Distribution Channel, 2023 - 2029, USD Million
- TABLE 347 LAMEA Hospital Pharmacies Market by Country, 2019 - 2022, USD Million
- TABLE 348 LAMEA Hospital Pharmacies Market by Country, 2023 - 2029, USD Million
- TABLE 349 LAMEA Retail Pharmacies Market by Country, 2019 - 2022, USD Million
- TABLE 350 LAMEA Retail Pharmacies Market by Country, 2023 - 2029, USD Million
- TABLE 351 LAMEA Others Market by Country, 2019 - 2022, USD Million
- TABLE 352 LAMEA Others Market by Country, 2023 - 2029, USD Million
- TABLE 353 LAMEA Lymphoma Therapeutics Market by Country, 2019 - 2022, USD Million
- TABLE 354 LAMEA Lymphoma Therapeutics Market by Country, 2023 - 2029, USD Million
- TABLE 355 Brazil Lymphoma Therapeutics Market, 2019 - 2022, USD Million
- TABLE 356 Brazil Lymphoma Therapeutics Market, 2023 - 2029, USD Million
- TABLE 357 Brazil Lymphoma Therapeutics Market by Treatment Type, 2019 - 2022, USD Million
- TABLE 358 Brazil Lymphoma Therapeutics Market by Treatment Type, 2023 - 2029, USD Million
- TABLE 359 Brazil Lymphoma Therapeutics Market by Disease Type, 2019 - 2022, USD Million
- TABLE 360 Brazil Lymphoma Therapeutics Market by Disease Type, 2023 - 2029, USD Million
- TABLE 361 Brazil Lymphoma Therapeutics Market by Route of Administration, 2019 - 2022, USD Million
- TABLE 362 Brazil Lymphoma Therapeutics Market by Route of Administration, 2023 - 2029, USD Million
- TABLE 363 Brazil Lymphoma Therapeutics Market by Distribution Channel, 2019 - 2022, USD Million
- TABLE 364 Brazil Lymphoma Therapeutics Market by Distribution Channel, 2023 - 2029, USD Million
- TABLE 365 Argentina Lymphoma Therapeutics Market, 2019 - 2022, USD Million
- TABLE 366 Argentina Lymphoma Therapeutics Market, 2023 - 2029, USD Million
- TABLE 367 Argentina Lymphoma Therapeutics Market by Treatment Type, 2019 - 2022, USD Million
- TABLE 368 Argentina Lymphoma Therapeutics Market by Treatment Type, 2023 - 2029, USD Million
- TABLE 369 Argentina Lymphoma Therapeutics Market by Disease Type, 2019 - 2022, USD Million
- TABLE 370 Argentina Lymphoma Therapeutics Market by Disease Type, 2023 - 2029, USD Million
- TABLE 371 Argentina Lymphoma Therapeutics Market by Route of Administration, 2019 - 2022, USD Million
- TABLE 372 Argentina Lymphoma Therapeutics Market by Route of Administration, 2023 - 2029, USD Million
- TABLE 373 Argentina Lymphoma Therapeutics Market by Distribution Channel, 2019 - 2022, USD Million
- TABLE 374 Argentina Lymphoma Therapeutics Market by Distribution Channel, 2023 - 2029, USD Million
- TABLE 375 UAE Lymphoma Therapeutics Market, 2019 - 2022, USD Million
- TABLE 376 UAE Lymphoma Therapeutics Market, 2023 - 2029, USD Million
- TABLE 377 UAE Lymphoma Therapeutics Market by Treatment Type, 2019 - 2022, USD Million
- TABLE 378 UAE Lymphoma Therapeutics Market by Treatment Type, 2023 - 2029, USD Million
- TABLE 379 UAE Lymphoma Therapeutics Market by Disease Type, 2019 - 2022, USD Million
- TABLE 380 UAE Lymphoma Therapeutics Market by Disease Type, 2023 - 2029, USD Million
- TABLE 381 UAE Lymphoma Therapeutics Market by Route of Administration, 2019 - 2022, USD Million
- TABLE 382 UAE Lymphoma Therapeutics Market by Route of Administration, 2023 - 2029, USD Million
- TABLE 383 UAE Lymphoma Therapeutics Market by Distribution Channel, 2019 - 2022, USD Million
- TABLE 384 UAE Lymphoma Therapeutics Market by Distribution Channel, 2023 - 2029, USD Million
- TABLE 385 Saudi Arabia Lymphoma Therapeutics Market, 2019 - 2022, USD Million
- TABLE 386 Saudi Arabia Lymphoma Therapeutics Market, 2023 - 2029, USD Million
- TABLE 387 Saudi Arabia Lymphoma Therapeutics Market by Treatment Type, 2019 - 2022, USD Million
- TABLE 388 Saudi Arabia Lymphoma Therapeutics Market by Treatment Type, 2023 - 2029, USD Million
- TABLE 389 Saudi Arabia Lymphoma Therapeutics Market by Disease Type, 2019 - 2022, USD Million
- TABLE 390 Saudi Arabia Lymphoma Therapeutics Market by Disease Type, 2023 - 2029, USD Million
- TABLE 391 Saudi Arabia Lymphoma Therapeutics Market by Route of Administration, 2019 - 2022, USD Million
- TABLE 392 Saudi Arabia Lymphoma Therapeutics Market by Route of Administration, 2023 - 2029, USD Million
- TABLE 393 Saudi Arabia Lymphoma Therapeutics Market by Distribution Channel, 2019 - 2022, USD Million
- TABLE 394 Saudi Arabia Lymphoma Therapeutics Market by Distribution Channel, 2023 - 2029, USD Million
- TABLE 395 South Africa Lymphoma Therapeutics Market, 2019 - 2022, USD Million
- TABLE 396 South Africa Lymphoma Therapeutics Market, 2023 - 2029, USD Million
- TABLE 397 South Africa Lymphoma Therapeutics Market by Treatment Type, 2019 - 2022, USD Million
- TABLE 398 South Africa Lymphoma Therapeutics Market by Treatment Type, 2023 - 2029, USD Million
- TABLE 399 South Africa Lymphoma Therapeutics Market by Disease Type, 2019 - 2022, USD Million
- TABLE 400 South Africa Lymphoma Therapeutics Market by Disease Type, 2023 - 2029, USD Million
- TABLE 401 South Africa Lymphoma Therapeutics Market by Route of Administration, 2019 - 2022, USD Million
- TABLE 402 South Africa Lymphoma Therapeutics Market by Route of Administration, 2023 - 2029, USD Million
- TABLE 403 South Africa Lymphoma Therapeutics Market by Distribution Channel, 2019 - 2022, USD Million
- TABLE 404 South Africa Lymphoma Therapeutics Market by Distribution Channel, 2023 - 2029, USD Million
- TABLE 405 Nigeria Lymphoma Therapeutics Market, 2019 - 2022, USD Million
- TABLE 406 Nigeria Lymphoma Therapeutics Market, 2023 - 2029, USD Million
- TABLE 407 Nigeria Lymphoma Therapeutics Market by Treatment Type, 2019 - 2022, USD Million
- TABLE 408 Nigeria Lymphoma Therapeutics Market by Treatment Type, 2023 - 2029, USD Million
- TABLE 409 Nigeria Lymphoma Therapeutics Market by Disease Type, 2019 - 2022, USD Million
- TABLE 410 Nigeria Lymphoma Therapeutics Market by Disease Type, 2023 - 2029, USD Million
- TABLE 411 Nigeria Lymphoma Therapeutics Market by Route of Administration, 2019 - 2022, USD Million
- TABLE 412 Nigeria Lymphoma Therapeutics Market by Route of Administration, 2023 - 2029, USD Million
- TABLE 413 Nigeria Lymphoma Therapeutics Market by Distribution Channel, 2019 - 2022, USD Million
- TABLE 414 Nigeria Lymphoma Therapeutics Market by Distribution Channel, 2023 - 2029, USD Million
- TABLE 415 Rest of LAMEA Lymphoma Therapeutics Market, 2019 - 2022, USD Million
- TABLE 416 Rest of LAMEA Lymphoma Therapeutics Market, 2023 - 2029, USD Million
- TABLE 417 Rest of LAMEA Lymphoma Therapeutics Market by Treatment Type, 2019 - 2022, USD Million
- TABLE 418 Rest of LAMEA Lymphoma Therapeutics Market by Treatment Type, 2023 - 2029, USD Million
- TABLE 419 Rest of LAMEA Lymphoma Therapeutics Market by Disease Type, 2019 - 2022, USD Million
- TABLE 420 Rest of LAMEA Lymphoma Therapeutics Market by Disease Type, 2023 - 2029, USD Million
- TABLE 421 Rest of LAMEA Lymphoma Therapeutics Market by Route of Administration, 2019 - 2022, USD Million
- TABLE 422 Rest of LAMEA Lymphoma Therapeutics Market by Route of Administration, 2023 - 2029, USD Million
- TABLE 423 Rest of LAMEA Lymphoma Therapeutics Market by Distribution Channel, 2019 - 2022, USD Million
- TABLE 424 Rest of LAMEA Lymphoma Therapeutics Market by Distribution Channel, 2023 - 2029, USD Million
- TABLE 425 Key Information - Bayer AG
- TABLE 426 Key information -Johnson & Johnson
- TABLE 427 Key Information - Gilead Sciences, Inc.
- TABLE 428 Key Information - Bristol Myers Squibb Company
- TABLE 429 Key Information - Pfizer, Inc.
- TABLE 430 KEY INFORMATION - AstraZeneca PLC
- TABLE 431 Key Information - Teva Pharmaceuticals Industries Ltd.
- TABLE 432 Key Information - Eli Lilly And Company
- TABLE 433 Key Information - Seagen Inc.
- TABLE 434 KEY INFORMATION - F. Hoffmann-La Roche Ltd.
List of Figures
- FIG 1 Methodology for the research
- FIG 2 KBV Cardinal Matrix
- FIG 3 Key Leading Strategies: Percentage Distribution (2019-2023)
- FIG 4 Global Lymphoma Therapeutics Market share, by Disease Type, 2022
- FIG 5 Global Lymphoma Therapeutics Market share, by Disease Type, 2029
- FIG 6 Global Lymphoma Therapeutics Market by Disease Type, 2019 - 2029, USD Million
- FIG 7 Global Lymphoma Therapeutics Market share, by Route of Administration, 2022
- FIG 8 Global Lymphoma Therapeutics Market share, by Route of Administration, 2029
- FIG 9 Global Lymphoma Therapeutics Market by Route of Administration, 2019 - 2029, USD Million
- FIG 10 Global Lymphoma Therapeutics Market share, by Distribution Channel, 2022
- FIG 11 Global Lymphoma Therapeutics Market share, by Distribution Channel, 2029
- FIG 12 Global Lymphoma Therapeutics Market by Distribution Channel, 2019 - 2029, USD Million
- FIG 13 Global Lymphoma Therapeutics Market share, by Region, 2022
- FIG 14 Global Lymphoma Therapeutics Market share, by Region, 2029
- FIG 15 Global Lymphoma Therapeutics Market by Region, 2019 - 2029, USD Million
- FIG 16 Swot analysis: bayer ag
- FIG 17 SWOT analysis: Johnson & Johnson
- FIG 18 Recent strategies and developments: Gilead Sciences, Inc.
- FIG 19 Recent strategies and developments: Bristol Myers Squibb Company
- FIG 20 Recent strategies and developments: Pfizer, Inc.
- FIG 21 Recent strategies and developments: AstraZeneca PLC
The Global Lymphoma Therapeutics Market size is expected to reach $24.9 billion by 2029, rising at a market growth of 7.8% CAGR during the forecast period.
The term "lymphoma therapeutics" refers to the numerous medical treatments and interventions that are intended to treat lymphoma, a form of cancer that impacts the lymphatic system, which is a component of the immune system of the body. Lymphoma is one of the most common types of cancer globally. The elimination of malignant cells, the prevention of the disease's progression, and an improvement in the patient's standard of life are the primary focuses of lymphoma treatment strategies.
The spleen, the thymus gland, lymph nodes (also known as lymph glands), and bone marrow are all elements that make up the lymphatic system. Lymphoma has the potential to affect not only these areas, but many other organs located throughout the body as well. Lymphoma patients have access to various treatment options, including radiation therapy, chemotherapy, immunotherapy, targeted therapy, and stem cell transplantation, among others.
The choice of treatment is determined not only by the type and stage of lymphoma but also by additional criteria, such as the patient's current state of health and medical history. Lymphoma treatments work toward the dual goals of inducing individuals with lymphoma into a state of long-term remission while also improving their chances of survival.
Cancer of the lymphatic system is referred to as lymphoma, and lymphoma is a subtype of cancer characterized by the fast proliferation of aberrant malignant cells. It typically affects the white blood cells (WBCs), also known as lymphocytes, in the lymph nodes, spleen, thymus, and bone marrow. This has the effect of reducing the body's ability to mount an immune response. As a result, the patient experiences symptoms such as swelling in the lymph nodes, high fever, loss of weight, shortness of breath, and weariness as a direct effect of the condition.
COVID-19 Impact Analysis
The pandemic negatively impacted the lymphoma therapeutics market due to delayed diagnosis and treatment and disruptions to clinical trials. Lymphoma therapeutics pose a challenge for healthcare professionals due to the potential risk of chemotherapeutic and immunosuppressive treatment exacerbating comorbid COVID-19 infections, which are crucial aspect of cancer therapy. Patients with B-cell non-Hodgkin's lymphoma (B-NHL), who have recently undergone treatment with anti-CD20 antibodies, are susceptible to severe COVID-19 disease.
Market Growth Factors
Technological advancement in the treatment options
Various treatment developments have been introduced in lymphoma therapeutics by focusing on TAAs; cancer immunotherapy has become a crucial part of cancer treatment. It does not produce unintended off-target effects and has several clinical advantages. This encourages the creation of highly effective, low-side-effect tailored recombinant vaccines for cancer immunotherapy. Immune checkpoint inhibitors (ICIs), recently developed, have changed cancer treatment and increased patient survival. ICIs tailored to checkpoint proteins, like CTLA-4 or PD-1, have been approved to treat several cancer types. These factors are propelling market growth.
Increasing cases of Lymphoma, raising the demand for therapeutics
Around half a million new cases of NHL were reported globally in 2018, accounting for 2.8% of all cancer diagnoses. The gender-specific age-standardized probability of developing NHL was found to be 6.7 in men and 4.7 in women. This indicates that men have a cumulative lifetime risk of 0.72%, while women have a risk of 0.35%. Furthermore, men's incidence was 7.8/100,000, and women's was 5.6/100,000 and 2.9/100,000 in high and low/medium human development index nations, respectively. Hence, the growing cases of Lymphoma, especially non-Hodgins Lymphoma (NHL), are expected to increase the demand for numerous lymphoma therapeutics boosting the market growth in the projected period.
Market Restraining Factors
The associated side effects of treatments
The treatment for lymphoma is associated with side effects. Some of them are digestive issues, "Chemo brain," itchy, painful, and dry skin, fatigue, nausea, and vomiting, hair loss, sleep issues, peripheral neuropathy (nerve injury), and oral mucositis (sore mouth). The risk of infection may rise after the treatment of lymphoma. Therefore, it's crucial to be aware of the warning signs and symptoms and how to get in touch with the medical team if necessary. Lack of specific blood cell types can result from cancer treatment. Low red blood cells, low white blood cells, and low platelets are all symptoms of anemia. These are expected to hinder the lymphoma therapeutics market growth in the projected period.
Disease Type Outlook
Based on disease Type, the lymphoma therapeutics market is segmented into Hodgkin lymphoma and non-Hodgkin lymphoma. The Hodgkin lymphoma segment acquired a significant revenue share in the lymphoma therapeutics market in 2022. The growth is attributed due to the reasons such as the rising prevalence of Hodgkin lymphoma, increased awareness of the disease, and the significant unmet needs of elderly patients and patients with relapsed or refractory (R/R) HL. The moderately aggressive cancer Hodgkin lymphoma can quickly spread throughout the body. Despite this, it's also one of the cancer forms that is most easily cured.
Treatment Type Outlook
On the basis of treatment Type, the lymphoma therapeutics market is divided into immune therapy, chemotherapy, target therapy and radiation therapy. The immune therapy segment held the highest revenue share in the lymphoma therapeutics market in 2022. The growth of immune therapy can be attributed to the progress in immunology, the wider accessibility of immune therapies, and the increasing number of product approvals globally. Immunotherapy has been found to be a highly successful treatment option with positive outcomes.
Route of Administration Outlook
By route of administration, the lymphoma therapeutics market is classified into oral route and injectable. The injectable segment witnessed the largest revenue share in the lymphoma therapeutics market in 2022. This is because the injection is administered subcutaneously and has a duration of 5-7 minutes. This method is significantly faster than intravenous administration. These products have been approved for usage in patients diagnosed with diffuse large B-cell lymphoma, follicular lymphoma, and chronic lymphocytic leukemia.
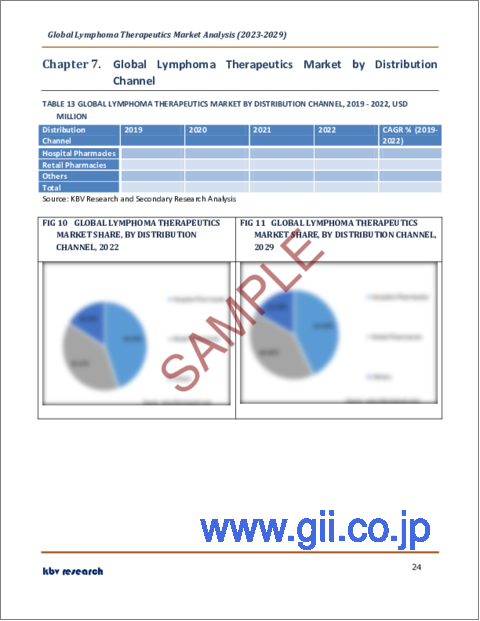
Distribution Channel Outlook
Based on the distribution channel, the lymphoma therapeutics market is bifurcated into hospital pharmacies, retail pharmacies and others. The retail pharmacies segment recorded a significant revenue share in the lymphoma therapeutics market in 2022. This is because retail pharmacies are responsible for the preparation and distribution of medications, as well as the counseling of customers regarding the proper use of medications and the provision of information regarding probable drug interactions. Also, customers can get advice from retail pharmacists regarding general health concerns as well as over-the-counter medications.
Regional Outlook
Region-wise, the lymphoma therapeutics market is analyzed across North America, Europe, Asia Pacific, and LAMEA. The North America region led the lymphoma therapeutics market by generating the maximum revenue share in 2022. This is due to an increase in lymphoma prevalence, advancements in lymphoma therapeutics, including targeted therapies and immunotherapies, and an increase in the number of new product releases by significant market players in this region. Additionally, the existence of important players, the accessibility of cutting-edge medications, the well-established healthcare system, and substantial R&D spending will surge the market growth in the region.
The major strategies followed by the market participants are Acquisitions. Based on the Analysis presented in the Cardinal matrix; Pfizer, Inc., Johnson & Johnson, and F. Hoffmann-La Roche Ltd. are the forerunners in the Lymphoma Therapeutics Market. Companies such as Eli Lilly And Company, Gilead Sciences, Inc., and Bristol Myers Squibb Company are some of the key innovators in Lymphoma Therapeutics Market.
The market research report covers the analysis of key stake holders of the market. Key companies profiled in the report include AstraZeneca PLC, Bayer AG, Bristol Myers Squibb Company, F. Hoffmann-La Roche Ltd., Johnson & Johnson, Gilead Sciences, Inc., Seagen, Inc., Teva Pharmaceutical Industries Ltd., Pfizer, Inc. and Eli Lilly And Company.
Recent Strategies Deployed in Lymphoma Therapeutics Market
Partnerships, Collaborations and Agreements:
Jun-2022: AstraZeneca came into collaboration with GRAIL, LLC, a healthcare company whose focus is to detect cancer early when it can be cured. The collaboration aimed to develop and commercialize companion diagnostic (CDx) assays for their utilization with AstraZeneca's therapies. The partnership first concentrates on creating complementary diagnostic tools to recognize people with high-risk, early-stage diseases. Over the following few years, it is anticipated that additional studies will be conducted across various indications. Patients enrolled in AstraZeneca's clinical trials will be tested using GRAIL's methylation platform.
Apr-2022: Teva Pharmaceuticals signed a partnership with Roche Pharma China for improving lymphoma treatments by integrating the respective strengths and resources for further expanding the availability of Treanda in China. Following the partnership, the latter company reinforced its hematology portfolio and expanded the panorama of lymphoma treatment. Moreover, the companies work together for promoting the standardization of lymphoma treatment in China.
Mergers and Acquisitions:
Jan-2023: AstraZeneca acquired Neogene Therapeutics, Inc., a clinical-stage biotechnology company. Neogene's experience in TCR-T discovery, development, and manufacturing would support AstraZeneca's vision to change patient outcomes as part of a shared mission to provide cell treatments to patients with solid tumors. With the help of this acquisition, the former company's internal oncology cell therapy team will have a rare opportunity to collaborate with world-renowned experts in T-cell receptor biology and cell therapy manufacturing, opening up new avenues for the treatment of cancer.
Aug-2022: AstraZeneca took over TeneoTwo, Inc. (TeneoTwo)i, with TNB-486, Phase I clinical-stage CD19/CD3 T-cell engager, which is currently under evaluation in relapsed and refractory B-cell non-Hodgkin lymphoma. With the acquisition of TNB-486, a potential novel treatment for B-cell hemotologic malignancies like diffuse large B-cell lymphoma and follicular lymphoma is being created. Building on the success of Calquence (acalabrutinib), TNB-486 broadens AstraZeneca's hematology portfolio, which includes several therapeutic modalities and routes to target a variety of blood cancers.
Aug-2022: Bristol Myers Squibb completed the acquisition of Turning Point Therapeutics, a pharmaceutical company engaged in the discovery and development of precision medicine for cancer and other diseases. The acquisition added a product line of investigational medicines designed for targeting the most common mutations related to oncogenesis, to Bristol Myers' portfolio.
Nov-2021: Pfizer acquired Trillium Therapeutics, a clinical-stage immuno-oncology company that develops innovative therapies for cancer treatment. The acquisition added a biologics portfolio that enhanced the patient's innate immune system ability to detect and destroy cancer cells.
Product Launches and Expansions:
Mar-2023: Teva Pharmaceuticals together with NATCO Pharma Limited, announced the additional strengths for the generic version of Revlimid®1 (lenalidomide capsules), in 2.5 mg, and 20 mg strengths, in the United States. Teva's lenalidomide capsules can be utilized for the treatment of multiple myeloma when combined with dexamethasone, specific myelodysplastic syndromes, and mantle cell lymphoma after receiving specific prior treatment.
Trials and Approvals:
Mar-2023: AstraZeneca received approval from National Medical Products Administration (NMPA) in China for Calquence (acalabrutinib), a next-generation, selective Bruton's tyrosine kinase (BTK) inhibitor. This inhibitor is indicated for the treatment of mantale cell lymphoma in adult patients who have already obtained the therapy at least once.
Jan-2023: Eli Lilly and Company announced that U.S. FDA approved Jaypirca™ (pirtobrutinib), the First and Only Non-Covalent (Reversible) BTK Inhibitor. The inhibitor would be used for the treatment of Relapsed or Refractory Mantle Cell Lymphoma After At least Two Lines of Systemic Therapy, Including a BTK Inhibitor, among adult patients.
Nov-2022: Seagen announced that U.S. FDA approved ADCETRIS® (brentuximab vedotin), the new indication for children with untreated high-risk Hodgkin lymphoma. It is suitable for the treatment of pediatric patients 2 years and above.
Aug-2022: AstraZeneca got the approval from US Food and Drug Administration (FDA) for its new tablet formulation of Calquence (acalabrutinib). This tablet formulation provides enhanced flexibility to patients and physicians when making treatment plans for chronic lymphocytic leukemia and mantle cell lymphoma.
Jun-2022: Bristol Myers Squibb got approval from U.S. FDA for CAR T Cell Therapy Breyanzi® for Relapsed or Refractory Large B-cell Lymphoma after a Prior Therapy once. This therapy is indicated for the treatment of follicular lymphoma grade 3B, primary mediastinal large B-cell lymphoma, large B-cell lymphoma (LBCL), including diffuse large B-cell lymphoma (DLBCL) not otherwise specified (including DLBCL arising from indolent lymphoma), and high-grade B-cell lymphoma, among adult patients.
Apr-2022: Kite, a Gilead Company, got approval from U.S. Food and Drug Administration (FDA) for Yescarta® (axicabtagene ciloleucel) CAR T-cell therapy. The therapy is beneficial for adult patients with large B-cell lymphoma that is refractory to first-line chemoimmunotherapy or that relapses within 12 months of first-line chemoimmunotherapy.
Feb-2021: Bristol Myers received U.S. Food and Drug Administration approval for Breyanzi (lisocabtagene maraleucel), a cell-based gene therapy. The therapy is indicated for the treatment of adult patients suffering from large B-cell lymphoma. This therapy is suitable for patients who have not responded to, or who have relapsed after, at least two other types of systemic treatment.
Jan-2021: Pfizer got U.S. Food and Drug Administration (FDA) approval for the supplemental New Drug Application (sNDA) for XALKORI® (crizotinib). This drug would be utilized for the treatment of pediatric patients 1 year and older and young adults with refractory or relapsed, systemic anaplastic large cell lymphoma (ALCL) that is anaplastic lymphoma kinase (ALK)-positive.
Scope of the Study
Market Segments covered in the Report:
By Treatment Type
- Immune Therapy
- Target Therapy
- Chemotherapy
- Radiation Therapy
By Disease Type
- Non-Hodgkin Lymphoma
- Hodgkin Lymphoma
By Route of Administration
- Injectable
- Oral Route
By Distribution Channel
- Hospital Pharmacies
- Retail Pharmacies
- Others
By Geography
- North America
- US
- Canada
- Mexico
- Rest of North America
- Europe
- Germany
- UK
- France
- Russia
- Spain
- Italy
- Rest of Europe
- Asia Pacific
- China
- Japan
- India
- South Korea
- Singapore
- Malaysia
- Rest of Asia Pacific
- LAMEA
- Brazil
- Argentina
- UAE
- Saudi Arabia
- South Africa
- Nigeria
- Rest of LAMEA
Companies Profiled
- AstraZeneca PLC
- Bayer AG
- Bristol Myers Squibb Company
- F. Hoffmann-La Roche Ltd.
- Johnson & Johnson
- Gilead Sciences, Inc.
- Seagen, Inc.
- Teva Pharmaceutical Industries Ltd.
- Pfizer, Inc.
- Eli Lilly And Company
Unique Offerings from KBV Research
- Exhaustive coverage
- Highest number of market tables and figures
- Subscription based model available
- Guaranteed best price
- Assured post sales research support with 10% customization free
Table of Contents
Chapter 1. Market Scope & Methodology
- 1.1 Market Definition
- 1.2 Objectives
- 1.3 Market Scope
- 1.4 Segmentation
- 1.4.1 Global Lymphoma Therapeutics Market, by Treatment Type
- 1.4.2 Global Lymphoma Therapeutics Market, by Disease Type
- 1.4.3 Global Lymphoma Therapeutics Market, by Route of Administration
- 1.4.4 Global Lymphoma Therapeutics Market, by Distribution Channel
- 1.4.5 Global Lymphoma Therapeutics Market, by Geography
- 1.5 Methodology for the research
Chapter 2. Market Overview
- 2.1 Introduction
- 2.1.1 Overview
- 2.1.1.1 Market composition & scenario
- 2.1.1 Overview
- 2.2 Key Factors Impacting the Market
- 2.2.1 Market Drivers
- 2.2.2 Market Restraints
Chapter 3. Competition Analysis - Global
- 3.1 KBV Cardinal Matrix
- 3.2 Recent Industry Wide Strategic Developments
- 3.2.1 Partnerships, Collaborations and Agreements
- 3.2.2 Product Launches and Product Expansions
- 3.2.3 Acquisition and Mergers
- 3.2.4 Approvals and Trials
- 3.3 Top Winning Strategies
- 3.3.1 Key Leading Strategies: Percentage Distribution (2019-2023)
Chapter 4. Global Lymphoma Therapeutics Market by Treatment Type
- 4.1 Global Immune Therapy Market by Region
- 4.2 Global Target Therapy Market by Region
- 4.3 Global Chemotherapy Market by Region
- 4.4 Global Radiation Therapy Market by Region
Chapter 5. Global Lymphoma Therapeutics Market by Disease Type
- 5.1 Global Non-Hodgkin Lymphoma Market by Region
- 5.2 Global Hodgkin Lymphoma Market by Region
Chapter 6. Global Lymphoma Therapeutics Market by Route of Administration
- 6.1 Global Injectable Market by Region
- 6.2 Global Oral Route Market by Region
Chapter 7. Global Lymphoma Therapeutics Market by Distribution Channel
- 7.1 Global Hospital Pharmacies Market by Region
- 7.2 Global Retail Pharmacies Market by Region
- 7.3 Global Others Market by Region
Chapter 8. Global Lymphoma Therapeutics Market by Region
- 8.1 North America Lymphoma Therapeutics Market
- 8.1.1 North America Lymphoma Therapeutics Market by Treatment Type
- 8.1.1.1 North America Immune Therapy Market by Country
- 8.1.1.2 North America Target Therapy Market by Country
- 8.1.1.3 North America Chemotherapy Market by Country
- 8.1.1.4 North America Radiation Therapy Market by Country
- 8.1.2 North America Lymphoma Therapeutics Market by Disease Type
- 8.1.2.1 North America Non-Hodgkin Lymphoma Market by Country
- 8.1.2.2 North America Hodgkin Lymphoma Market by Country
- 8.1.3 North America Lymphoma Therapeutics Market by Route of Administration
- 8.1.3.1 North America Injectable Market by Country
- 8.1.3.2 North America Oral Route Market by Country
- 8.1.4 North America Lymphoma Therapeutics Market by Distribution Channel
- 8.1.4.1 North America Hospital Pharmacies Market by Country
- 8.1.4.2 North America Retail Pharmacies Market by Country
- 8.1.4.3 North America Others Market by Country
- 8.1.5 North America Lymphoma Therapeutics Market by Country
- 8.1.5.1 US Lymphoma Therapeutics Market
- 8.1.5.1.1 US Lymphoma Therapeutics Market by Treatment Type
- 8.1.5.1.2 US Lymphoma Therapeutics Market by Disease Type
- 8.1.5.1.3 US Lymphoma Therapeutics Market by Route of Administration
- 8.1.5.1.4 US Lymphoma Therapeutics Market by Distribution Channel
- 8.1.5.2 Canada Lymphoma Therapeutics Market
- 8.1.5.2.1 Canada Lymphoma Therapeutics Market by Treatment Type
- 8.1.5.2.2 Canada Lymphoma Therapeutics Market by Disease Type
- 8.1.5.2.3 Canada Lymphoma Therapeutics Market by Route of Administration
- 8.1.5.2.4 Canada Lymphoma Therapeutics Market by Distribution Channel
- 8.1.5.3 Mexico Lymphoma Therapeutics Market
- 8.1.5.3.1 Mexico Lymphoma Therapeutics Market by Treatment Type
- 8.1.5.3.2 Mexico Lymphoma Therapeutics Market by Disease Type
- 8.1.5.3.3 Mexico Lymphoma Therapeutics Market by Route of Administration
- 8.1.5.3.4 Mexico Lymphoma Therapeutics Market by Distribution Channel
- 8.1.5.4 Rest of North America Lymphoma Therapeutics Market
- 8.1.5.4.1 Rest of North America Lymphoma Therapeutics Market by Treatment Type
- 8.1.5.4.2 Rest of North America Lymphoma Therapeutics Market by Disease Type
- 8.1.5.4.3 Rest of North America Lymphoma Therapeutics Market by Route of Administration
- 8.1.5.4.4 Rest of North America Lymphoma Therapeutics Market by Distribution Channel
- 8.1.5.1 US Lymphoma Therapeutics Market
- 8.1.1 North America Lymphoma Therapeutics Market by Treatment Type
- 8.2 Europe Lymphoma Therapeutics Market
- 8.2.1 Europe Lymphoma Therapeutics Market by Treatment Type
- 8.2.1.1 Europe Immune Therapy Market by Country
- 8.2.1.2 Europe Target Therapy Market by Country
- 8.2.1.3 Europe Chemotherapy Market by Country
- 8.2.1.4 Europe Radiation Therapy Market by Country
- 8.2.2 Europe Lymphoma Therapeutics Market by Disease Type
- 8.2.2.1 Europe Non-Hodgkin Lymphoma Market by Country
- 8.2.2.2 Europe Hodgkin Lymphoma Market by Country
- 8.2.3 Europe Lymphoma Therapeutics Market by Route of Administration
- 8.2.3.1 Europe Injectable Market by Country
- 8.2.3.2 Europe Oral Route Market by Country
- 8.2.4 Europe Lymphoma Therapeutics Market by Distribution Channel
- 8.2.4.1 Europe Hospital Pharmacies Market by Country
- 8.2.4.2 Europe Retail Pharmacies Market by Country
- 8.2.4.3 Europe Others Market by Country
- 8.2.5 Europe Lymphoma Therapeutics Market by Country
- 8.2.5.1 Germany Lymphoma Therapeutics Market
- 8.2.5.1.1 Germany Lymphoma Therapeutics Market by Treatment Type
- 8.2.5.1.2 Germany Lymphoma Therapeutics Market by Disease Type
- 8.2.5.1.3 Germany Lymphoma Therapeutics Market by Route of Administration
- 8.2.5.1.4 Germany Lymphoma Therapeutics Market by Distribution Channel
- 8.2.5.2 UK Lymphoma Therapeutics Market
- 8.2.5.2.1 UK Lymphoma Therapeutics Market by Treatment Type
- 8.2.5.2.2 UK Lymphoma Therapeutics Market by Disease Type
- 8.2.5.2.3 UK Lymphoma Therapeutics Market by Route of Administration
- 8.2.5.2.4 UK Lymphoma Therapeutics Market by Distribution Channel
- 8.2.5.3 France Lymphoma Therapeutics Market
- 8.2.5.3.1 France Lymphoma Therapeutics Market by Treatment Type
- 8.2.5.3.2 France Lymphoma Therapeutics Market by Disease Type
- 8.2.5.3.3 France Lymphoma Therapeutics Market by Route of Administration
- 8.2.5.3.4 France Lymphoma Therapeutics Market by Distribution Channel
- 8.2.5.4 Russia Lymphoma Therapeutics Market
- 8.2.5.4.1 Russia Lymphoma Therapeutics Market by Treatment Type
- 8.2.5.4.2 Russia Lymphoma Therapeutics Market by Disease Type
- 8.2.5.4.3 Russia Lymphoma Therapeutics Market by Route of Administration
- 8.2.5.4.4 Russia Lymphoma Therapeutics Market by Distribution Channel
- 8.2.5.5 Spain Lymphoma Therapeutics Market
- 8.2.5.5.1 Spain Lymphoma Therapeutics Market by Treatment Type
- 8.2.5.5.2 Spain Lymphoma Therapeutics Market by Disease Type
- 8.2.5.5.3 Spain Lymphoma Therapeutics Market by Route of Administration
- 8.2.5.5.4 Spain Lymphoma Therapeutics Market by Distribution Channel
- 8.2.5.6 Italy Lymphoma Therapeutics Market
- 8.2.5.6.1 Italy Lymphoma Therapeutics Market by Treatment Type
- 8.2.5.6.2 Italy Lymphoma Therapeutics Market by Disease Type
- 8.2.5.6.3 Italy Lymphoma Therapeutics Market by Route of Administration
- 8.2.5.6.4 Italy Lymphoma Therapeutics Market by Distribution Channel
- 8.2.5.7 Rest of Europe Lymphoma Therapeutics Market
- 8.2.5.7.1 Rest of Europe Lymphoma Therapeutics Market by Treatment Type
- 8.2.5.7.2 Rest of Europe Lymphoma Therapeutics Market by Disease Type
- 8.2.5.7.3 Rest of Europe Lymphoma Therapeutics Market by Route of Administration
- 8.2.5.7.4 Rest of Europe Lymphoma Therapeutics Market by Distribution Channel
- 8.2.5.1 Germany Lymphoma Therapeutics Market
- 8.2.1 Europe Lymphoma Therapeutics Market by Treatment Type
- 8.3 Asia Pacific Lymphoma Therapeutics Market
- 8.3.1 Asia Pacific Lymphoma Therapeutics Market by Treatment Type
- 8.3.1.1 Asia Pacific Immune Therapy Market by Country
- 8.3.1.2 Asia Pacific Target Therapy Market by Country
- 8.3.1.3 Asia Pacific Chemotherapy Market by Country
- 8.3.1.4 Asia Pacific Radiation Therapy Market by Country
- 8.3.2 Asia Pacific Lymphoma Therapeutics Market by Disease Type
- 8.3.2.1 Asia Pacific Non-Hodgkin Lymphoma Market by Country
- 8.3.2.2 Asia Pacific Hodgkin Lymphoma Market by Country
- 8.3.3 Asia Pacific Lymphoma Therapeutics Market by Route of Administration
- 8.3.3.1 Asia Pacific Injectable Market by Country
- 8.3.3.2 Asia Pacific Oral Route Market by Country
- 8.3.4 Asia Pacific Lymphoma Therapeutics Market by Distribution Channel
- 8.3.4.1 Asia Pacific Hospital Pharmacies Market by Country
- 8.3.4.2 Asia Pacific Retail Pharmacies Market by Country
- 8.3.4.3 Asia Pacific Others Market by Country
- 8.3.5 Asia Pacific Lymphoma Therapeutics Market by Country
- 8.3.5.1 China Lymphoma Therapeutics Market
- 8.3.5.1.1 China Lymphoma Therapeutics Market by Treatment Type
- 8.3.5.1.2 China Lymphoma Therapeutics Market by Disease Type
- 8.3.5.1.3 China Lymphoma Therapeutics Market by Route of Administration
- 8.3.5.1.4 China Lymphoma Therapeutics Market by Distribution Channel
- 8.3.5.2 Japan Lymphoma Therapeutics Market
- 8.3.5.2.1 Japan Lymphoma Therapeutics Market by Treatment Type
- 8.3.5.2.2 Japan Lymphoma Therapeutics Market by Disease Type
- 8.3.5.2.3 Japan Lymphoma Therapeutics Market by Route of Administration
- 8.3.5.2.4 Japan Lymphoma Therapeutics Market by Distribution Channel
- 8.3.5.3 India Lymphoma Therapeutics Market
- 8.3.5.3.1 India Lymphoma Therapeutics Market by Treatment Type
- 8.3.5.3.2 India Lymphoma Therapeutics Market by Disease Type
- 8.3.5.3.3 India Lymphoma Therapeutics Market by Route of Administration
- 8.3.5.3.4 India Lymphoma Therapeutics Market by Distribution Channel
- 8.3.5.4 South Korea Lymphoma Therapeutics Market
- 8.3.5.4.1 South Korea Lymphoma Therapeutics Market by Treatment Type
- 8.3.5.4.2 South Korea Lymphoma Therapeutics Market by Disease Type
- 8.3.5.4.3 South Korea Lymphoma Therapeutics Market by Route of Administration
- 8.3.5.4.4 South Korea Lymphoma Therapeutics Market by Distribution Channel
- 8.3.5.5 Singapore Lymphoma Therapeutics Market
- 8.3.5.5.1 Singapore Lymphoma Therapeutics Market by Treatment Type
- 8.3.5.5.2 Singapore Lymphoma Therapeutics Market by Disease Type
- 8.3.5.5.3 Singapore Lymphoma Therapeutics Market by Route of Administration
- 8.3.5.5.4 Singapore Lymphoma Therapeutics Market by Distribution Channel
- 8.3.5.6 Malaysia Lymphoma Therapeutics Market
- 8.3.5.6.1 Malaysia Lymphoma Therapeutics Market by Treatment Type
- 8.3.5.6.2 Malaysia Lymphoma Therapeutics Market by Disease Type
- 8.3.5.6.3 Malaysia Lymphoma Therapeutics Market by Route of Administration
- 8.3.5.6.4 Malaysia Lymphoma Therapeutics Market by Distribution Channel
- 8.3.5.7 Rest of Asia Pacific Lymphoma Therapeutics Market
- 8.3.5.7.1 Rest of Asia Pacific Lymphoma Therapeutics Market by Treatment Type
- 8.3.5.7.2 Rest of Asia Pacific Lymphoma Therapeutics Market by Disease Type
- 8.3.5.7.3 Rest of Asia Pacific Lymphoma Therapeutics Market by Route of Administration
- 8.3.5.7.4 Rest of Asia Pacific Lymphoma Therapeutics Market by Distribution Channel
- 8.3.5.1 China Lymphoma Therapeutics Market
- 8.3.1 Asia Pacific Lymphoma Therapeutics Market by Treatment Type
- 8.4 LAMEA Lymphoma Therapeutics Market
- 8.4.1 LAMEA Lymphoma Therapeutics Market by Treatment Type
- 8.4.1.1 LAMEA Immune Therapy Market by Country
- 8.4.1.2 LAMEA Target Therapy Market by Country
- 8.4.1.3 LAMEA Chemotherapy Market by Country
- 8.4.1.4 LAMEA Radiation Therapy Market by Country
- 8.4.2 LAMEA Lymphoma Therapeutics Market by Disease Type
- 8.4.2.1 LAMEA Non-Hodgkin Lymphoma Market by Country
- 8.4.2.2 LAMEA Hodgkin Lymphoma Market by Country
- 8.4.3 LAMEA Lymphoma Therapeutics Market by Route of Administration
- 8.4.3.1 LAMEA Injectable Market by Country
- 8.4.3.2 LAMEA Oral Route Market by Country
- 8.4.4 LAMEA Lymphoma Therapeutics Market by Distribution Channel
- 8.4.4.1 LAMEA Hospital Pharmacies Market by Country
- 8.4.4.2 LAMEA Retail Pharmacies Market by Country
- 8.4.4.3 LAMEA Others Market by Country
- 8.4.5 LAMEA Lymphoma Therapeutics Market by Country
- 8.4.5.1 Brazil Lymphoma Therapeutics Market
- 8.4.5.1.1 Brazil Lymphoma Therapeutics Market by Treatment Type
- 8.4.5.1.2 Brazil Lymphoma Therapeutics Market by Disease Type
- 8.4.5.1.3 Brazil Lymphoma Therapeutics Market by Route of Administration
- 8.4.5.1.4 Brazil Lymphoma Therapeutics Market by Distribution Channel
- 8.4.5.2 Argentina Lymphoma Therapeutics Market
- 8.4.5.2.1 Argentina Lymphoma Therapeutics Market by Treatment Type
- 8.4.5.2.2 Argentina Lymphoma Therapeutics Market by Disease Type
- 8.4.5.2.3 Argentina Lymphoma Therapeutics Market by Route of Administration
- 8.4.5.2.4 Argentina Lymphoma Therapeutics Market by Distribution Channel
- 8.4.5.3 UAE Lymphoma Therapeutics Market
- 8.4.5.3.1 UAE Lymphoma Therapeutics Market by Treatment Type
- 8.4.5.3.2 UAE Lymphoma Therapeutics Market by Disease Type
- 8.4.5.3.3 UAE Lymphoma Therapeutics Market by Route of Administration
- 8.4.5.3.4 UAE Lymphoma Therapeutics Market by Distribution Channel
- 8.4.5.4 Saudi Arabia Lymphoma Therapeutics Market
- 8.4.5.4.1 Saudi Arabia Lymphoma Therapeutics Market by Treatment Type
- 8.4.5.4.2 Saudi Arabia Lymphoma Therapeutics Market by Disease Type
- 8.4.5.4.3 Saudi Arabia Lymphoma Therapeutics Market by Route of Administration
- 8.4.5.4.4 Saudi Arabia Lymphoma Therapeutics Market by Distribution Channel
- 8.4.5.5 South Africa Lymphoma Therapeutics Market
- 8.4.5.5.1 South Africa Lymphoma Therapeutics Market by Treatment Type
- 8.4.5.5.2 South Africa Lymphoma Therapeutics Market by Disease Type
- 8.4.5.5.3 South Africa Lymphoma Therapeutics Market by Route of Administration
- 8.4.5.5.4 South Africa Lymphoma Therapeutics Market by Distribution Channel
- 8.4.5.6 Nigeria Lymphoma Therapeutics Market
- 8.4.5.6.1 Nigeria Lymphoma Therapeutics Market by Treatment Type
- 8.4.5.6.2 Nigeria Lymphoma Therapeutics Market by Disease Type
- 8.4.5.6.3 Nigeria Lymphoma Therapeutics Market by Route of Administration
- 8.4.5.6.4 Nigeria Lymphoma Therapeutics Market by Distribution Channel
- 8.4.5.7 Rest of LAMEA Lymphoma Therapeutics Market
- 8.4.5.7.1 Rest of LAMEA Lymphoma Therapeutics Market by Treatment Type
- 8.4.5.7.2 Rest of LAMEA Lymphoma Therapeutics Market by Disease Type
- 8.4.5.7.3 Rest of LAMEA Lymphoma Therapeutics Market by Route of Administration
- 8.4.5.7.4 Rest of LAMEA Lymphoma Therapeutics Market by Distribution Channel
- 8.4.5.1 Brazil Lymphoma Therapeutics Market
- 8.4.1 LAMEA Lymphoma Therapeutics Market by Treatment Type
Chapter 9. Company Profiles
- 9.1 Bayer AG
- 9.1.1 Company Overview
- 9.1.2 Financial Analysis
- 9.1.3 Segmental and Regional Analysis
- 9.1.4 Research & Development Expense
- 9.1.5 Recent strategies and developments:
- 9.1.5.1 Approvals and Trials:
- 9.1.6 SWOT Analysis
- 9.2 Johnson & Johnson
- 9.2.1 Company Overview
- 9.2.2 Financial Analysis
- 9.2.3 Segmental &Regional Analysis
- 9.2.4 Research & Development Expenses
- 9.2.5 SWOT Analysis
- 9.3 Gilead Sciences, Inc.
- 9.3.1 Company overview
- 9.3.2 Financial Analysis
- 9.3.3 Research & Development Expenses
- 9.3.4 Recent strategies and developments:
- 9.3.4.1 Partnerships, Collaborations, and Agreements:
- 9.3.4.2 Acquisition and Mergers:
- 9.3.4.3 Approvals and Trials:
- 9.4 Bristol Myers Squibb Company
- 9.4.1 Company Overview
- 9.4.2 Financial Analysis
- 9.4.3 Regional Analysis
- 9.4.4 Research & Development Expenses
- 9.4.5 Recent strategies and developments:
- 9.4.5.1 Acquisition and Mergers:
- 9.4.5.2 Approvals and Trials:
- 9.5 Pfizer, Inc.
- 9.5.1 Company Overview
- 9.5.2 Financial Analysis
- 9.5.3 Regional & Segmental Analysis
- 9.5.4 Research & Development Expense
- 9.5.5 Recent strategies and developments:
- 9.5.5.1 Acquisition and Mergers:
- 9.5.5.2 Approvals and Trials:
- 9.6 AstraZeneca PLC
- 9.6.1 Company Overview
- 9.6.2 Financial Analysis
- 9.6.3 Regional Analysis
- 9.6.4 Research & Development Expenses
- 9.6.5 Recent strategies and developments:
- 9.6.5.1 Partnerships, Collaborations, and Agreements:
- 9.6.5.2 Acquisition and Mergers:
- 9.6.5.3 Approvals and Trials:
- 9.7 Teva Pharmaceutical Industries Ltd.
- 9.7.1 Company Overview
- 9.7.2 Financial Analysis
- 9.7.3 Regional Analysis
- 9.7.4 Research & Development Expenses
- 9.7.5 Recent strategies and developments:
- 9.7.5.1 Partnerships, Collaborations, and Agreements:
- 9.7.5.2 Product Launches and Product Expansions:
- 9.8 Eli Lilly And Company
- 9.8.1 Company Overview
- 9.8.2 Financial Analysis
- 9.8.3 Regional Analysis
- 9.8.4 Research & Development Expenses
- 9.8.5 Recent strategies and developments:
- 9.8.5.1 Acquisition and Mergers:
- 9.8.5.2 Approvals and Trials:
- 9.9 Seagen, Inc.
- 9.9.1 Company Overview
- 9.9.2 Financial Analysis
- 9.9.3 Research & Development Expenses
- 9.9.4 Recent strategies and developments:
- 9.9.4.1 Approvals and Trials:
- 9.10. F. Hoffmann-La Roche Ltd.
- 9.10.1 Company Overview
- 9.10.2 Financial Analysis
- 9.10.3 Segmental and Regional Analysis
- 9.10.4 Research & Development Expense