|
|
市場調査レポート
商品コード
1261527
POSソフトウェアの世界市場規模、シェア、産業動向分析レポートアプリケーション別、展開モード別、組織規模別、エンドユーザー別、地域別展望と予測、2022年~2028年Global Point-of-Sale Software Market Size, Share & Industry Trends Analysis Report By Application, By Deployment Mode, By Organization Size, By End User, By Regional Outlook and Forecast, 2022 - 2028 |
||||||
|
|
|||||||


| POSソフトウェアの世界市場規模、シェア、産業動向分析レポートアプリケーション別、展開モード別、組織規模別、エンドユーザー別、地域別展望と予測、2022年~2028年 |
|
出版日: 2023年03月31日
発行: KBV Research
ページ情報: 英文 266 Pages
納期: 即納可能
|
- 全表示
- 概要
- 図表
- 目次
POSソフトウェア市場規模は、2028年には200億米ドルに達し、予測期間中にCAGR10.6%の市場成長率で上昇すると予測されています。
ビジネスが多様化した結果、より優れた機能と分析機能を備えたPOSシステムのニーズが飛躍的に高まっています。これらのツールは、業務担当者、顧客、支払い、請求書を効率的に処理するのに役立ちます。さらに、これらのソリューションは、ビジネスの在庫、顧客、支払い、および労働者を効果的に管理するためにユーザーを支援します。
POSソフトウェアは、様々なビジネスプロセスを処理し、適切なオペレーティングシステムを搭載したデスクトップ、ノートパソコン、ラップトップ、またはタブレットにインストールする必要があります。クラウドベースのソリューションの人気が高まっているため、クラウドベースのモバイルPOSソフトウェアへの需要が高まっています。ウェブブラウザやインターネット経由でアクセスできるため、ウェブベースのPOSソリューションも中小企業の間で人気を博しています。
COVID-19影響度分析
POSソフトは驚異的な発展を遂げています。COVID-19の大流行は、エンドユーザーが現在のPOS技術を使用しなければならない企業環境を一変させました。数多くのeコマースや小売りのプラットフォームが、オンライン注文や決済を容易にするために、販売時点情報管理ソフトウェア・ソリューションを変更し、採用しています。POSソフトウェアの統合的な分析は、変化する消費者の期待に応え、市場の変化に適応し、将来のロックダウンや同様の状況に備えるために役立ちます。
市場の成長要因
非現金取引への嗜好性が高まっている
数多くの中央銀行や政府系金融機関が、Androidシステム向けのPOSを促進するためのインセンティブやサポートを提供しており、これがモバイルPOSの需要増加に大きく貢献すると予想されます。コンピュータ化された決済システムの需要が急増していることに加え、タブレット型コンピュータの人気が高まっていることも、現代市場におけるPOSタブレットの展望を後押ししています。過去10年間、インテリジェントな電子機器の利用が増加していることも、POSソフトウェア市場を拡大させています。
中小企業におけるPOSソリューションの採用増加
ワイヤレスPOSシステムは、モバイルカードリーダーを介してスマートフォンやタブレット端末と相互接続する技術的能力を備えているため、いくつかの分野で導入が進んでいます。また、モバイルPOSシステムの導入コストの低さ、長期運用に向けた付加価値サービスの提供能力などが、加盟店や小売店の注目を集める主な要因となっています。さらに、透明性の高い価格設定や送金情報の伝達が可能であることから、公的なガバナンスシステムが最も効果的なモバイルPOSの導入に有利に働く。このような理由から、POSソフトウェアの市場は予測期間を通じて拡大すると予想されます。
市場の抑制要因
高まるデータセキュリティへの懸念
小売業のPOSシステムは、デバイスの誤作動、フィッシング、スキミング、ソフトウェアやネットワークの脆弱性など、セキュリティ上の欠陥の影響を受けやすくなっています。安全でないネットワークにより、ハッカーはインフラに簡単に侵入し、ビジネスアカウントや顧客のクレジットカード情報などの重要な記録にアクセスすることができます。ネットワークが十分に保護されていても、デバイスもまた保護されなければなりません。そのため、POS端末を導入する際には、セキュリティ機能が組み込まれた技術的ソリューションを選択することが重要です。また、高度化する技術の導入や業務システム統合の拡大により、データ盗難やサイバー攻撃などの危険性が高まっています。
アプリケーションの展望
アプリケーションに基づき、POSソフトウェア市場は、固定POS、モバイルPOSに区分されます。2021年、POSソフトウェア市場では、固定式POS分野が最も高い収益シェアを占めています。固定POSソリューションは、モバイルPOSよりも優れた機能と性能を提供するため、現在、ほとんどの実店舗の小売業者とレストランは、固定POSを好んで使用しています。これが、このセグメントの上昇の原因となっています。また、固定式POSシステムには、在庫管理、ビジネス機能、キャッシュドロワー、スタッフのタイムクロック、ロイヤリティプログラム、ギフトカード管理などの利点があるため、消費者は固定式POSシステムの利用を好んでいます。
デプロイメントモードの展望
展開モードに基づいて、POSソフトウェア市場はクラウドとオンプレミスに細分化されます。クラウドベースセグメントは、2021年のPOSソフトウェア市場で顕著な収益シェアを記録しました。技術の発展に伴い、クラウドベースの展開が勢いを増し始めています。さらに、小型のデバイスを使用してスピーディーな決済サービスを行うことができるため、モバイルPOSシステム用のソフトウェアも人気を集めています。また、月額課金という手軽さも、コスト意識の高いエンドユーザーにとってクラウド型ソフトの需要を高めています。
組織規模の見通し
組織規模別では、POSソフトウェア市場は大企業と中小企業に二分されます。2021年には、大企業向け地域が最大の収益シェアを獲得し、POSソフトウェア市場をリードしました。大企業がキャッシュフローや事業運営を処理するためにカスタマイズされたPOSソフトウェアソリューションを求めていることが、この成長の要因であると考えられます。このようなPOSソフトウェアは、容易に入手できるソフトウェアよりも高価です。大企業向けの特注ソフトウェアは、さまざまなビジネス機能を管理すると同時に、顧客との関係を強化する必要があります。
エンドユーザーの展望
エンドユーザー別に見ると、POSソフトウェア市場は、レストラン、病院、ヘルスケア、小売、倉庫、エンターテインメント、その他に分けられます。2021年、POSソフトウェア市場では、レストラン分野が大きな収益シェアを獲得しました。POS取引を促進する主な要因は、レストランとオンラインデリバリーサービスとの統合が進んでいることです。インターネットでの注文や配達は、2022年にPOS支出を押し上げる可能性が高く、飲食店が高い第三者コストを回避するのに役立つと考えられます。レストラン分野では、データ分析、マーケティング、注文管理、決済が急成長をもたらし、来年も続くと予想されます。
地域別展望
地域別に見ると、POSソフトウェア市場は、北米、欧州、アジア太平洋、LAMEAで分析されています。北米地域は、2021年に最も高い収益シェアを獲得し、POSソフトウェア市場をリードしました。この地域には注目すべきPOSソフトウェアプロバイダーが存在し、最新の統合型POSソフトウェアに対する需要と採用が高いです。支払い、保険、患者管理に関連する病院施設を改善する必要がある結果、米国のヘルスケア産業は最も速い成長率を示すと予測されています。
市場参入企業がとる主な戦略は、「パートナーシップ」です。カーディナルマトリックスに記載された分析によると、POSソフトウェア市場ではオラクル社が先行しています。Fiserv, Inc.(Clover Network, Inc.)、NCR Corporation、Toast, Inc.、Block, Inc.などの企業は、POSソフトウェア市場における主要な革新者の一人です。
目次
第1章 市場範囲と調査手法
- 市場の定義
- 目的
- 市場範囲
- セグメンテーション
- 世界POSソフトウェア市場:用途別
- 世界POSソフトウェア市場:展開モード別
- 世界POSソフトウェア市場:組織規模別
- 世界POSソフトウェア市場:エンドユーザー別
- 世界POSソフトウェア市場:地域別
- 調査手法
第2章 市場概要
- イントロダクション
- 概要
- 市場構成とシナリオ
- 概要
- 市場に影響を与える主な要因
- 市場促進要因
- 市場抑制要因
第3章 競合分析- 世界
- KBVカーディナルマトリックス
- 最近の業界全体の戦略的展開
- パートナーシップ、コラボレーション、および契約
- 製品の発売と製品の拡大
- 買収と合併
- 主要成功戦略
- 主要なリーディングストラテジー
- 主要な戦略的動き
第4章 世界POSソフトウェア市場:用途別
- 世界固定POS市場:地域別
- 世界モバイルPOS市場:地域別
第5章 世界POSソフトウェア市場:展開モード別
- 世界のオンプレミス市場:地域別
- 世界クラウド市場:地域別
第6章 世界POSソフトウェア市場:組織規模別
- 世界大企業市場:地域別
- 世界の中小企業市場:地域別
第7章 世界POSソフトウェア市場:エンドユーザー別
- 世界の小売市場:地域別
- 世界のレストラン市場:地域別
- 世界のホスピタリティ市場:地域別
- 世界の倉庫市場:地域別
- 世界ヘルスケア市場:地域別
- 世界エンターテインメント市場:地域別
- 世界のその他の市場:地域別
第8章 世界POSソフトウェア市場:地域別
- 北米
- 北米の市場:国別
- 米国
- カナダ
- メキシコ
- その他北米地域
- 北米の市場:国別
- 欧州
- 欧州の市場:国別
- ドイツ
- 英国
- フランス
- ロシア
- スペイン
- イタリア
- その他欧州地域
- 欧州の市場:国別
- アジア太平洋
- アジア太平洋の市場:国別
- 中国
- 日本
- インド
- 韓国
- シンガポール
- マレーシア
- その他アジア太平洋地域
- アジア太平洋の市場:国別
- ラテンアメリカ・中東・アフリカ
- ラテンアメリカ・中東・アフリカの市場:国別
- ブラジル
- アルゼンチン
- アラブ首長国連邦
- サウジアラビア
- 南アフリカ
- ナイジェリア
- その他ラテンアメリカ・中東・アフリカ地域
- ラテンアメリカ・中東・アフリカの市場:国別
第9章 企業プロファイル
- Fiserv, Inc(Clover Network, Inc.)
- Oracle Corporation
- Toast, Inc
- NCR Corporation
- Revel Systems(Welsh, Carson, Anderson & Stowe)
- MSL Solutions Limited(Pemba Capital Partners)
- Block, Inc
- H&L POS(Valsoft Corporation)
- Idealpos Solutions Pty Ltd
- TouchBistro, Inc
LIST OF TABLES
- TABLE 1 Global Point-of-Sale Software Market, 2018 - 2021, USD Million
- TABLE 2 Global Point-of-Sale Software Market, 2022 - 2028, USD Million
- TABLE 3 Partnerships, Collaborations and Agreements- Point-of-Sale Software Market
- TABLE 4 Product Launches And Product Expansions- Point-of-Sale Software Market
- TABLE 5 Acquisition and Mergers- Point-of-Sale Software Market
- TABLE 6 Global Point-of-Sale Software Market by Application, 2018 - 2021, USD Million
- TABLE 7 Global Point-of-Sale Software Market by Application, 2022 - 2028, USD Million
- TABLE 8 Global Fixed POS Market by Region, 2018 - 2021, USD Million
- TABLE 9 Global Fixed POS Market by Region, 2022 - 2028, USD Million
- TABLE 10 Global Mobile POS Market by Region, 2018 - 2021, USD Million
- TABLE 11 Global Mobile POS Market by Region, 2022 - 2028, USD Million
- TABLE 12 Global Point-of-Sale Software Market by Deployment Mode, 2018 - 2021, USD Million
- TABLE 13 Global Point-of-Sale Software Market by Deployment Mode, 2022 - 2028, USD Million
- TABLE 14 Global On-Premise Market by Region, 2018 - 2021, USD Million
- TABLE 15 Global On-Premise Market by Region, 2022 - 2028, USD Million
- TABLE 16 Global Cloud Market by Region, 2018 - 2021, USD Million
- TABLE 17 Global Cloud Market by Region, 2022 - 2028, USD Million
- TABLE 18 Global Point-of-Sale Software Market by Organization Size, 2018 - 2021, USD Million
- TABLE 19 Global Point-of-Sale Software Market by Organization Size, 2022 - 2028, USD Million
- TABLE 20 Global Large Enterprises Market by Region, 2018 - 2021, USD Million
- TABLE 21 Global Large Enterprises Market by Region, 2022 - 2028, USD Million
- TABLE 22 Global SMEs Market by Region, 2018 - 2021, USD Million
- TABLE 23 Global SMEs Market by Region, 2022 - 2028, USD Million
- TABLE 24 Global Point-of-Sale Software Market by End User, 2018 - 2021, USD Million
- TABLE 25 Global Point-of-Sale Software Market by End User, 2022 - 2028, USD Million
- TABLE 26 Global Retail Market by Region, 2018 - 2021, USD Million
- TABLE 27 Global Retail Market by Region, 2022 - 2028, USD Million
- TABLE 28 Global Restaurants Market by Region, 2018 - 2021, USD Million
- TABLE 29 Global Restaurants Market by Region, 2022 - 2028, USD Million
- TABLE 30 Global Hospitality Market by Region, 2018 - 2021, USD Million
- TABLE 31 Global Hospitality Market by Region, 2022 - 2028, USD Million
- TABLE 32 Global Warehouse Market by Region, 2018 - 2021, USD Million
- TABLE 33 Global Warehouse Market by Region, 2022 - 2028, USD Million
- TABLE 34 Global Healthcare Market by Region, 2018 - 2021, USD Million
- TABLE 35 Global Healthcare Market by Region, 2022 - 2028, USD Million
- TABLE 36 Global Entertainment Market by Region, 2018 - 2021, USD Million
- TABLE 37 Global Entertainment Market by Region, 2022 - 2028, USD Million
- TABLE 38 Global Others Market by Region, 2018 - 2021, USD Million
- TABLE 39 Global Others Market by Region, 2022 - 2028, USD Million
- TABLE 40 Global Point-of-Sale Software Market by Region, 2018 - 2021, USD Million
- TABLE 41 Global Point-of-Sale Software Market by Region, 2022 - 2028, USD Million
- TABLE 42 North America Point-of-Sale Software Market, 2018 - 2021, USD Million
- TABLE 43 North America Point-of-Sale Software Market, 2022 - 2028, USD Million
- TABLE 44 North America Point-of-Sale Software Market by Application, 2018 - 2021, USD Million
- TABLE 45 North America Point-of-Sale Software Market by Application, 2022 - 2028, USD Million
- TABLE 46 North America Fixed POS Market by Country, 2018 - 2021, USD Million
- TABLE 47 North America Fixed POS Market by Country, 2022 - 2028, USD Million
- TABLE 48 North America Mobile POS Market by Country, 2018 - 2021, USD Million
- TABLE 49 North America Mobile POS Market by Country, 2022 - 2028, USD Million
- TABLE 50 North America Point-of-Sale Software Market by Deployment Mode, 2018 - 2021, USD Million
- TABLE 51 North America Point-of-Sale Software Market by Deployment Mode, 2022 - 2028, USD Million
- TABLE 52 North America On-Premise Market by Country, 2018 - 2021, USD Million
- TABLE 53 North America On-Premise Market by Country, 2022 - 2028, USD Million
- TABLE 54 North America Cloud Market by Country, 2018 - 2021, USD Million
- TABLE 55 North America Cloud Market by Country, 2022 - 2028, USD Million
- TABLE 56 North America Point-of-Sale Software Market by Organization Size, 2018 - 2021, USD Million
- TABLE 57 North America Point-of-Sale Software Market by Organization Size, 2022 - 2028, USD Million
- TABLE 58 North America Large Enterprises Market by Country, 2018 - 2021, USD Million
- TABLE 59 North America Large Enterprises Market by Country, 2022 - 2028, USD Million
- TABLE 60 North America SMEs Market by Country, 2018 - 2021, USD Million
- TABLE 61 North America SMEs Market by Country, 2022 - 2028, USD Million
- TABLE 62 North America Point-of-Sale Software Market by End User, 2018 - 2021, USD Million
- TABLE 63 North America Point-of-Sale Software Market by End User, 2022 - 2028, USD Million
- TABLE 64 North America Retail Market by Country, 2018 - 2021, USD Million
- TABLE 65 North America Retail Market by Country, 2022 - 2028, USD Million
- TABLE 66 North America Restaurants Market by Country, 2018 - 2021, USD Million
- TABLE 67 North America Restaurants Market by Country, 2022 - 2028, USD Million
- TABLE 68 North America Hospitality Market by Country, 2018 - 2021, USD Million
- TABLE 69 North America Hospitality Market by Country, 2022 - 2028, USD Million
- TABLE 70 North America Warehouse Market by Country, 2018 - 2021, USD Million
- TABLE 71 North America Warehouse Market by Country, 2022 - 2028, USD Million
- TABLE 72 North America Healthcare Market by Country, 2018 - 2021, USD Million
- TABLE 73 North America Healthcare Market by Country, 2022 - 2028, USD Million
- TABLE 74 North America Entertainment Market by Country, 2018 - 2021, USD Million
- TABLE 75 North America Entertainment Market by Country, 2022 - 2028, USD Million
- TABLE 76 North America Others Market by Country, 2018 - 2021, USD Million
- TABLE 77 North America Others Market by Country, 2022 - 2028, USD Million
- TABLE 78 North America Point-of-Sale Software Market by Country, 2018 - 2021, USD Million
- TABLE 79 North America Point-of-Sale Software Market by Country, 2022 - 2028, USD Million
- TABLE 80 US Point-of-Sale Software Market, 2018 - 2021, USD Million
- TABLE 81 US Point-of-Sale Software Market, 2022 - 2028, USD Million
- TABLE 82 US Point-of-Sale Software Market by Application, 2018 - 2021, USD Million
- TABLE 83 US Point-of-Sale Software Market by Application, 2022 - 2028, USD Million
- TABLE 84 US Point-of-Sale Software Market by Deployment Mode, 2018 - 2021, USD Million
- TABLE 85 US Point-of-Sale Software Market by Deployment Mode, 2022 - 2028, USD Million
- TABLE 86 US Point-of-Sale Software Market by Organization Size, 2018 - 2021, USD Million
- TABLE 87 US Point-of-Sale Software Market by Organization Size, 2022 - 2028, USD Million
- TABLE 88 US Point-of-Sale Software Market by End User, 2018 - 2021, USD Million
- TABLE 89 US Point-of-Sale Software Market by End User, 2022 - 2028, USD Million
- TABLE 90 Canada Point-of-Sale Software Market, 2018 - 2021, USD Million
- TABLE 91 Canada Point-of-Sale Software Market, 2022 - 2028, USD Million
- TABLE 92 Canada Point-of-Sale Software Market by Application, 2018 - 2021, USD Million
- TABLE 93 Canada Point-of-Sale Software Market by Application, 2022 - 2028, USD Million
- TABLE 94 Canada Point-of-Sale Software Market by Deployment Mode, 2018 - 2021, USD Million
- TABLE 95 Canada Point-of-Sale Software Market by Deployment Mode, 2022 - 2028, USD Million
- TABLE 96 Canada Point-of-Sale Software Market by Organization Size, 2018 - 2021, USD Million
- TABLE 97 Canada Point-of-Sale Software Market by Organization Size, 2022 - 2028, USD Million
- TABLE 98 Canada Point-of-Sale Software Market by End User, 2018 - 2021, USD Million
- TABLE 99 Canada Point-of-Sale Software Market by End User, 2022 - 2028, USD Million
- TABLE 100 Mexico Point-of-Sale Software Market, 2018 - 2021, USD Million
- TABLE 101 Mexico Point-of-Sale Software Market, 2022 - 2028, USD Million
- TABLE 102 Mexico Point-of-Sale Software Market by Application, 2018 - 2021, USD Million
- TABLE 103 Mexico Point-of-Sale Software Market by Application, 2022 - 2028, USD Million
- TABLE 104 Mexico Point-of-Sale Software Market by Deployment Mode, 2018 - 2021, USD Million
- TABLE 105 Mexico Point-of-Sale Software Market by Deployment Mode, 2022 - 2028, USD Million
- TABLE 106 Mexico Point-of-Sale Software Market by Organization Size, 2018 - 2021, USD Million
- TABLE 107 Mexico Point-of-Sale Software Market by Organization Size, 2022 - 2028, USD Million
- TABLE 108 Mexico Point-of-Sale Software Market by End User, 2018 - 2021, USD Million
- TABLE 109 Mexico Point-of-Sale Software Market by End User, 2022 - 2028, USD Million
- TABLE 110 Rest of North America Point-of-Sale Software Market, 2018 - 2021, USD Million
- TABLE 111 Rest of North America Point-of-Sale Software Market, 2022 - 2028, USD Million
- TABLE 112 Rest of North America Point-of-Sale Software Market by Application, 2018 - 2021, USD Million
- TABLE 113 Rest of North America Point-of-Sale Software Market by Application, 2022 - 2028, USD Million
- TABLE 114 Rest of North America Point-of-Sale Software Market by Deployment Mode, 2018 - 2021, USD Million
- TABLE 115 Rest of North America Point-of-Sale Software Market by Deployment Mode, 2022 - 2028, USD Million
- TABLE 116 Rest of North America Point-of-Sale Software Market by Organization Size, 2018 - 2021, USD Million
- TABLE 117 Rest of North America Point-of-Sale Software Market by Organization Size, 2022 - 2028, USD Million
- TABLE 118 Rest of North America Point-of-Sale Software Market by End User, 2018 - 2021, USD Million
- TABLE 119 Rest of North America Point-of-Sale Software Market by End User, 2022 - 2028, USD Million
- TABLE 120 Europe Point-of-Sale Software Market, 2018 - 2021, USD Million
- TABLE 121 Europe Point-of-Sale Software Market, 2022 - 2028, USD Million
- TABLE 122 Europe Point-of-Sale Software Market by Application, 2018 - 2021, USD Million
- TABLE 123 Europe Point-of-Sale Software Market by Application, 2022 - 2028, USD Million
- TABLE 124 Europe Fixed POS Market by Country, 2018 - 2021, USD Million
- TABLE 125 Europe Fixed POS Market by Country, 2022 - 2028, USD Million
- TABLE 126 Europe Mobile POS Market by Country, 2018 - 2021, USD Million
- TABLE 127 Europe Mobile POS Market by Country, 2022 - 2028, USD Million
- TABLE 128 Europe Point-of-Sale Software Market by Deployment Mode, 2018 - 2021, USD Million
- TABLE 129 Europe Point-of-Sale Software Market by Deployment Mode, 2022 - 2028, USD Million
- TABLE 130 Europe On-Premise Market by Country, 2018 - 2021, USD Million
- TABLE 131 Europe On-Premise Market by Country, 2022 - 2028, USD Million
- TABLE 132 Europe Cloud Market by Country, 2018 - 2021, USD Million
- TABLE 133 Europe Cloud Market by Country, 2022 - 2028, USD Million
- TABLE 134 Europe Point-of-Sale Software Market by Organization Size, 2018 - 2021, USD Million
- TABLE 135 Europe Point-of-Sale Software Market by Organization Size, 2022 - 2028, USD Million
- TABLE 136 Europe Large Enterprises Market by Country, 2018 - 2021, USD Million
- TABLE 137 Europe Large Enterprises Market by Country, 2022 - 2028, USD Million
- TABLE 138 Europe SMEs Market by Country, 2018 - 2021, USD Million
- TABLE 139 Europe SMEs Market by Country, 2022 - 2028, USD Million
- TABLE 140 Europe Point-of-Sale Software Market by End User, 2018 - 2021, USD Million
- TABLE 141 Europe Point-of-Sale Software Market by End User, 2022 - 2028, USD Million
- TABLE 142 Europe Retail Market by Country, 2018 - 2021, USD Million
- TABLE 143 Europe Retail Market by Country, 2022 - 2028, USD Million
- TABLE 144 Europe Restaurants Market by Country, 2018 - 2021, USD Million
- TABLE 145 Europe Restaurants Market by Country, 2022 - 2028, USD Million
- TABLE 146 Europe Hospitality Market by Country, 2018 - 2021, USD Million
- TABLE 147 Europe Hospitality Market by Country, 2022 - 2028, USD Million
- TABLE 148 Europe Warehouse Market by Country, 2018 - 2021, USD Million
- TABLE 149 Europe Warehouse Market by Country, 2022 - 2028, USD Million
- TABLE 150 Europe Healthcare Market by Country, 2018 - 2021, USD Million
- TABLE 151 Europe Healthcare Market by Country, 2022 - 2028, USD Million
- TABLE 152 Europe Entertainment Market by Country, 2018 - 2021, USD Million
- TABLE 153 Europe Entertainment Market by Country, 2022 - 2028, USD Million
- TABLE 154 Europe Others Market by Country, 2018 - 2021, USD Million
- TABLE 155 Europe Others Market by Country, 2022 - 2028, USD Million
- TABLE 156 Europe Point-of-Sale Software Market by Country, 2018 - 2021, USD Million
- TABLE 157 Europe Point-of-Sale Software Market by Country, 2022 - 2028, USD Million
- TABLE 158 Germany Point-of-Sale Software Market, 2018 - 2021, USD Million
- TABLE 159 Germany Point-of-Sale Software Market, 2022 - 2028, USD Million
- TABLE 160 Germany Point-of-Sale Software Market by Application, 2018 - 2021, USD Million
- TABLE 161 Germany Point-of-Sale Software Market by Application, 2022 - 2028, USD Million
- TABLE 162 Germany Point-of-Sale Software Market by Deployment Mode, 2018 - 2021, USD Million
- TABLE 163 Germany Point-of-Sale Software Market by Deployment Mode, 2022 - 2028, USD Million
- TABLE 164 Germany Point-of-Sale Software Market by Organization Size, 2018 - 2021, USD Million
- TABLE 165 Germany Point-of-Sale Software Market by Organization Size, 2022 - 2028, USD Million
- TABLE 166 Germany Point-of-Sale Software Market by End User, 2018 - 2021, USD Million
- TABLE 167 Germany Point-of-Sale Software Market by End User, 2022 - 2028, USD Million
- TABLE 168 UK Point-of-Sale Software Market, 2018 - 2021, USD Million
- TABLE 169 UK Point-of-Sale Software Market, 2022 - 2028, USD Million
- TABLE 170 UK Point-of-Sale Software Market by Application, 2018 - 2021, USD Million
- TABLE 171 UK Point-of-Sale Software Market by Application, 2022 - 2028, USD Million
- TABLE 172 UK Point-of-Sale Software Market by Deployment Mode, 2018 - 2021, USD Million
- TABLE 173 UK Point-of-Sale Software Market by Deployment Mode, 2022 - 2028, USD Million
- TABLE 174 UK Point-of-Sale Software Market by Organization Size, 2018 - 2021, USD Million
- TABLE 175 UK Point-of-Sale Software Market by Organization Size, 2022 - 2028, USD Million
- TABLE 176 UK Point-of-Sale Software Market by End User, 2018 - 2021, USD Million
- TABLE 177 UK Point-of-Sale Software Market by End User, 2022 - 2028, USD Million
- TABLE 178 France Point-of-Sale Software Market, 2018 - 2021, USD Million
- TABLE 179 France Point-of-Sale Software Market, 2022 - 2028, USD Million
- TABLE 180 France Point-of-Sale Software Market by Application, 2018 - 2021, USD Million
- TABLE 181 France Point-of-Sale Software Market by Application, 2022 - 2028, USD Million
- TABLE 182 France Point-of-Sale Software Market by Deployment Mode, 2018 - 2021, USD Million
- TABLE 183 France Point-of-Sale Software Market by Deployment Mode, 2022 - 2028, USD Million
- TABLE 184 France Point-of-Sale Software Market by Organization Size, 2018 - 2021, USD Million
- TABLE 185 France Point-of-Sale Software Market by Organization Size, 2022 - 2028, USD Million
- TABLE 186 France Point-of-Sale Software Market by End User, 2018 - 2021, USD Million
- TABLE 187 France Point-of-Sale Software Market by End User, 2022 - 2028, USD Million
- TABLE 188 Russia Point-of-Sale Software Market, 2018 - 2021, USD Million
- TABLE 189 Russia Point-of-Sale Software Market, 2022 - 2028, USD Million
- TABLE 190 Russia Point-of-Sale Software Market by Application, 2018 - 2021, USD Million
- TABLE 191 Russia Point-of-Sale Software Market by Application, 2022 - 2028, USD Million
- TABLE 192 Russia Point-of-Sale Software Market by Deployment Mode, 2018 - 2021, USD Million
- TABLE 193 Russia Point-of-Sale Software Market by Deployment Mode, 2022 - 2028, USD Million
- TABLE 194 Russia Point-of-Sale Software Market by Organization Size, 2018 - 2021, USD Million
- TABLE 195 Russia Point-of-Sale Software Market by Organization Size, 2022 - 2028, USD Million
- TABLE 196 Russia Point-of-Sale Software Market by End User, 2018 - 2021, USD Million
- TABLE 197 Russia Point-of-Sale Software Market by End User, 2022 - 2028, USD Million
- TABLE 198 Spain Point-of-Sale Software Market, 2018 - 2021, USD Million
- TABLE 199 Spain Point-of-Sale Software Market, 2022 - 2028, USD Million
- TABLE 200 Spain Point-of-Sale Software Market by Application, 2018 - 2021, USD Million
- TABLE 201 Spain Point-of-Sale Software Market by Application, 2022 - 2028, USD Million
- TABLE 202 Spain Point-of-Sale Software Market by Deployment Mode, 2018 - 2021, USD Million
- TABLE 203 Spain Point-of-Sale Software Market by Deployment Mode, 2022 - 2028, USD Million
- TABLE 204 Spain Point-of-Sale Software Market by Organization Size, 2018 - 2021, USD Million
- TABLE 205 Spain Point-of-Sale Software Market by Organization Size, 2022 - 2028, USD Million
- TABLE 206 Spain Point-of-Sale Software Market by End User, 2018 - 2021, USD Million
- TABLE 207 Spain Point-of-Sale Software Market by End User, 2022 - 2028, USD Million
- TABLE 208 Italy Point-of-Sale Software Market, 2018 - 2021, USD Million
- TABLE 209 Italy Point-of-Sale Software Market, 2022 - 2028, USD Million
- TABLE 210 Italy Point-of-Sale Software Market by Application, 2018 - 2021, USD Million
- TABLE 211 Italy Point-of-Sale Software Market by Application, 2022 - 2028, USD Million
- TABLE 212 Italy Point-of-Sale Software Market by Deployment Mode, 2018 - 2021, USD Million
- TABLE 213 Italy Point-of-Sale Software Market by Deployment Mode, 2022 - 2028, USD Million
- TABLE 214 Italy Point-of-Sale Software Market by Organization Size, 2018 - 2021, USD Million
- TABLE 215 Italy Point-of-Sale Software Market by Organization Size, 2022 - 2028, USD Million
- TABLE 216 Italy Point-of-Sale Software Market by End User, 2018 - 2021, USD Million
- TABLE 217 Italy Point-of-Sale Software Market by End User, 2022 - 2028, USD Million
- TABLE 218 Rest of Europe Point-of-Sale Software Market, 2018 - 2021, USD Million
- TABLE 219 Rest of Europe Point-of-Sale Software Market, 2022 - 2028, USD Million
- TABLE 220 Rest of Europe Point-of-Sale Software Market by Application, 2018 - 2021, USD Million
- TABLE 221 Rest of Europe Point-of-Sale Software Market by Application, 2022 - 2028, USD Million
- TABLE 222 Rest of Europe Point-of-Sale Software Market by Deployment Mode, 2018 - 2021, USD Million
- TABLE 223 Rest of Europe Point-of-Sale Software Market by Deployment Mode, 2022 - 2028, USD Million
- TABLE 224 Rest of Europe Point-of-Sale Software Market by Organization Size, 2018 - 2021, USD Million
- TABLE 225 Rest of Europe Point-of-Sale Software Market by Organization Size, 2022 - 2028, USD Million
- TABLE 226 Rest of Europe Point-of-Sale Software Market by End User, 2018 - 2021, USD Million
- TABLE 227 Rest of Europe Point-of-Sale Software Market by End User, 2022 - 2028, USD Million
- TABLE 228 Asia Pacific Point-of-Sale Software Market, 2018 - 2021, USD Million
- TABLE 229 Asia Pacific Point-of-Sale Software Market, 2022 - 2028, USD Million
- TABLE 230 Asia Pacific Point-of-Sale Software Market by Application, 2018 - 2021, USD Million
- TABLE 231 Asia Pacific Point-of-Sale Software Market by Application, 2022 - 2028, USD Million
- TABLE 232 Asia Pacific Fixed POS Market by Country, 2018 - 2021, USD Million
- TABLE 233 Asia Pacific Fixed POS Market by Country, 2022 - 2028, USD Million
- TABLE 234 Asia Pacific Mobile POS Market by Country, 2018 - 2021, USD Million
- TABLE 235 Asia Pacific Mobile POS Market by Country, 2022 - 2028, USD Million
- TABLE 236 Asia Pacific Point-of-Sale Software Market by Deployment Mode, 2018 - 2021, USD Million
- TABLE 237 Asia Pacific Point-of-Sale Software Market by Deployment Mode, 2022 - 2028, USD Million
- TABLE 238 Asia Pacific On-Premise Market by Country, 2018 - 2021, USD Million
- TABLE 239 Asia Pacific On-Premise Market by Country, 2022 - 2028, USD Million
- TABLE 240 Asia Pacific Cloud Market by Country, 2018 - 2021, USD Million
- TABLE 241 Asia Pacific Cloud Market by Country, 2022 - 2028, USD Million
- TABLE 242 Asia Pacific Point-of-Sale Software Market by Organization Size, 2018 - 2021, USD Million
- TABLE 243 Asia Pacific Point-of-Sale Software Market by Organization Size, 2022 - 2028, USD Million
- TABLE 244 Asia Pacific Large Enterprises Market by Country, 2018 - 2021, USD Million
- TABLE 245 Asia Pacific Large Enterprises Market by Country, 2022 - 2028, USD Million
- TABLE 246 Asia Pacific SMEs Market by Country, 2018 - 2021, USD Million
- TABLE 247 Asia Pacific SMEs Market by Country, 2022 - 2028, USD Million
- TABLE 248 Asia Pacific Point-of-Sale Software Market by End User, 2018 - 2021, USD Million
- TABLE 249 Asia Pacific Point-of-Sale Software Market by End User, 2022 - 2028, USD Million
- TABLE 250 Asia Pacific Retail Market by Country, 2018 - 2021, USD Million
- TABLE 251 Asia Pacific Retail Market by Country, 2022 - 2028, USD Million
- TABLE 252 Asia Pacific Restaurants Market by Country, 2018 - 2021, USD Million
- TABLE 253 Asia Pacific Restaurants Market by Country, 2022 - 2028, USD Million
- TABLE 254 Asia Pacific Hospitality Market by Country, 2018 - 2021, USD Million
- TABLE 255 Asia Pacific Hospitality Market by Country, 2022 - 2028, USD Million
- TABLE 256 Asia Pacific Warehouse Market by Country, 2018 - 2021, USD Million
- TABLE 257 Asia Pacific Warehouse Market by Country, 2022 - 2028, USD Million
- TABLE 258 Asia Pacific Healthcare Market by Country, 2018 - 2021, USD Million
- TABLE 259 Asia Pacific Healthcare Market by Country, 2022 - 2028, USD Million
- TABLE 260 Asia Pacific Entertainment Market by Country, 2018 - 2021, USD Million
- TABLE 261 Asia Pacific Entertainment Market by Country, 2022 - 2028, USD Million
- TABLE 262 Asia Pacific Others Market by Country, 2018 - 2021, USD Million
- TABLE 263 Asia Pacific Others Market by Country, 2022 - 2028, USD Million
- TABLE 264 Asia Pacific Point-of-Sale Software Market by Country, 2018 - 2021, USD Million
- TABLE 265 Asia Pacific Point-of-Sale Software Market by Country, 2022 - 2028, USD Million
- TABLE 266 China Point-of-Sale Software Market, 2018 - 2021, USD Million
- TABLE 267 China Point-of-Sale Software Market, 2022 - 2028, USD Million
- TABLE 268 China Point-of-Sale Software Market by Application, 2018 - 2021, USD Million
- TABLE 269 China Point-of-Sale Software Market by Application, 2022 - 2028, USD Million
- TABLE 270 China Point-of-Sale Software Market by Deployment Mode, 2018 - 2021, USD Million
- TABLE 271 China Point-of-Sale Software Market by Deployment Mode, 2022 - 2028, USD Million
- TABLE 272 China Point-of-Sale Software Market by Organization Size, 2018 - 2021, USD Million
- TABLE 273 China Point-of-Sale Software Market by Organization Size, 2022 - 2028, USD Million
- TABLE 274 China Point-of-Sale Software Market by End User, 2018 - 2021, USD Million
- TABLE 275 China Point-of-Sale Software Market by End User, 2022 - 2028, USD Million
- TABLE 276 Japan Point-of-Sale Software Market, 2018 - 2021, USD Million
- TABLE 277 Japan Point-of-Sale Software Market, 2022 - 2028, USD Million
- TABLE 278 Japan Point-of-Sale Software Market by Application, 2018 - 2021, USD Million
- TABLE 279 Japan Point-of-Sale Software Market by Application, 2022 - 2028, USD Million
- TABLE 280 Japan Point-of-Sale Software Market by Deployment Mode, 2018 - 2021, USD Million
- TABLE 281 Japan Point-of-Sale Software Market by Deployment Mode, 2022 - 2028, USD Million
- TABLE 282 Japan Point-of-Sale Software Market by Organization Size, 2018 - 2021, USD Million
- TABLE 283 Japan Point-of-Sale Software Market by Organization Size, 2022 - 2028, USD Million
- TABLE 284 Japan Point-of-Sale Software Market by End User, 2018 - 2021, USD Million
- TABLE 285 Japan Point-of-Sale Software Market by End User, 2022 - 2028, USD Million
- TABLE 286 India Point-of-Sale Software Market, 2018 - 2021, USD Million
- TABLE 287 India Point-of-Sale Software Market, 2022 - 2028, USD Million
- TABLE 288 India Point-of-Sale Software Market by Application, 2018 - 2021, USD Million
- TABLE 289 India Point-of-Sale Software Market by Application, 2022 - 2028, USD Million
- TABLE 290 India Point-of-Sale Software Market by Deployment Mode, 2018 - 2021, USD Million
- TABLE 291 India Point-of-Sale Software Market by Deployment Mode, 2022 - 2028, USD Million
- TABLE 292 India Point-of-Sale Software Market by Organization Size, 2018 - 2021, USD Million
- TABLE 293 India Point-of-Sale Software Market by Organization Size, 2022 - 2028, USD Million
- TABLE 294 India Point-of-Sale Software Market by End User, 2018 - 2021, USD Million
- TABLE 295 India Point-of-Sale Software Market by End User, 2022 - 2028, USD Million
- TABLE 296 South Korea Point-of-Sale Software Market, 2018 - 2021, USD Million
- TABLE 297 South Korea Point-of-Sale Software Market, 2022 - 2028, USD Million
- TABLE 298 South Korea Point-of-Sale Software Market by Application, 2018 - 2021, USD Million
- TABLE 299 South Korea Point-of-Sale Software Market by Application, 2022 - 2028, USD Million
- TABLE 300 South Korea Point-of-Sale Software Market by Deployment Mode, 2018 - 2021, USD Million
- TABLE 301 South Korea Point-of-Sale Software Market by Deployment Mode, 2022 - 2028, USD Million
- TABLE 302 South Korea Point-of-Sale Software Market by Organization Size, 2018 - 2021, USD Million
- TABLE 303 South Korea Point-of-Sale Software Market by Organization Size, 2022 - 2028, USD Million
- TABLE 304 South Korea Point-of-Sale Software Market by End User, 2018 - 2021, USD Million
- TABLE 305 South Korea Point-of-Sale Software Market by End User, 2022 - 2028, USD Million
- TABLE 306 Singapore Point-of-Sale Software Market, 2018 - 2021, USD Million
- TABLE 307 Singapore Point-of-Sale Software Market, 2022 - 2028, USD Million
- TABLE 308 Singapore Point-of-Sale Software Market by Application, 2018 - 2021, USD Million
- TABLE 309 Singapore Point-of-Sale Software Market by Application, 2022 - 2028, USD Million
- TABLE 310 Singapore Point-of-Sale Software Market by Deployment Mode, 2018 - 2021, USD Million
- TABLE 311 Singapore Point-of-Sale Software Market by Deployment Mode, 2022 - 2028, USD Million
- TABLE 312 Singapore Point-of-Sale Software Market by Organization Size, 2018 - 2021, USD Million
- TABLE 313 Singapore Point-of-Sale Software Market by Organization Size, 2022 - 2028, USD Million
- TABLE 314 Singapore Point-of-Sale Software Market by End User, 2018 - 2021, USD Million
- TABLE 315 Singapore Point-of-Sale Software Market by End User, 2022 - 2028, USD Million
- TABLE 316 Malaysia Point-of-Sale Software Market, 2018 - 2021, USD Million
- TABLE 317 Malaysia Point-of-Sale Software Market, 2022 - 2028, USD Million
- TABLE 318 Malaysia Point-of-Sale Software Market by Application, 2018 - 2021, USD Million
- TABLE 319 Malaysia Point-of-Sale Software Market by Application, 2022 - 2028, USD Million
- TABLE 320 Malaysia Point-of-Sale Software Market by Deployment Mode, 2018 - 2021, USD Million
- TABLE 321 Malaysia Point-of-Sale Software Market by Deployment Mode, 2022 - 2028, USD Million
- TABLE 322 Malaysia Point-of-Sale Software Market by Organization Size, 2018 - 2021, USD Million
- TABLE 323 Malaysia Point-of-Sale Software Market by Organization Size, 2022 - 2028, USD Million
- TABLE 324 Malaysia Point-of-Sale Software Market by End User, 2018 - 2021, USD Million
- TABLE 325 Malaysia Point-of-Sale Software Market by End User, 2022 - 2028, USD Million
- TABLE 326 Rest of Asia Pacific Point-of-Sale Software Market, 2018 - 2021, USD Million
- TABLE 327 Rest of Asia Pacific Point-of-Sale Software Market, 2022 - 2028, USD Million
- TABLE 328 Rest of Asia Pacific Point-of-Sale Software Market by Application, 2018 - 2021, USD Million
- TABLE 329 Rest of Asia Pacific Point-of-Sale Software Market by Application, 2022 - 2028, USD Million
- TABLE 330 Rest of Asia Pacific Point-of-Sale Software Market by Deployment Mode, 2018 - 2021, USD Million
- TABLE 331 Rest of Asia Pacific Point-of-Sale Software Market by Deployment Mode, 2022 - 2028, USD Million
- TABLE 332 Rest of Asia Pacific Point-of-Sale Software Market by Organization Size, 2018 - 2021, USD Million
- TABLE 333 Rest of Asia Pacific Point-of-Sale Software Market by Organization Size, 2022 - 2028, USD Million
- TABLE 334 Rest of Asia Pacific Point-of-Sale Software Market by End User, 2018 - 2021, USD Million
- TABLE 335 Rest of Asia Pacific Point-of-Sale Software Market by End User, 2022 - 2028, USD Million
- TABLE 336 LAMEA Point-of-Sale Software Market, 2018 - 2021, USD Million
- TABLE 337 LAMEA Point-of-Sale Software Market, 2022 - 2028, USD Million
- TABLE 338 LAMEA Point-of-Sale Software Market by Application, 2018 - 2021, USD Million
- TABLE 339 LAMEA Point-of-Sale Software Market by Application, 2022 - 2028, USD Million
- TABLE 340 LAMEA Fixed POS Market by Country, 2018 - 2021, USD Million
- TABLE 341 LAMEA Fixed POS Market by Country, 2022 - 2028, USD Million
- TABLE 342 LAMEA Mobile POS Market by Country, 2018 - 2021, USD Million
- TABLE 343 LAMEA Mobile POS Market by Country, 2022 - 2028, USD Million
- TABLE 344 LAMEA Point-of-Sale Software Market by Deployment Mode, 2018 - 2021, USD Million
- TABLE 345 LAMEA Point-of-Sale Software Market by Deployment Mode, 2022 - 2028, USD Million
- TABLE 346 LAMEA On-Premise Market by Country, 2018 - 2021, USD Million
- TABLE 347 LAMEA On-Premise Market by Country, 2022 - 2028, USD Million
- TABLE 348 LAMEA Cloud Market by Country, 2018 - 2021, USD Million
- TABLE 349 LAMEA Cloud Market by Country, 2022 - 2028, USD Million
- TABLE 350 LAMEA Point-of-Sale Software Market by Organization Size, 2018 - 2021, USD Million
- TABLE 351 LAMEA Point-of-Sale Software Market by Organization Size, 2022 - 2028, USD Million
- TABLE 352 LAMEA Large Enterprises Market by Country, 2018 - 2021, USD Million
- TABLE 353 LAMEA Large Enterprises Market by Country, 2022 - 2028, USD Million
- TABLE 354 LAMEA SMEs Market by Country, 2018 - 2021, USD Million
- TABLE 355 LAMEA SMEs Market by Country, 2022 - 2028, USD Million
- TABLE 356 LAMEA Point-of-Sale Software Market by End User, 2018 - 2021, USD Million
- TABLE 357 LAMEA Point-of-Sale Software Market by End User, 2022 - 2028, USD Million
- TABLE 358 LAMEA Retail Market by Country, 2018 - 2021, USD Million
- TABLE 359 LAMEA Retail Market by Country, 2022 - 2028, USD Million
- TABLE 360 LAMEA Restaurants Market by Country, 2018 - 2021, USD Million
- TABLE 361 LAMEA Restaurants Market by Country, 2022 - 2028, USD Million
- TABLE 362 LAMEA Hospitality Market by Country, 2018 - 2021, USD Million
- TABLE 363 LAMEA Hospitality Market by Country, 2022 - 2028, USD Million
- TABLE 364 LAMEA Warehouse Market by Country, 2018 - 2021, USD Million
- TABLE 365 LAMEA Warehouse Market by Country, 2022 - 2028, USD Million
- TABLE 366 LAMEA Healthcare Market by Country, 2018 - 2021, USD Million
- TABLE 367 LAMEA Healthcare Market by Country, 2022 - 2028, USD Million
- TABLE 368 LAMEA Entertainment Market by Country, 2018 - 2021, USD Million
- TABLE 369 LAMEA Entertainment Market by Country, 2022 - 2028, USD Million
- TABLE 370 LAMEA Others Market by Country, 2018 - 2021, USD Million
- TABLE 371 LAMEA Others Market by Country, 2022 - 2028, USD Million
- TABLE 372 LAMEA Point-of-Sale Software Market by Country, 2018 - 2021, USD Million
- TABLE 373 LAMEA Point-of-Sale Software Market by Country, 2022 - 2028, USD Million
- TABLE 374 Brazil Point-of-Sale Software Market, 2018 - 2021, USD Million
- TABLE 375 Brazil Point-of-Sale Software Market, 2022 - 2028, USD Million
- TABLE 376 Brazil Point-of-Sale Software Market by Application, 2018 - 2021, USD Million
- TABLE 377 Brazil Point-of-Sale Software Market by Application, 2022 - 2028, USD Million
- TABLE 378 Brazil Point-of-Sale Software Market by Deployment Mode, 2018 - 2021, USD Million
- TABLE 379 Brazil Point-of-Sale Software Market by Deployment Mode, 2022 - 2028, USD Million
- TABLE 380 Brazil Point-of-Sale Software Market by Organization Size, 2018 - 2021, USD Million
- TABLE 381 Brazil Point-of-Sale Software Market by Organization Size, 2022 - 2028, USD Million
- TABLE 382 Brazil Point-of-Sale Software Market by End User, 2018 - 2021, USD Million
- TABLE 383 Brazil Point-of-Sale Software Market by End User, 2022 - 2028, USD Million
- TABLE 384 Argentina Point-of-Sale Software Market, 2018 - 2021, USD Million
- TABLE 385 Argentina Point-of-Sale Software Market, 2022 - 2028, USD Million
- TABLE 386 Argentina Point-of-Sale Software Market by Application, 2018 - 2021, USD Million
- TABLE 387 Argentina Point-of-Sale Software Market by Application, 2022 - 2028, USD Million
- TABLE 388 Argentina Point-of-Sale Software Market by Deployment Mode, 2018 - 2021, USD Million
- TABLE 389 Argentina Point-of-Sale Software Market by Deployment Mode, 2022 - 2028, USD Million
- TABLE 390 Argentina Point-of-Sale Software Market by Organization Size, 2018 - 2021, USD Million
- TABLE 391 Argentina Point-of-Sale Software Market by Organization Size, 2022 - 2028, USD Million
- TABLE 392 Argentina Point-of-Sale Software Market by End User, 2018 - 2021, USD Million
- TABLE 393 Argentina Point-of-Sale Software Market by End User, 2022 - 2028, USD Million
- TABLE 394 UAE Point-of-Sale Software Market, 2018 - 2021, USD Million
- TABLE 395 UAE Point-of-Sale Software Market, 2022 - 2028, USD Million
- TABLE 396 UAE Point-of-Sale Software Market by Application, 2018 - 2021, USD Million
- TABLE 397 UAE Point-of-Sale Software Market by Application, 2022 - 2028, USD Million
- TABLE 398 UAE Point-of-Sale Software Market by Deployment Mode, 2018 - 2021, USD Million
- TABLE 399 UAE Point-of-Sale Software Market by Deployment Mode, 2022 - 2028, USD Million
- TABLE 400 UAE Point-of-Sale Software Market by Organization Size, 2018 - 2021, USD Million
- TABLE 401 UAE Point-of-Sale Software Market by Organization Size, 2022 - 2028, USD Million
- TABLE 402 UAE Point-of-Sale Software Market by End User, 2018 - 2021, USD Million
- TABLE 403 UAE Point-of-Sale Software Market by End User, 2022 - 2028, USD Million
- TABLE 404 Saudi Arabia Point-of-Sale Software Market, 2018 - 2021, USD Million
- TABLE 405 Saudi Arabia Point-of-Sale Software Market, 2022 - 2028, USD Million
- TABLE 406 Saudi Arabia Point-of-Sale Software Market by Application, 2018 - 2021, USD Million
- TABLE 407 Saudi Arabia Point-of-Sale Software Market by Application, 2022 - 2028, USD Million
- TABLE 408 Saudi Arabia Point-of-Sale Software Market by Deployment Mode, 2018 - 2021, USD Million
- TABLE 409 Saudi Arabia Point-of-Sale Software Market by Deployment Mode, 2022 - 2028, USD Million
- TABLE 410 Saudi Arabia Point-of-Sale Software Market by Organization Size, 2018 - 2021, USD Million
- TABLE 411 Saudi Arabia Point-of-Sale Software Market by Organization Size, 2022 - 2028, USD Million
- TABLE 412 Saudi Arabia Point-of-Sale Software Market by End User, 2018 - 2021, USD Million
- TABLE 413 Saudi Arabia Point-of-Sale Software Market by End User, 2022 - 2028, USD Million
- TABLE 414 South Africa Point-of-Sale Software Market, 2018 - 2021, USD Million
- TABLE 415 South Africa Point-of-Sale Software Market, 2022 - 2028, USD Million
- TABLE 416 South Africa Point-of-Sale Software Market by Application, 2018 - 2021, USD Million
- TABLE 417 South Africa Point-of-Sale Software Market by Application, 2022 - 2028, USD Million
- TABLE 418 South Africa Point-of-Sale Software Market by Deployment Mode, 2018 - 2021, USD Million
- TABLE 419 South Africa Point-of-Sale Software Market by Deployment Mode, 2022 - 2028, USD Million
- TABLE 420 South Africa Point-of-Sale Software Market by Organization Size, 2018 - 2021, USD Million
- TABLE 421 South Africa Point-of-Sale Software Market by Organization Size, 2022 - 2028, USD Million
- TABLE 422 South Africa Point-of-Sale Software Market by End User, 2018 - 2021, USD Million
- TABLE 423 South Africa Point-of-Sale Software Market by End User, 2022 - 2028, USD Million
- TABLE 424 Nigeria Point-of-Sale Software Market, 2018 - 2021, USD Million
- TABLE 425 Nigeria Point-of-Sale Software Market, 2022 - 2028, USD Million
- TABLE 426 Nigeria Point-of-Sale Software Market by Application, 2018 - 2021, USD Million
- TABLE 427 Nigeria Point-of-Sale Software Market by Application, 2022 - 2028, USD Million
- TABLE 428 Nigeria Point-of-Sale Software Market by Deployment Mode, 2018 - 2021, USD Million
- TABLE 429 Nigeria Point-of-Sale Software Market by Deployment Mode, 2022 - 2028, USD Million
- TABLE 430 Nigeria Point-of-Sale Software Market by Organization Size, 2018 - 2021, USD Million
- TABLE 431 Nigeria Point-of-Sale Software Market by Organization Size, 2022 - 2028, USD Million
- TABLE 432 Nigeria Point-of-Sale Software Market by End User, 2018 - 2021, USD Million
- TABLE 433 Nigeria Point-of-Sale Software Market by End User, 2022 - 2028, USD Million
- TABLE 434 Rest of LAMEA Point-of-Sale Software Market, 2018 - 2021, USD Million
- TABLE 435 Rest of LAMEA Point-of-Sale Software Market, 2022 - 2028, USD Million
- TABLE 436 Rest of LAMEA Point-of-Sale Software Market by Application, 2018 - 2021, USD Million
- TABLE 437 Rest of LAMEA Point-of-Sale Software Market by Application, 2022 - 2028, USD Million
- TABLE 438 Rest of LAMEA Point-of-Sale Software Market by Deployment Mode, 2018 - 2021, USD Million
- TABLE 439 Rest of LAMEA Point-of-Sale Software Market by Deployment Mode, 2022 - 2028, USD Million
- TABLE 440 Rest of LAMEA Point-of-Sale Software Market by Organization Size, 2018 - 2021, USD Million
- TABLE 441 Rest of LAMEA Point-of-Sale Software Market by Organization Size, 2022 - 2028, USD Million
- TABLE 442 Rest of LAMEA Point-of-Sale Software Market by End User, 2018 - 2021, USD Million
- TABLE 443 Rest of LAMEA Point-of-Sale Software Market by End User, 2022 - 2028, USD Million
- TABLE 444 Key Information -Fiserv, Inc.
- TABLE 445 Key Information - Oracle Corporation
- TABLE 446 Key Information - Toast, Inc.
- TABLE 447 Key Information - NCR Corporation
- TABLE 448 Key information - Revel Systems
- TABLE 449 Key Information - MSL Solutions Limited
- TABLE 450 Key information - Block, Inc.
- TABLE 451 Key Information - H&L POS
- TABLE 452 Key Information - Idealpos Solutions Pty Ltd
- TABLE 453 Key Information - TouchBistro, Inc.
List of Figures
- FIG 1 Methodology for the research
- FIG 2 KBV Cardinal Matrix
- FIG 3 Key Leading Strategies: Percentage Distribution (2018-2022)
- FIG 4 Key Strategic Move: (Partnerships, Collaborations & Agreements: 2019, Jan - 2023, Feb) Leading Players
- FIG 5 Global Point-of-Sale Software Market share by Application, 2021
- FIG 6 Global Point-of-Sale Software Market share by Application, 2028
- FIG 7 Global Point-of-Sale Software Market by Application, 2018 - 2028, USD Million
- FIG 8 Global Point-of-Sale Software Market share by Deployment Mode, 2021
- FIG 9 Global Point-of-Sale Software Market share by Deployment Mode, 2028
- FIG 10 Global Point-of-Sale Software Market by Deployment Mode, 2018 - 2028, USD Million
- FIG 11 Global Point-of-Sale Software Market share by Organization Size, 2021
- FIG 12 Global Point-of-Sale Software Market share by Organization Size, 2028
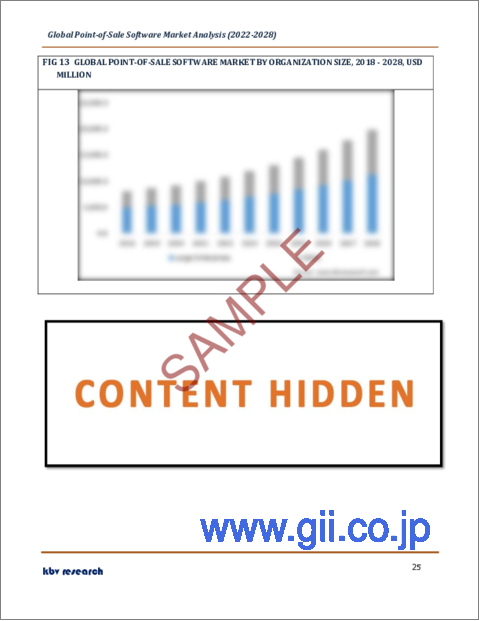
- FIG 13 Global Point-of-Sale Software Market by Organization Size, 2018 - 2028, USD Million
- FIG 14 Global Point-of-Sale Software Market share by End User, 2021
- FIG 15 Global Point-of-Sale Software Market share by End User, 2028
- FIG 16 Global Point-of-Sale Software Market by End User, 2018 - 2028, USD Million
- FIG 17 Global Point-of-Sale Software Market share by Region, 2021
- FIG 18 Global Point-of-Sale Software Market share by Region, 2028
- FIG 19 Global Point-of-Sale Software Market by Region, 2018 - 2028, USD Million
- FIG 20 Recent strategies and developments: Fiserv, Inc.
- FIG 21 SWOT Analysis: Fiserv, Inc.
- FIG 22 SWOT analysis: Oracle Corporation
- FIG 23 Recent strategies and developments: Toast, Inc.
- FIG 24 Recent strategies and developments: NCR Corporation
- FIG 25 Recent strategies and developments: Revel Systems
- FIG 26 Recent strategies and developments: MSL Solutions Limited
- FIG 27 Recent strategies and developments: Block, Inc.
- FIG 28 Recent strategies and developments: H&L POS
- FIG 29 Recent strategies and developments: TouchBistro, Inc.
The Global Point-of-Sale Software Market size is expected to reach $20 billion by 2028, rising at a market growth of 10.6% CAGR during the forecast period.
POS software aids retailers in expanding their businesses by processing payments, managing inventories, creating data for profit analysis, and managing refunds and returns, among other functions. Briefly, point-of-sale (POS) software assists retailers in managing their whole business process, beginning with the sale of items and continuing through payment processing and receipt printing.
The need for point-of-sale (POS) software has been spurred by the need to handle cashless transactions, track sales, and inventory data, and optimize sales strategy through analytics in retail chains, hotels, drug stores, restaurants, auto shops, and other businesses. In addition, increasing demand for advanced capabilities such as personnel management analytics, sales monitoring, inventory tracking, customer data management, and reporting is anticipated to increase the use of point-of-sale (POS) software across several industries.
As a result of the variety of business operations, the need for POS systems with greater functionality and analytics has increased dramatically. These tools aid users in efficiently handling business personnel, clients, payments, and invoicing. In addition, these solutions assist users in managing business inventory, customers, payments, and workers effectively.
The POS software handles a variety of business processes and must be installed on a desktop, notebook, laptop, or tablet with a suitable operating system. Due to the growing popularity of cloud-based solutions, the demand for cloud-based mobile POS software has increased. Due to its accessibility via a web browser or the Internet, the web-based POS solution has also gained popularity among small and medium-sized businesses.
COVID-19 Impact Analysis
Point-of-sale software has witnessed tremendous development. The COVID-19 pandemic has transformed the corporate environment where end-users must use the current point-of-sale technology. Numerous e-commerce & retail platforms have modified and embraced point-of-sale software solutions to facilitate online orders and payments. The unified analytics of point-of-sale software will aid in understanding and meeting changing consumer expectations, adapting to market shifts, and preparing for future lockdowns or similar situations.
Market Growth Factors
Grown preference to non-cash transactions
Numerous central banks and government financial organizations are offering incentives and support to promote POS for the Android system, which is anticipated to contribute considerably to the rising demand for mobile POS. In addition to the burgeoning demand for computerized payment systems, the prospects for POS tablets on the modern market have been bolstered by the rising popularity of tablet computers. In the past decade, the increasing usage of intelligent electronic devices has also expanded the POS software market.
Rising adoption of POS solutions among SMEs
The technological capability of wireless POS systems to interconnect with smartphones or tablets via a mobile card reader is increasing their adoption in several areas. In addition, the low installation cost of mobile point-of-sale systems and their capacity to deliver value-added services for long-term operations are the primary factors attracting the attention of merchants and retailers. Furthermore, public governance systems favor the deployment of the most effective mobile point-of-sale due to their capacity to transmit transparent pricing and money transfer information. As a result of these reasons, the market for point-of-sale software is expected to expand throughout the forecast period.
Market Restraining Factors
Growing data security concerns
Retail POS systems are susceptible to security flaws, such as device malfunctions, phishing, skimming, and software and network vulnerabilities. Due to insecure networks, hackers can simply infiltrate the infrastructure and access vital records, such as business accounts and customer credit card information. Even if a network is well protected, devices must also be secured. Therefore, while deploying POS terminals, choosing technological solutions with inbuilt security features is crucial. In addition, there is a considerable increase in dangers, such as data thefts and cyberattacks, due to the deployment of increasingly sophisticated technologies and the expansion of business system integration.
Application Outlook
Based on application, the point-of-sale software market is segmented into fixed POS, and mobile POS. In 2021, the fixed POS segment held the highest revenue share in the point-of-sale software market. Because fixed POS solutions offer greater functionality and capabilities than mobile POS, most brick-and-mortar retailers and restaurants currently prefer them. This is what is responsible for the segment's rise. In addition, due to the advantages of having a fixed POS system, including inventory management, business functionality, a cash drawer, staff time clocks, loyalty programs, and gift card administration, consumers prefer utilizing them.
Deployment Mode Outlook
On the basis of deployment mode, the point-of-sale software market is fragmented into cloud and on-premise. The cloud-based segment recorded a remarkable revenue share in the point-of-sale software market in 2021. With the development of technology, cloud-based deployment has begun to gather momentum. Furthermore, due to how simple it is to use these small devices for speedy payment services, the software for mobile POS systems has also become more popular. Another element driving up demand for cloud-based software among cost-conscious end users is the simplicity of payment made through monthly fees.
Organization Size Outlook
By organization size, the point-of-sale software market is bifurcated into large enterprise, and small & medium enterprise (SMEs). In 2021, the large enterprise region led the point-of-sale software market by generating maximum revenue share. Large organizations' demand for customized POS software solutions to handle their cash flows or business operations might be credited with this growth. This POS software is more expensive than readily available software. Bespoke software for a large corporation must manage a variety of business functions while simultaneously enhancing client interaction.
End-User Outlook
On the basis of end-user, the point-of-sale software market is divided into restaurants, hospitality, healthcare, retail, warehouse, entertainment and others. In 2021, the restaurant segment garnered a significant revenue share in the point-of-sale software market. A major factor driving POS transactions is the increasing integration of restaurants with online delivery services. Internet ordering and delivery will likely boost POS spending in 2022, which will help eateries avoid high third-party costs. In the restaurant sector, data analytics, marketing, order management, and payments have caused a meteoric rise that is anticipated to continue in the coming year.
Regional Outlook
Region wise, the point-of-sale software market is analyzed across North America, Europe, Asia Pacific and LAMEA. The North America region led the point-of-sale software market by generating the highest revenue share in 2021. The region is home to notable POS software providers and has a high demand for and adoption of modern integrated POS software. As a result of the need to improve hospital facilities associated with payment, insurance, and patient administration, the U.S. healthcare industry is predicted to see the fastest growth rate.
The major strategies followed by the market participants are Partnerships. Based on the Analysis presented in the Cardinal matrix; Oracle Corporation is the forerunner in the Point-of-Sale Software Market. Companies such as and Fiserv, Inc. (Clover Network, Inc.), NCR Corporation, Toast, Inc., and Block, Inc. are some of the key innovators in Point-of-Sale Software Market.
The market research report covers the analysis of key stake holders of the market. Key companies profiled in the report include Fiserv, Inc. (Clover Network, Inc.), Oracle Corporation, Toast, Inc., NCR Corporation, Revel Systems (Welsh, Carson, Anderson & Stowe), MSL Solutions Limited (Pemba Capital Partners), Block, Inc., H&L POS (Valsoft Corporation), Idealpos Solutions Pty Ltd and TouchBistro, Inc.
Recent Strategies Deployed in Point-of-Sale Software Market
Partnerships, Collaborations and Agreements:
Feb-2023: Toast signed a partnership with Google LLC, to introduce an Ordering Channel that would provide aid to Toast Restaurants in meeting guests from anywhere. With this partnership, both companies would develop Order with Google integration platform where ordering with Google would open up ways for Toast restaurants to get an augmented number of guests ordering food using Google Search Engine and Maps.
Jan-2023: Oracle collaborated with Big Boy Restaurant Group, an American restaurant brand, for modernizing the latter company's systems and to support its legacy of great customer service. The restaurant chain can streamline its ordering and payment processing, while better utilizing the data for managing new opportunities and inventory with the help of Oracle Payment Cloud and MICROS Simphony Cloud Point of Sale Service.
Jan-2023: Toast Partner Ecosystem has been joined by Deliverect, a global scale-up that simplifies digital orders for restaurants. This integration would help restaurants in managing online orders from their Toast Point of Sale easily. Additionally, Deliverect enables a restaurant to combine online orders with their POS, fulfilling the gap between POS systems and third-party providers.
Oct-2022: Oracle signed a partnership with NVIDIA, a tech-enabled software company, supporting customers to overcome business challenges utilizing enhanced computing and AI. With this partnership, NVIDIA AI platforms would provide strength to Oracle Cloud Infrastructure solutions in the advancement of AI-powered innovation to an extensive range of sectors.
Sep-2022: Fiserv teamed up with Indian Oil Corporation Limited, for enhancing the customer payment experiences and streamlining operations. Following this collaboration, IndianOil customers have the ability to pay through multiple payment platforms with smart POS terminals located at more than 15,000 IndianOil retail fuel outlets throughout the country, reducing the wait time at fuel outlets, and redeem loyalty points smoothly.
Sep-2022: Square (now Block) announced its partnership with Sage, a company engaged in financial, accounting, HR, and payroll technology for SMBs. The partnership made small businesses work smarter and saved time, which in turn, freed them for growing their businesses. Moreover, the partnership combined Square's point of sale (POS) software with Sage Accounting and is live in the UK, Canada, and Ireland. Customers utilizing both products can take payments anywhere - over the phone, in person, or online.
Jun-2022: Oracle partnered with Kyndryl, an IT infrastructure services provider, to offer customers managed cloud solutions. Through this partnership, Kyndryl would provide its IT infrastructure services expertise enabling Oracle to advance its Oracle Cloud@Customer and Oracle Exadata offerings and helping Oracle's customers with consolidating databases and reducing operating costs and time.
May-2022: Toast came into collaboration with Stayntouch, a company engaged in guest-centric cloud hotel property management systems and contactless technology. Following this collaboration, Restaurant owners can check a guest room and its posting status, post charges to a guest's room, and view a summary of charges in the guest's folio using Stayntouch's direct integration with Toast PoS. Users will have the option to submit cash and credit card settlements to the PMS folio. Customers of Stayntouch can use Toast PoS to organize their restaurants' operations and strengthen customer relationships.
Mar-2022: Square (now Block) partnered with CodeBase, a technology startup incubator. The partnership aims to deliver entrepreneurs access to Square's payment ecosystem and APIs. Additionally, Square would support the latter company's startup network through providing a series of workshops that helps entrepreneurs in learning from leaders in the payments and commerce fields.
Jan-2022: NCR Corporation and Google Cloud extended their partnership to introduce the additional platform and improved cloud capabilities incorporating AI and machine-learning solutions, making it easier for retailers to access advanced tools for offering a better in-store experience to their consumers. Through this expansion, NCR would broaden the NCR Commerce platform and its Retail software suite over Google Cloud's infrastructure to build a reliable technology that would offer a high-level customized shopping experience.
Jan-2022: Square (now Block) came into collaboration with Ally, Inc. for providing eCommerce, restaurant, and retail businesses with a fully integrated portfolio of tools developed for reducing costs, maximizing profits and streamlining deliveries to customers.
Dec-2021: Revel Systems came into partnership with Adyen, a payment platform. Through utilizing Adyen for Platforms, Revel Systems aims to introduce an integrated payment solution named Revel Advantage International. The solution enables merchants to work with a single vendor for support, technology, and services for ensuring their payments and POS solutions are running smoothly.
Nov-2021: Oracle expanded its partnership with Bharti Airtel, an Indian multinational telecommunications services provider, to introduce a broad range of cloud solutions to enterprise customers. With this expansion, Oracle would extend its reach in India with Nxtra-the data center subsidiary of Airtel, enabling Indian customers to utilize the next-generation cloud infrastructure.
Oct-2021: Fiserv extended its partnership with Synchrony, a consumer financing company. Through this expansion, small businesses can access Synchrony products and services and can receive private label credit card payments through the Clover business management and point of sale platform from Fiserv. This step would hasten the growth of small businesses and would provide more choices and flexibility in how consumers make purchases.
Apr-2021: Revel Systems signed a collaboration agreement with Paytronix Systems, the digital guest experience platform. Following this collaboration, the latter company combined its loyalty platform with the former company's cloud-based point of sale and business platform. Those retailers and restaurants who have implemented Revel Enterprise can access the complete Paytronix Rewards Platform fastly that comprises online ordering/delivery management, loyalty, and stored value.
Apr-2021: Fiserv signed a partnership with PayPal for helping businesses of all sizes through the range of industries to broaden their touch-free payment capabilities and support in-demand digital payment options. The large businesses that are utilizing Fiserv's Carat omnichannel commerce ecosystem and the small businesses using Clover can accept payment through PayPal and Venmo through QR codes shown at the point of sale.
Feb-2021: Oracle announced a collaboration with Cabana Burger, a fast-growing Brazilian restaurant chain, in which the latter company is utilizing Oracle MICROS Simphony Point-of-Sale for better serving the customers and aid its fast growth. Cabana Burger has boosted its speed of service, decreased waste, and increased overall business efficiencies with real-time restaurant data and analytics using MICROS Simphony with built-in kitchen display systems (KDS).
Product Launches and Expansions:
Sep-2022: Square (now Block) introduced Tap to Pay on iPhone, which is available within the Square Point of Sale iOS app. The Tap to Pay on iPhone has been launched to millions of sellers throughout the U.S. and would enable the sellers to receive contactless payments through their iPhone directly, with no additional cost to the seller and no additional hardware.
Apr-2022: Toast unveiled Toast for Quick Service, a specially designed solution for quick-service restaurants (QSR) of all sizes. Quick-service restaurants that use Toast would be able to quickly serve customers and increase revenues through utilizing improved digital tools, order and payment workflows, and access to performance information.
Nov-2021: Toast released a line of products including the Toast Restaurant Card, Toast Tips Manager, and business debit card. Toast Restaurant Card would empower restaurant operators to quickly access sales and Toast's POS system would provide easy integration with online food delivery platforms, while Toast Tips Manager would compute and offer pooled tips to Toast Payroll and Team Management.
Oct-2021: Fiserv, Inc. unveiled a platform-as-a-service (PaaS) offering, an innovative PaaS solution, and a part of Fiserv's Clover® Connect-a payment engine for software providers. The PaaS solution would allow independent software vendors (ISVs) to connect their software with Clover POS systems, enabling ISV software users to better serve their customers by providing them with a fusion of business software and secure payment acceptance and POS devices.
Sep-2021: Block, Inc. released Integrated, Omnichannel Offerings for businesses in France. The Omnichannel Solutions is an all-inclusive portfolio of both on-site and online products facilitating businesses of all types to access Block's full stack of integrated business tools, empowering sellers to easily manage multiple systems, cut time and cost, and smoothly run their businesses.
Jan-2021: Square unveiled Square for Retail, a complete POS system designed for providing aid to retailers in better management of their business operations. Square for Retail when integrated with Square Online would provide retailers ease in selling their products online, in-store, and on social platforms. Moreover, the solution would simplify the business' inventory management.
Oct-2019: TouchBistro released the TouchBistro Reservations, a full reservation and guest management platform. This platform was designed for enabling restaurateurs to enhance every guest's experience. TouchBistro Reservations offers restaurants automatic deep insights about their customers' behavior that were not previously available to them, such as spend and dining history, drink preferences, and other details that will enable restaurants to better serve their patrons. TouchBistro Reservations is fully integrated with TouchBistro POS.
Feb-2019: Revel Systems unveiled POS Platforms to fulfill the requirements of businesses and SMB customers. POS platforms would incorporate two distinctive product offerings namely, Revel Enterprise- a business platform that would provide support to organizations in enhancing the performance of multi-location or chain businesses and offers tools for scaling up the businesses, and Revel Essentials- a POS and business solution developed for restaurants and retailers with 20 or fewer locations.
Acquisitions and Mergers:
Feb-2023: Toast acquired Delphi Display Systems, a provider of digital display solutions and drive-thru technology for quick-service restaurants. The acquisition deepens Toast's support for customers operating a drive-thru service model.
Jan-2023: Valsoft Corporation, the parent company of H&L POS, took over Octave, a company specializing in POS Software. The acquisition enabled Aspire, the operating division of Valsoft, to continue its investment and grow in the Retail POS segment.
Sep-2022: Fiserv took over the LR2 Group, an independent sales company doing business as the City POS. The acquisition complemented Fiserv's business.
Jan-2022: NCR took over LibertyX, a cryptocurrency software provider. Through this acquisition, LibertyX would support NCR in offering its customers an all-inclusive digital currency solution incorporating the potential to purchase and sell cryptocurrency, transact international money transfers, and receive digital currency payments all over digital and physical channels.
Oct-2021: MSL completed the acquisition of OrderMate POS business together with Taubman Capital for commencing their US growth strategy. The acquisition expanded MSL's foothold from approximately 6,000 venues to more than 8,000 venues.
Aug-2021: NCR Corporation acquired Foremost Business Systems, a POS and restaurant solutions provider. With this acquisition, NCR would be able to extend its reach in delivering restaurant technology to local restaurant markets utilizing Foremost Business Systems' POS and restaurant solutions offerings helping restaurants to expand and seamlessly run their businesses.
Jan-2021: NCR Corporation announced the acquisition of Freshop and would combine it into its enterprise POS Software platform. The acquisition gave the ability to establish "buy online, pickup in-store" capabilities to retailers for fulfilling the customers' needs directly.
Scope of the Study
Market Segments covered in the Report:
By Application
- Fixed POS
- Mobile POS
By Deployment Mode
- On-Premise
- Cloud
By Organization Size
- Large Enterprises
- SMEs
By End User
- Retail
- Restaurants
- Hospitality
- Warehouse
- Healthcare
- Entertainment
- Others
By Geography
- North America
- US
- Canada
- Mexico
- Rest of North America
- Europe
- Germany
- UK
- France
- Russia
- Spain
- Italy
- Rest of Europe
- Asia Pacific
- China
- Japan
- India
- South Korea
- Singapore
- Malaysia
- Rest of Asia Pacific
- LAMEA
- Brazil
- Argentina
- UAE
- Saudi Arabia
- South Africa
- Nigeria
- Rest of LAMEA
Companies Profiled
- Fiserv, Inc. (Clover Network, Inc.)
- Oracle Corporation
- Toast, Inc.
- NCR Corporation
- Revel Systems (Welsh, Carson, Anderson & Stowe)
- MSL Solutions Limited (Pemba Capital Partners)
- Block, Inc.
- H&L POS (Valsoft Corporation)
- Idealpos Solutions Pty Ltd
- TouchBistro, Inc.
Unique Offerings from KBV Research
- Exhaustive coverage
- Highest number of market tables and figures
- Subscription based model available
- Guaranteed best price
- Assured post sales research support with 10% customization free
Table of Contents
Chapter 1. Market Scope & Methodology
- 1.1 Market Definition
- 1.2 Objectives
- 1.3 Market Scope
- 1.4 Segmentation
- 1.4.1 Global Point-of-Sale Software Market, by Application
- 1.4.2 Global Point-of-Sale Software Market, by Deployment Mode
- 1.4.3 Global Point-of-Sale Software Market, by Organization Size
- 1.4.4 Global Point-of-Sale Software Market, by End User
- 1.4.5 Global Point-of-Sale Software Market, by Geography
- 1.5 Methodology for the research
Chapter 2. Market Overview
- 2.1 Introduction
- 2.1.1 Overview
- 2.1.1.1 Market Composition & Scenario
- 2.1.1 Overview
- 2.2 Key Factors Impacting the Market
- 2.2.1 Market Drivers
- 2.2.2 Market Restraints
Chapter 3. Competition Analysis - Global
- 3.1 KBV Cardinal Matrix
- 3.2 Recent Industry Wide Strategic Developments
- 3.2.1 Partnerships, Collaborations and Agreements
- 3.2.2 Product Launches and Product Expansions
- 3.2.3 Acquisition and Mergers
- 3.3 Top Winning Strategies
- 3.3.1 Key Leading Strategies: Percentage Distribution (2018-2022)
- 3.3.2 Key Strategic Move: (Partnerships, Collaborations & Agreements: 2019, Jan - 2023, Feb) Leading Players
Chapter 4. Global Point-of-Sale Software Market by Application
- 4.1 Global Fixed POS Market by Region
- 4.2 Global Mobile POS Market by Region
Chapter 5. Global Point-of-Sale Software Market by Deployment Mode
- 5.1 Global On-Premise Market by Region
- 5.2 Global Cloud Market by Region
Chapter 6. Global Point-of-Sale Software Market by Organization Size
- 6.1 Global Large Enterprises Market by Region
- 6.2 Global SMEs Market by Region
Chapter 7. Global Point-of-Sale Software Market by End User
- 7.1 Global Retail Market by Region
- 7.2 Global Restaurants Market by Region
- 7.3 Global Hospitality Market by Region
- 7.4 Global Warehouse Market by Region
- 7.5 Global Healthcare Market by Region
- 7.6 Global Entertainment Market by Region
- 7.7 Global Others Market by Region
Chapter 8. Global Point-of-Sale Software Market by Region
- 8.1 North America Point-of-Sale Software Market
- 8.1.1 North America Point-of-Sale Software Market by Application
- 8.1.1.1 North America Fixed POS Market by Country
- 8.1.1.2 North America Mobile POS Market by Country
- 8.1.2 North America Point-of-Sale Software Market by Deployment Mode
- 8.1.2.1 North America On-Premise Market by Country
- 8.1.2.2 North America Cloud Market by Country
- 8.1.3 North America Point-of-Sale Software Market by Organization Size
- 8.1.3.1 North America Large Enterprises Market by Country
- 8.1.3.2 North America SMEs Market by Country
- 8.1.4 North America Point-of-Sale Software Market by End User
- 8.1.4.1 North America Retail Market by Country
- 8.1.4.2 North America Restaurants Market by Country
- 8.1.4.3 North America Hospitality Market by Country
- 8.1.4.4 North America Warehouse Market by Country
- 8.1.4.5 North America Healthcare Market by Country
- 8.1.4.6 North America Entertainment Market by Country
- 8.1.4.7 North America Others Market by Country
- 8.1.5 North America Point-of-Sale Software Market by Country
- 8.1.5.1 US Point-of-Sale Software Market
- 8.1.5.1.1 US Point-of-Sale Software Market by Application
- 8.1.5.1.2 US Point-of-Sale Software Market by Deployment Mode
- 8.1.5.1.3 US Point-of-Sale Software Market by Organization Size
- 8.1.5.1.4 US Point-of-Sale Software Market by End User
- 8.1.5.2 Canada Point-of-Sale Software Market
- 8.1.5.2.1 Canada Point-of-Sale Software Market by Application
- 8.1.5.2.2 Canada Point-of-Sale Software Market by Deployment Mode
- 8.1.5.2.3 Canada Point-of-Sale Software Market by Organization Size
- 8.1.5.2.4 Canada Point-of-Sale Software Market by End User
- 8.1.5.3 Mexico Point-of-Sale Software Market
- 8.1.5.3.1 Mexico Point-of-Sale Software Market by Application
- 8.1.5.3.2 Mexico Point-of-Sale Software Market by Deployment Mode
- 8.1.5.3.3 Mexico Point-of-Sale Software Market by Organization Size
- 8.1.5.3.4 Mexico Point-of-Sale Software Market by End User
- 8.1.5.4 Rest of North America Point-of-Sale Software Market
- 8.1.5.4.1 Rest of North America Point-of-Sale Software Market by Application
- 8.1.5.4.2 Rest of North America Point-of-Sale Software Market by Deployment Mode
- 8.1.5.4.3 Rest of North America Point-of-Sale Software Market by Organization Size
- 8.1.5.4.4 Rest of North America Point-of-Sale Software Market by End User
- 8.1.5.1 US Point-of-Sale Software Market
- 8.1.1 North America Point-of-Sale Software Market by Application
- 8.2 Europe Point-of-Sale Software Market
- 8.2.1 Europe Point-of-Sale Software Market by Application
- 8.2.1.1 Europe Fixed POS Market by Country
- 8.2.1.2 Europe Mobile POS Market by Country
- 8.2.2 Europe Point-of-Sale Software Market by Deployment Mode
- 8.2.2.1 Europe On-Premise Market by Country
- 8.2.2.2 Europe Cloud Market by Country
- 8.2.3 Europe Point-of-Sale Software Market by Organization Size
- 8.2.3.1 Europe Large Enterprises Market by Country
- 8.2.3.2 Europe SMEs Market by Country
- 8.2.4 Europe Point-of-Sale Software Market by End User
- 8.2.4.1 Europe Retail Market by Country
- 8.2.4.2 Europe Restaurants Market by Country
- 8.2.4.3 Europe Hospitality Market by Country
- 8.2.4.4 Europe Warehouse Market by Country
- 8.2.4.5 Europe Healthcare Market by Country
- 8.2.4.6 Europe Entertainment Market by Country
- 8.2.4.7 Europe Others Market by Country
- 8.2.5 Europe Point-of-Sale Software Market by Country
- 8.2.5.1 Germany Point-of-Sale Software Market
- 8.2.5.1.1 Germany Point-of-Sale Software Market by Application
- 8.2.5.1.2 Germany Point-of-Sale Software Market by Deployment Mode
- 8.2.5.1.3 Germany Point-of-Sale Software Market by Organization Size
- 8.2.5.1.4 Germany Point-of-Sale Software Market by End User
- 8.2.5.2 UK Point-of-Sale Software Market
- 8.2.5.2.1 UK Point-of-Sale Software Market by Application
- 8.2.5.2.2 UK Point-of-Sale Software Market by Deployment Mode
- 8.2.5.2.3 UK Point-of-Sale Software Market by Organization Size
- 8.2.5.2.4 UK Point-of-Sale Software Market by End User
- 8.2.5.3 France Point-of-Sale Software Market
- 8.2.5.3.1 France Point-of-Sale Software Market by Application
- 8.2.5.3.2 France Point-of-Sale Software Market by Deployment Mode
- 8.2.5.3.3 France Point-of-Sale Software Market by Organization Size
- 8.2.5.3.4 France Point-of-Sale Software Market by End User
- 8.2.5.4 Russia Point-of-Sale Software Market
- 8.2.5.4.1 Russia Point-of-Sale Software Market by Application
- 8.2.5.4.2 Russia Point-of-Sale Software Market by Deployment Mode
- 8.2.5.4.3 Russia Point-of-Sale Software Market by Organization Size
- 8.2.5.4.4 Russia Point-of-Sale Software Market by End User
- 8.2.5.5 Spain Point-of-Sale Software Market
- 8.2.5.5.1 Spain Point-of-Sale Software Market by Application
- 8.2.5.5.2 Spain Point-of-Sale Software Market by Deployment Mode
- 8.2.5.5.3 Spain Point-of-Sale Software Market by Organization Size
- 8.2.5.5.4 Spain Point-of-Sale Software Market by End User
- 8.2.5.6 Italy Point-of-Sale Software Market
- 8.2.5.6.1 Italy Point-of-Sale Software Market by Application
- 8.2.5.6.2 Italy Point-of-Sale Software Market by Deployment Mode
- 8.2.5.6.3 Italy Point-of-Sale Software Market by Organization Size
- 8.2.5.6.4 Italy Point-of-Sale Software Market by End User
- 8.2.5.7 Rest of Europe Point-of-Sale Software Market
- 8.2.5.7.1 Rest of Europe Point-of-Sale Software Market by Application
- 8.2.5.7.2 Rest of Europe Point-of-Sale Software Market by Deployment Mode
- 8.2.5.7.3 Rest of Europe Point-of-Sale Software Market by Organization Size
- 8.2.5.7.4 Rest of Europe Point-of-Sale Software Market by End User
- 8.2.5.1 Germany Point-of-Sale Software Market
- 8.2.1 Europe Point-of-Sale Software Market by Application
- 8.3 Asia Pacific Point-of-Sale Software Market
- 8.3.1 Asia Pacific Point-of-Sale Software Market by Application
- 8.3.1.1 Asia Pacific Fixed POS Market by Country
- 8.3.1.2 Asia Pacific Mobile POS Market by Country
- 8.3.2 Asia Pacific Point-of-Sale Software Market by Deployment Mode
- 8.3.2.1 Asia Pacific On-Premise Market by Country
- 8.3.2.2 Asia Pacific Cloud Market by Country
- 8.3.3 Asia Pacific Point-of-Sale Software Market by Organization Size
- 8.3.3.1 Asia Pacific Large Enterprises Market by Country
- 8.3.3.2 Asia Pacific SMEs Market by Country
- 8.3.4 Asia Pacific Point-of-Sale Software Market by End User
- 8.3.4.1 Asia Pacific Retail Market by Country
- 8.3.4.2 Asia Pacific Restaurants Market by Country
- 8.3.4.3 Asia Pacific Hospitality Market by Country
- 8.3.4.4 Asia Pacific Warehouse Market by Country
- 8.3.4.5 Asia Pacific Healthcare Market by Country
- 8.3.4.6 Asia Pacific Entertainment Market by Country
- 8.3.4.7 Asia Pacific Others Market by Country
- 8.3.5 Asia Pacific Point-of-Sale Software Market by Country
- 8.3.5.1 China Point-of-Sale Software Market
- 8.3.5.1.1 China Point-of-Sale Software Market by Application
- 8.3.5.1.2 China Point-of-Sale Software Market by Deployment Mode
- 8.3.5.1.3 China Point-of-Sale Software Market by Organization Size
- 8.3.5.1.4 China Point-of-Sale Software Market by End User
- 8.3.5.2 Japan Point-of-Sale Software Market
- 8.3.5.2.1 Japan Point-of-Sale Software Market by Application
- 8.3.5.2.2 Japan Point-of-Sale Software Market by Deployment Mode
- 8.3.5.2.3 Japan Point-of-Sale Software Market by Organization Size
- 8.3.5.2.4 Japan Point-of-Sale Software Market by End User
- 8.3.5.3 India Point-of-Sale Software Market
- 8.3.5.3.1 India Point-of-Sale Software Market by Application
- 8.3.5.3.2 India Point-of-Sale Software Market by Deployment Mode
- 8.3.5.3.3 India Point-of-Sale Software Market by Organization Size
- 8.3.5.3.4 India Point-of-Sale Software Market by End User
- 8.3.5.4 South Korea Point-of-Sale Software Market
- 8.3.5.4.1 South Korea Point-of-Sale Software Market by Application
- 8.3.5.4.2 South Korea Point-of-Sale Software Market by Deployment Mode
- 8.3.5.4.3 South Korea Point-of-Sale Software Market by Organization Size
- 8.3.5.4.4 South Korea Point-of-Sale Software Market by End User
- 8.3.5.5 Singapore Point-of-Sale Software Market
- 8.3.5.5.1 Singapore Point-of-Sale Software Market by Application
- 8.3.5.5.2 Singapore Point-of-Sale Software Market by Deployment Mode
- 8.3.5.5.3 Singapore Point-of-Sale Software Market by Organization Size
- 8.3.5.5.4 Singapore Point-of-Sale Software Market by End User
- 8.3.5.6 Malaysia Point-of-Sale Software Market
- 8.3.5.6.1 Malaysia Point-of-Sale Software Market by Application
- 8.3.5.6.2 Malaysia Point-of-Sale Software Market by Deployment Mode
- 8.3.5.6.3 Malaysia Point-of-Sale Software Market by Organization Size
- 8.3.5.6.4 Malaysia Point-of-Sale Software Market by End User
- 8.3.5.7 Rest of Asia Pacific Point-of-Sale Software Market
- 8.3.5.7.1 Rest of Asia Pacific Point-of-Sale Software Market by Application
- 8.3.5.7.2 Rest of Asia Pacific Point-of-Sale Software Market by Deployment Mode
- 8.3.5.7.3 Rest of Asia Pacific Point-of-Sale Software Market by Organization Size
- 8.3.5.7.4 Rest of Asia Pacific Point-of-Sale Software Market by End User
- 8.3.5.1 China Point-of-Sale Software Market
- 8.3.1 Asia Pacific Point-of-Sale Software Market by Application
- 8.4 LAMEA Point-of-Sale Software Market
- 8.4.1 LAMEA Point-of-Sale Software Market by Application
- 8.4.1.1 LAMEA Fixed POS Market by Country
- 8.4.1.2 LAMEA Mobile POS Market by Country
- 8.4.2 LAMEA Point-of-Sale Software Market by Deployment Mode
- 8.4.2.1 LAMEA On-Premise Market by Country
- 8.4.2.2 LAMEA Cloud Market by Country
- 8.4.3 LAMEA Point-of-Sale Software Market by Organization Size
- 8.4.3.1 LAMEA Large Enterprises Market by Country
- 8.4.3.2 LAMEA SMEs Market by Country
- 8.4.4 LAMEA Point-of-Sale Software Market by End User
- 8.4.4.1 LAMEA Retail Market by Country
- 8.4.4.2 LAMEA Restaurants Market by Country
- 8.4.4.3 LAMEA Hospitality Market by Country
- 8.4.4.4 LAMEA Warehouse Market by Country
- 8.4.4.5 LAMEA Healthcare Market by Country
- 8.4.4.6 LAMEA Entertainment Market by Country
- 8.4.4.7 LAMEA Others Market by Country
- 8.4.5 LAMEA Point-of-Sale Software Market by Country
- 8.4.5.1 Brazil Point-of-Sale Software Market
- 8.4.5.1.1 Brazil Point-of-Sale Software Market by Application
- 8.4.5.1.2 Brazil Point-of-Sale Software Market by Deployment Mode
- 8.4.5.1.3 Brazil Point-of-Sale Software Market by Organization Size
- 8.4.5.1.4 Brazil Point-of-Sale Software Market by End User
- 8.4.5.2 Argentina Point-of-Sale Software Market
- 8.4.5.2.1 Argentina Point-of-Sale Software Market by Application
- 8.4.5.2.2 Argentina Point-of-Sale Software Market by Deployment Mode
- 8.4.5.2.3 Argentina Point-of-Sale Software Market by Organization Size
- 8.4.5.2.4 Argentina Point-of-Sale Software Market by End User
- 8.4.5.3 UAE Point-of-Sale Software Market
- 8.4.5.3.1 UAE Point-of-Sale Software Market by Application
- 8.4.5.3.2 UAE Point-of-Sale Software Market by Deployment Mode
- 8.4.5.3.3 UAE Point-of-Sale Software Market by Organization Size
- 8.4.5.3.4 UAE Point-of-Sale Software Market by End User
- 8.4.5.4 Saudi Arabia Point-of-Sale Software Market
- 8.4.5.4.1 Saudi Arabia Point-of-Sale Software Market by Application
- 8.4.5.4.2 Saudi Arabia Point-of-Sale Software Market by Deployment Mode
- 8.4.5.4.3 Saudi Arabia Point-of-Sale Software Market by Organization Size
- 8.4.5.4.4 Saudi Arabia Point-of-Sale Software Market by End User
- 8.4.5.5 South Africa Point-of-Sale Software Market
- 8.4.5.5.1 South Africa Point-of-Sale Software Market by Application
- 8.4.5.5.2 South Africa Point-of-Sale Software Market by Deployment Mode
- 8.4.5.5.3 South Africa Point-of-Sale Software Market by Organization Size
- 8.4.5.5.4 South Africa Point-of-Sale Software Market by End User
- 8.4.5.6 Nigeria Point-of-Sale Software Market
- 8.4.5.6.1 Nigeria Point-of-Sale Software Market by Application
- 8.4.5.6.2 Nigeria Point-of-Sale Software Market by Deployment Mode
- 8.4.5.6.3 Nigeria Point-of-Sale Software Market by Organization Size
- 8.4.5.6.4 Nigeria Point-of-Sale Software Market by End User
- 8.4.5.7 Rest of LAMEA Point-of-Sale Software Market
- 8.4.5.7.1 Rest of LAMEA Point-of-Sale Software Market by Application
- 8.4.5.7.2 Rest of LAMEA Point-of-Sale Software Market by Deployment Mode
- 8.4.5.7.3 Rest of LAMEA Point-of-Sale Software Market by Organization Size
- 8.4.5.7.4 Rest of LAMEA Point-of-Sale Software Market by End User
- 8.4.5.1 Brazil Point-of-Sale Software Market
- 8.4.1 LAMEA Point-of-Sale Software Market by Application
Chapter 9. Company Profiles
- 9.1 Fiserv, Inc. (Clover Network, Inc.)
- 9.1.1 Company Overview
- 9.1.2 Financial Analysis
- 9.1.3 Segmental and Regional Analysis
- 9.1.4 Recent strategies and developments:
- 9.1.4.1 Acquisition and Mergers:
- 9.1.4.2 Product Launches and Product Expansions:
- 9.1.4.3 Partnerships, Collaborations, and Agreements:
- 9.1.5 SWOT Analysis
- 9.2 Oracle Corporation
- 9.2.1 Company Overview
- 9.2.2 Financial Analysis
- 9.2.3 Segmental and Regional Analysis
- 9.2.4 Research & Development Expense
- 9.2.5 Recent strategies and developments:
- 9.2.5.1 Partnerships, Collaborations, and Agreements:
- 9.2.6 SWOT Analysis
- 9.3 Toast, Inc.
- 9.3.1 Company Overview
- 9.3.2 Financial Analysis
- 9.3.3 Research & Development Expenses
- 9.3.4 Recent strategies and developments:
- 9.3.4.1 Partnerships, Collaborations, and Agreements:
- 9.3.4.2 Product Launches and Product Expansions:
- 9.3.4.3 Acquisition and Mergers:
- 9.4 NCR Corporation
- 9.4.1 Company Overview
- 9.4.2 Financial Analysis
- 9.4.3 Segmental and Regional Analysis
- 9.4.4 Research & Development Expenses
- 9.4.5 Recent strategies and developments:
- 9.4.5.1 Acquisition and Mergers:
- 9.4.5.2 Partnerships, Collaborations, and Agreements:
- 9.5 Revel Systems (Welsh, Carson, Anderson & Stowe)
- 9.5.1 Company Overview
- 9.5.2 Recent strategies and developments:
- 9.5.2.1 Partnerships, Collaborations, and Agreements:
- 9.5.2.2 Product Launches and Product Expansions:
- 9.6 MSL Solutions Limited (Pemba Capital Partners)
- 9.6.1 Company Overview
- 9.6.2 Financial Analysis
- 9.6.3 Regional Analysis
- 9.6.4 Research & Development Expenses
- 9.6.5 Recent strategies and developments:
- 9.6.5.1 Partnerships, Collaborations, and Agreements:
- 9.6.5.2 Acquisition and Mergers:
- 9.7 Block, Inc.
- 9.7.1 Company Overview
- 9.7.2 Financial Analysis
- 9.7.3 Segmental and Regional Analysis
- 9.7.4 Recent strategies and developments:
- 9.7.4.1 Partnerships, Collaborations, and Agreements:
- 9.7.4.2 Product Launches and Product Expansions:
- 9.8 H&L POS (Valsoft Corporation)
- 9.8.1 Company Overview
- 9.8.2 Recent strategies and developments:
- 9.8.2.1 Partnerships, Collaborations, and Agreements:
- 9.8.2.2 Acquisition and Mergers:
- 9.9 Idealpos Solutions Pty Ltd
- 9.9.1 Company Overview
- 9.9.2 Recent strategies and developments:
- 9.9.2.1 Partnerships, Collaborations, and Agreements:
- 9.10. TouchBistro, Inc.
- 9.10.1 Company Overview
- 9.10.2 Recent strategies and developments:
- 9.10.2.1 Partnerships, Collaborations, and Agreements:
- 9.10.2.2 Product Launches and Product Expansions: